| Param | Original file | Final file |
|---|---|---|
| Filename | modeM0/AS1A10_071T16_9000004348_30223cztM0_level2.evt | modeM0/AS1A10_071T16_9000004348_30223cztM0_level2_quad_clean.evt |
| Size (bytes) | 138,332,160 | 35,274,240 |
| Size | 131.9 MB | 33.6 MB |
| Events in quadrant A | 796,849 | 248,886 |
| Events in quadrant B | 1,223,942 | 255,071 |
| Events in quadrant C | 824,963 | 238,355 |
| Events in quadrant D | 1,243,595 | 218,769 |
| Mode M0 | |||
|---|---|---|---|
| Quadrant | BADHDUFLAG | Total packets | Discarded packets |
| A | 0 | 3252 | 1 |
| B | 0 | 4465 | 1 |
| C | 0 | 3370 | 1 |
| D | 0 | 4656 | 1 |
| Mode M9 | |||
|---|---|---|---|
| Quadrant | BADHDUFLAG | Total packets | Discarded packets |
| A | 0 | 5 | 0 |
| B | 0 | 6 | 0 |
| C | 0 | 6 | 0 |
| D | 0 | 6 | 0 |
| Mode SS | |||
|---|---|---|---|
| Quadrant | BADHDUFLAG | Total packets | Discarded packets |
| A | 0 | 28 | 0 |
| B | 0 | 28 | 0 |
| C | 0 | 28 | 0 |
| D | 0 | 28 | 0 |
| Quadrant | Total seconds | Saturated seconds | Saturation percentage |
|---|---|---|---|
| A | 1440 | 10 | 0.694444% |
| B | 1440 | 14 | 0.972222% |
| C | 1440 | 17 | 1.180556% |
| D | 1440 | 144 | 10.000000% |
Noise dominated data is calculated using 1-second bins in cleaned event files. If a bin has >2000 counts, and if more than 50% of those come from <1% of pixels, then it is considered to be noise-dominated and hence unusable.
| Quadrant | # 1 sec bins | Bins with >0 counts | Bins with >2000 counts | High rate bins dominated by noise | Noise dominated (total time) | Noise dominated (detector-on time) | Marked lightcurve |
|---|---|---|---|---|---|---|---|
| A | 1440 | 1440 | 2 | 2 | 0.14% | 0.14% | 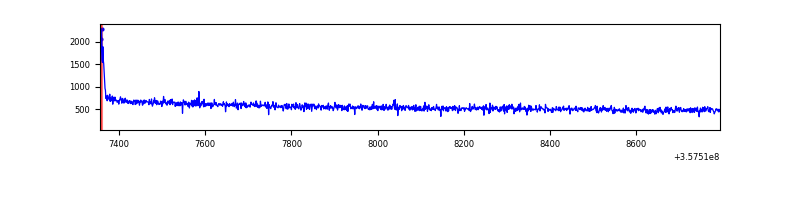 |
| B | 1440 | 1440 | 6 | 6 | 0.42% | 0.42% | 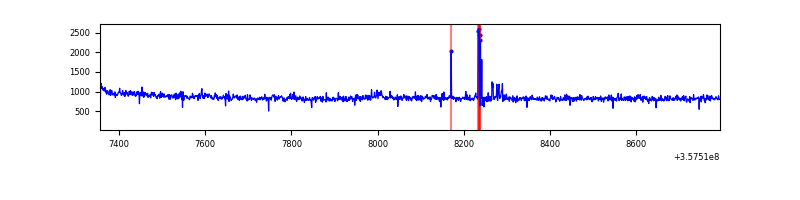 |
| C | 1440 | 1440 | 0 | 0 | 0.00% | 0.00% | 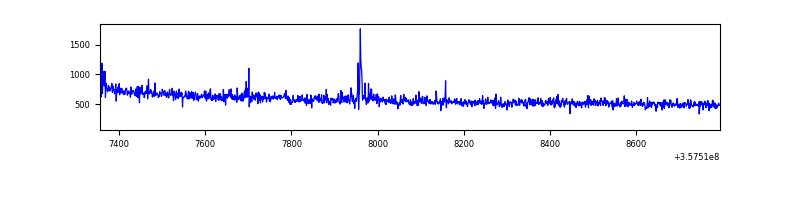 |
| D | 1440 | 1440 | 122 | 122 | 8.47% | 8.47% | 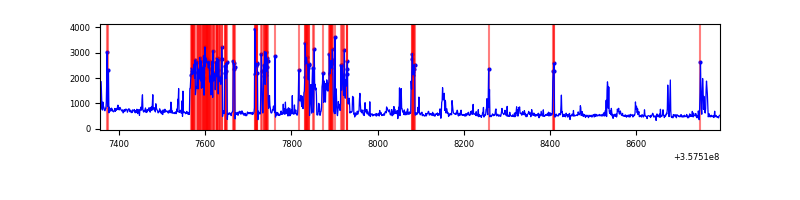 |
Top three noisy pixels from each quadrant. If the there are fewer than three noisy pixels in the level2.evt file, extra rows are filled as -1
| Pixel properties | Quadrant properties | ||||||
|---|---|---|---|---|---|---|---|
| Quadrant | DetID | PixID | Counts | Sigma | Mean | Median | Sigma |
| A | 8 | 192 | 11714 | 275.59 | 203 | 199 | 41.8 |
| A | 13 | 254 | 2771 | 61.55 | 203 | 199 | 41.8 |
| A | 3 | 137 | 1810 | 38.55 | 203 | 199 | 41.8 |
| B | 6 | 159 | 402170 | 10213.19 | 205 | 201 | 39.4 |
| B | 10 | 247 | 17994 | 452.08 | 205 | 201 | 39.4 |
| B | 12 | 111 | 4277 | 103.56 | 205 | 201 | 39.4 |
| C | 14 | 238 | 35453 | 740.44 | 197 | 199 | 47.6 |
| C | 10 | 22 | 7076 | 144.44 | 197 | 199 | 47.6 |
| C | 14 | 254 | 4662 | 93.74 | 197 | 199 | 47.6 |
| D | 1 | 52 | 413970 | 8375.0 | 187 | 184 | 49.4 |
| D | 7 | 223 | 46096 | 929.26 | 187 | 184 | 49.4 |
| D | 2 | 250 | 41688 | 840.04 | 187 | 184 | 49.4 |
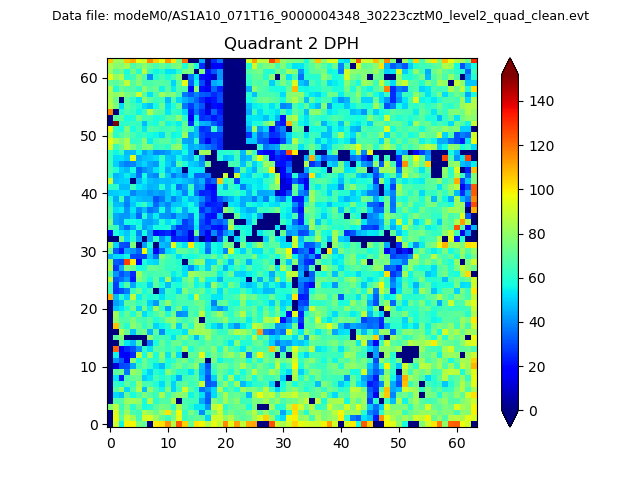
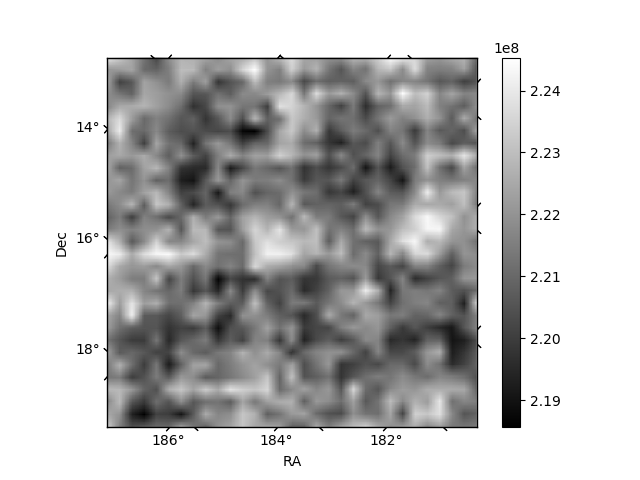
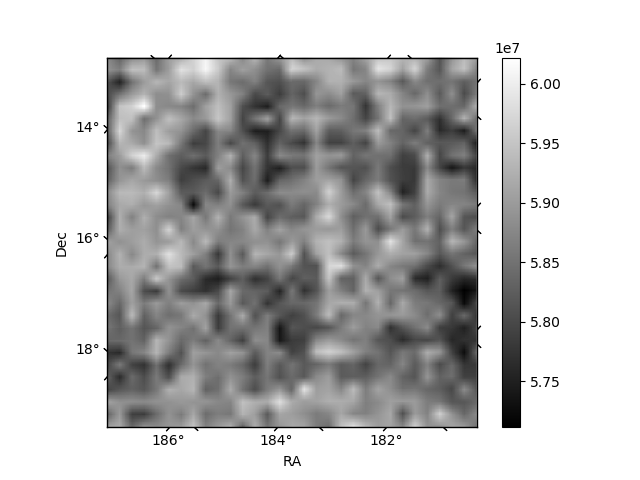
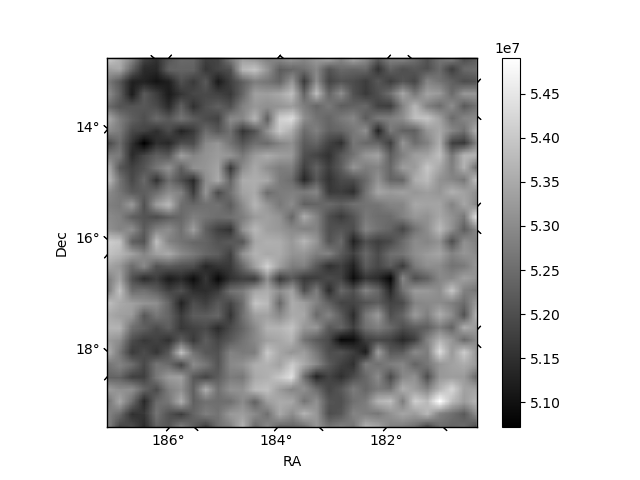
Histogram calculated using DETX and DETY for each event in the final _common_clean file
| Quadrant A | 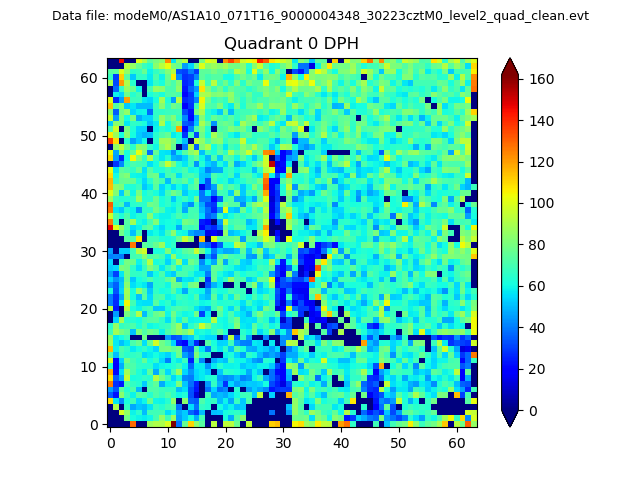 |
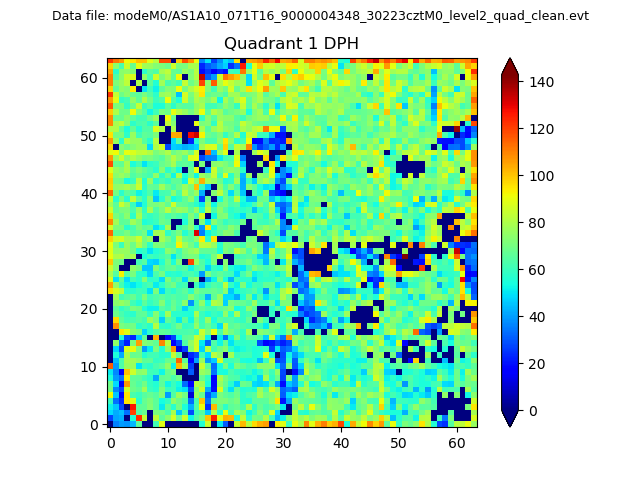 |
Quadrant B |
|---|---|---|---|
| Quadrant D | 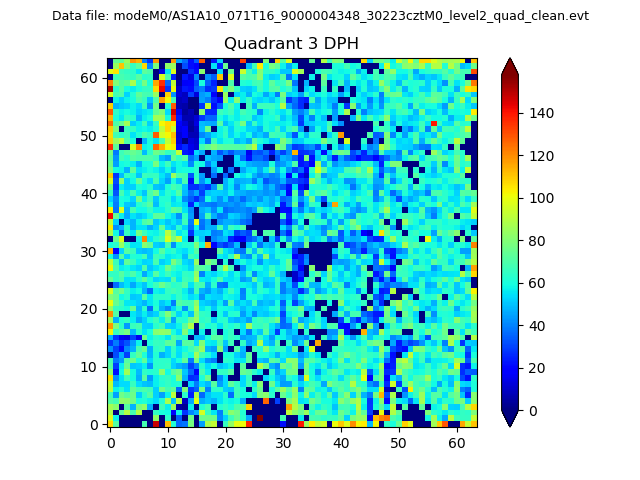 |
 |
Quadrant C |
| Plot type | Count rate plots | Images |
|---|---|---|
| Comparison with Poisson distribution Blue bars denote a histogram of data divided into 1 sec bins. Red curve is a Poisson curve with rate = median count rate of data. |
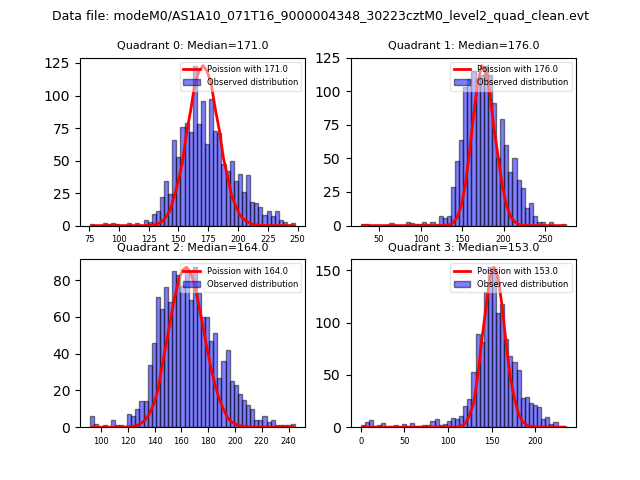 |
 |
| Quadrant-wise count rates Data is divided into 100 sec bins |
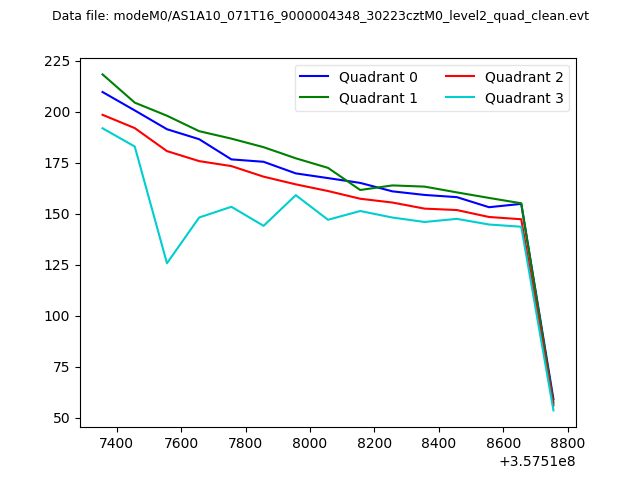 |
|
| Module-wise count rates for Quadrant A Data is divided into 100 sec bins |
 |
 |
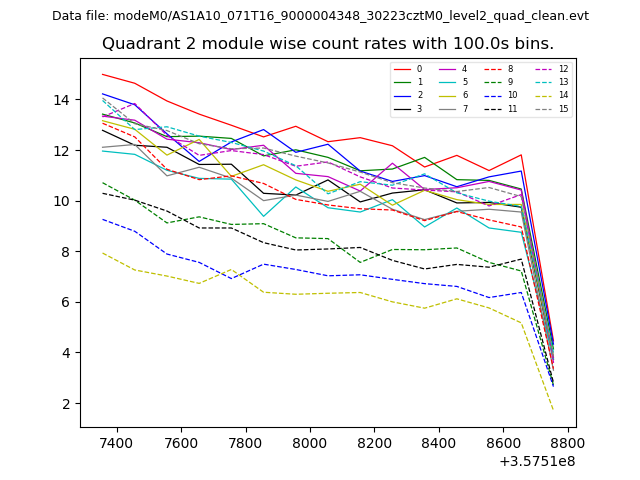
| Module-wise count rates for Quadrant B Data is divided into 100 sec bins |
 |
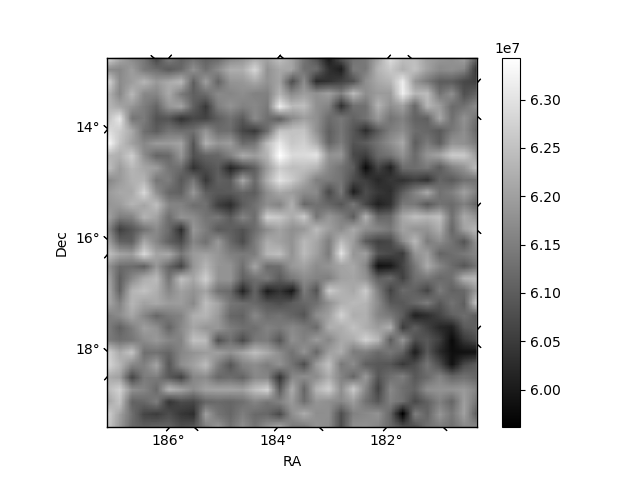 |
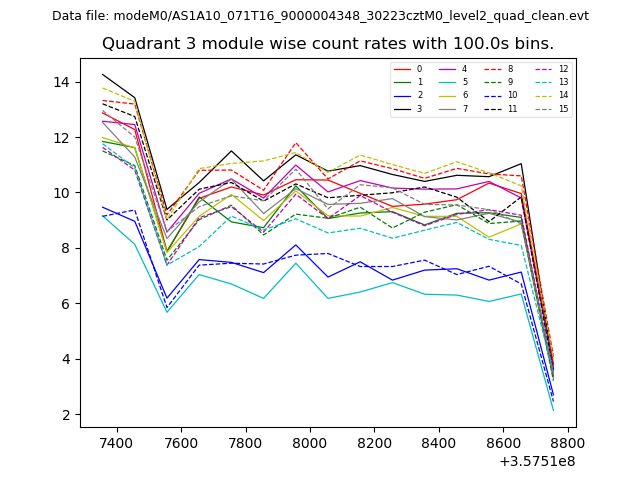
| Module-wise count rates for Quadrant C Data is divided into 100 sec bins |
 |
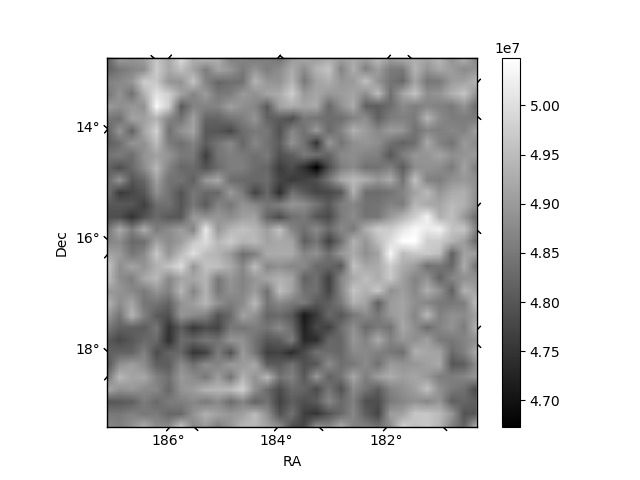 |
| Module-wise count rates for Quadrant D Data is divided into 100 sec bins |
 |
 |
| Parameter | Plot |
|---|---|
| CZT HV Monitor | 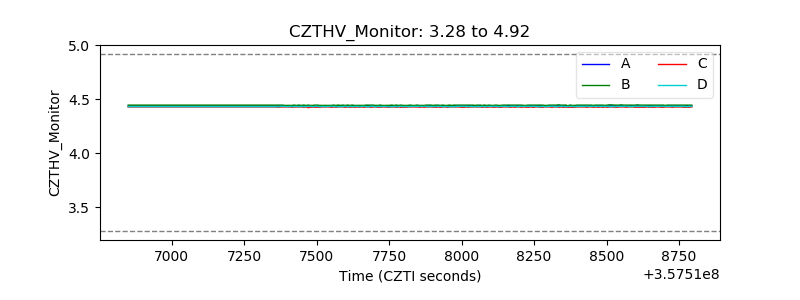 |
| D_VDD | 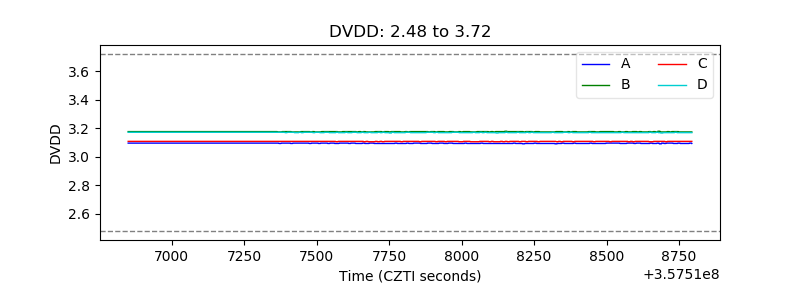 |
| Temperature 1 | 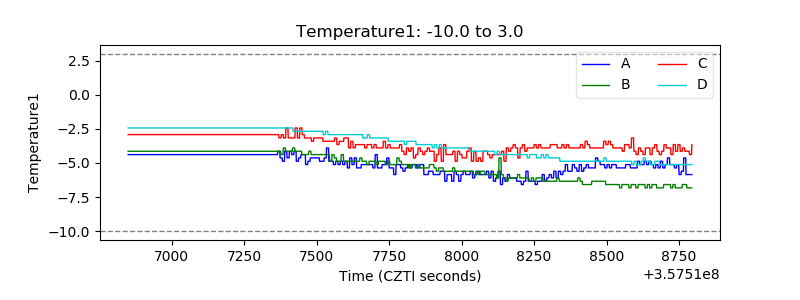 |
| Veto HV Monitor | 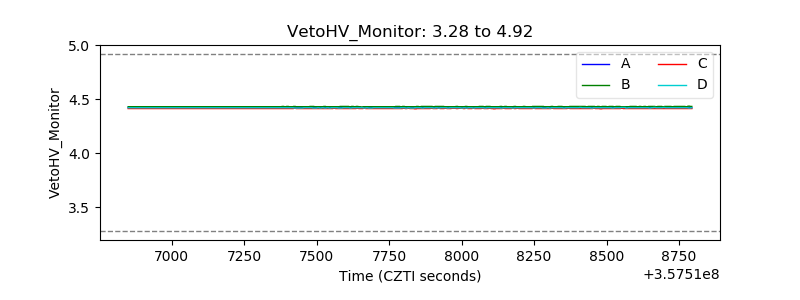 |
| Veto LLD | 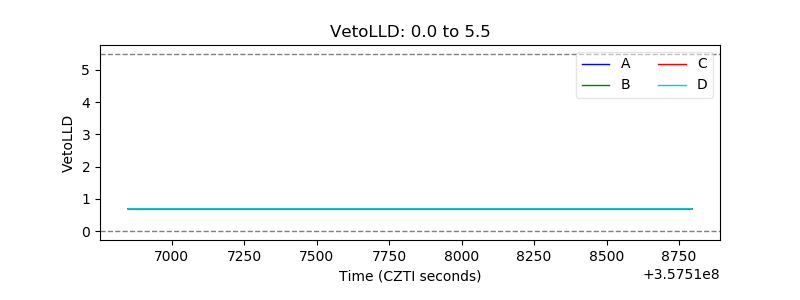 |
| Alpha Counter | 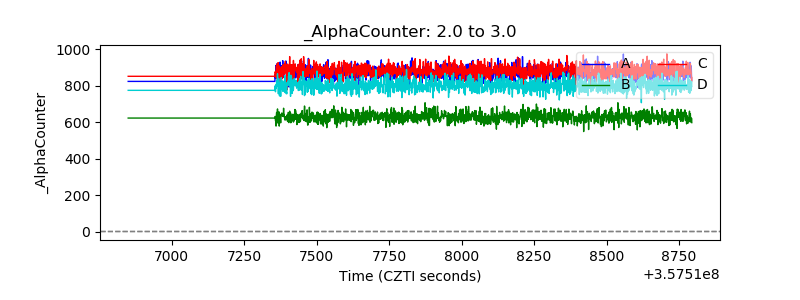 |
| _CPM_Rate | 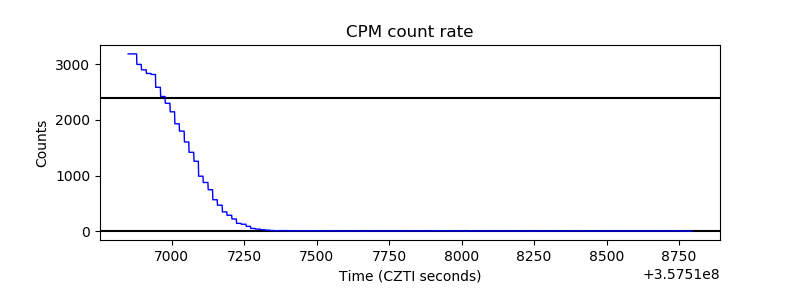 |
| CZT Counter | 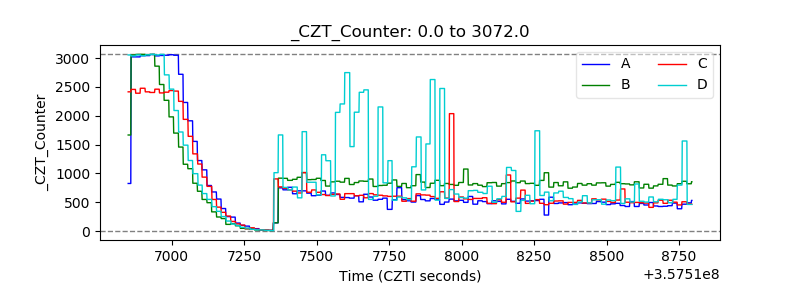 |
| +2.5 Volts monitor | 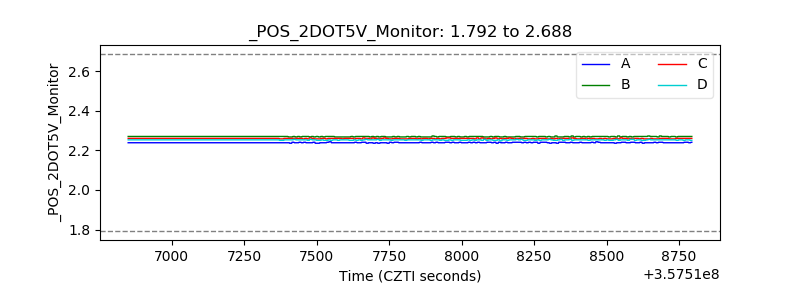 |
| +5 Volts monitor | 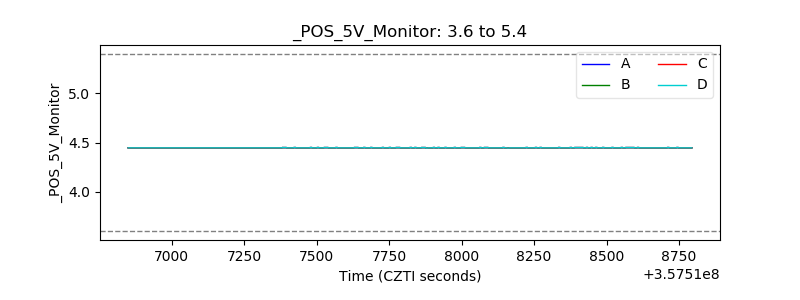 |
| _ROLL_ROT | 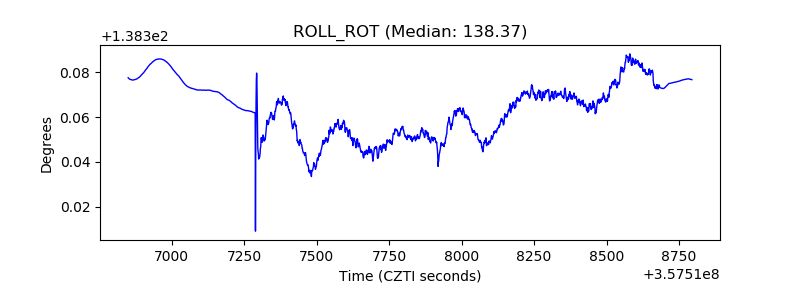 |
| _Roll_DEC | 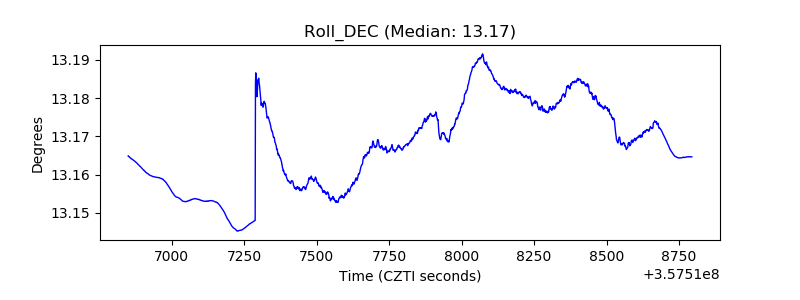 |
| _Roll_RA | 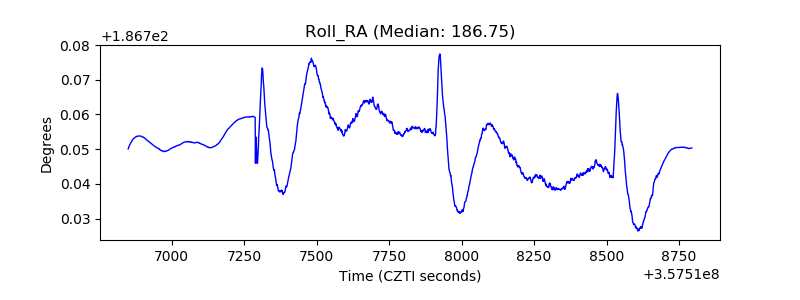 |
| Veto Counter | 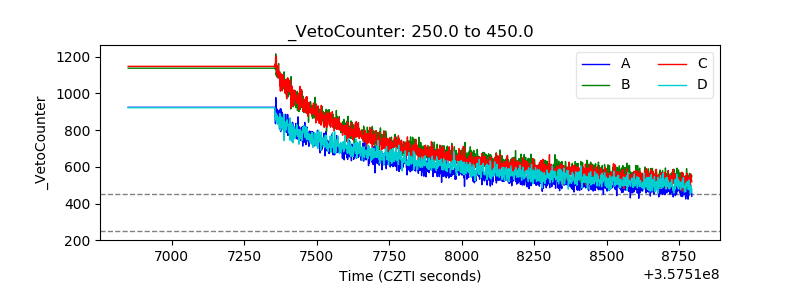 |