| Param | Original file | Final file |
|---|---|---|
| Filename | modeM0/AS1A10_071T17_9000004352_30298cztM0_level2.evt | modeM0/AS1A10_071T17_9000004352_30298cztM0_level2_quad_clean.evt |
| Size (bytes) | 546,969,600 | 88,200,000 |
| Size | 521.6 MB | 84.1 MB |
| Events in quadrant A | 3,301,281 | 570,692 |
| Events in quadrant B | 5,017,511 | 582,551 |
| Events in quadrant C | 3,405,086 | 549,377 |
| Events in quadrant D | 4,407,664 | 521,824 |
| Mode M9 | |||
|---|---|---|---|
| Quadrant | BADHDUFLAG | Total packets | Discarded packets |
| A | 0 | 20 | 0 |
| B | 0 | 21 | 0 |
| C | 0 | 21 | 0 |
| D | 0 | 21 | 0 |
| Mode M0 | |||
|---|---|---|---|
| Quadrant | BADHDUFLAG | Total packets | Discarded packets |
| A | 0 | 13673 | 2 |
| B | 0 | 19393 | 2 |
| C | 0 | 14006 | 2 |
| D | 0 | 17320 | 2 |
| Mode SS | |||
|---|---|---|---|
| Quadrant | BADHDUFLAG | Total packets | Discarded packets |
| A | 0 | 130 | 0 |
| B | 0 | 130 | 0 |
| C | 0 | 130 | 0 |
| D | 0 | 130 | 0 |
| Quadrant | Total seconds | Saturated seconds | Saturation percentage |
|---|---|---|---|
| A | 6397 | 47 | 0.734719% |
| B | 6397 | 99 | 1.547600% |
| C | 6397 | 187 | 2.923245% |
| D | 6397 | 338 | 5.283727% |
Noise dominated data is calculated using 1-second bins in cleaned event files. If a bin has >2000 counts, and if more than 50% of those come from <1% of pixels, then it is considered to be noise-dominated and hence unusable.
| Quadrant | # 1 sec bins | Bins with >0 counts | Bins with >2000 counts | High rate bins dominated by noise | Noise dominated (total time) | Noise dominated (detector-on time) | Marked lightcurve |
|---|---|---|---|---|---|---|---|
| A | 7602 | 6398 | 3 | 3 | 0.04% | 0.05% | 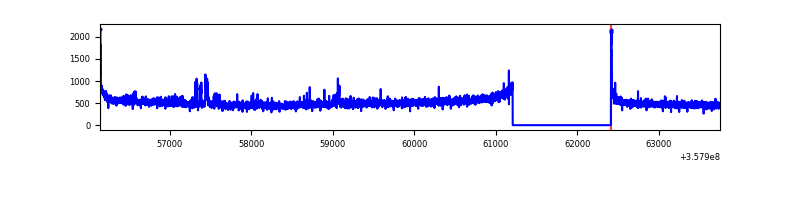 |
| B | 7602 | 6398 | 0 | 0 | 0.00% | 0.00% | 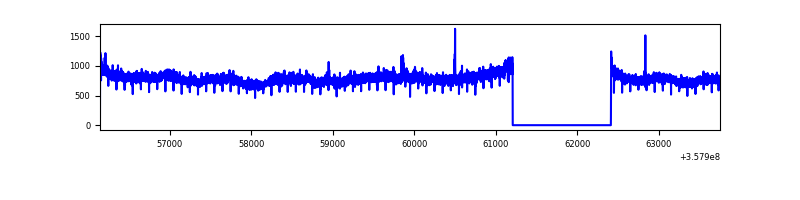 |
| C | 7602 | 6398 | 0 | 0 | 0.00% | 0.00% | 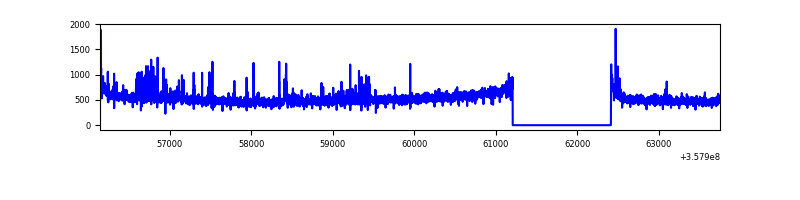 |
| D | 7602 | 6398 | 262 | 262 | 3.45% | 4.10% | 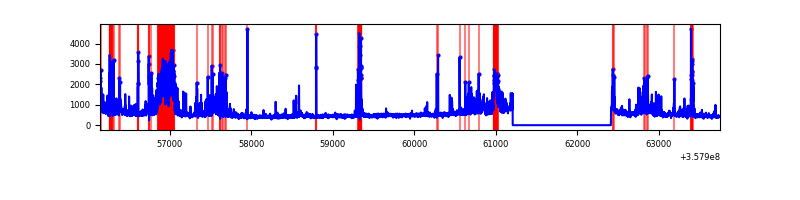 |
Top three noisy pixels from each quadrant. If the there are fewer than three noisy pixels in the level2.evt file, extra rows are filled as -1
| Pixel properties | Quadrant properties | ||||||
|---|---|---|---|---|---|---|---|
| Quadrant | DetID | PixID | Counts | Sigma | Mean | Median | Sigma |
| A | 14 | 239 | 96629 | 579.36 | 825 | 809 | 165.4 |
| A | 8 | 192 | 23789 | 138.95 | 825 | 809 | 165.4 |
| A | 13 | 254 | 10997 | 61.6 | 825 | 809 | 165.4 |
| B | 6 | 159 | 1766446 | 11256.49 | 823 | 803 | 156.9 |
| B | 12 | 111 | 19298 | 117.91 | 823 | 803 | 156.9 |
| B | 0 | 190 | 19001 | 116.02 | 823 | 803 | 156.9 |
| C | 14 | 238 | 182982 | 992.89 | 788 | 796 | 183.5 |
| C | 14 | 254 | 76505 | 412.6 | 788 | 796 | 183.5 |
| C | 3 | 233 | 53640 | 287.99 | 788 | 796 | 183.5 |
| D | 13 | 104 | 768218 | 4201.76 | 772 | 755 | 182.7 |
| D | 1 | 52 | 276332 | 1508.75 | 772 | 755 | 182.7 |
| D | 8 | 195 | 127472 | 693.76 | 772 | 755 | 182.7 |
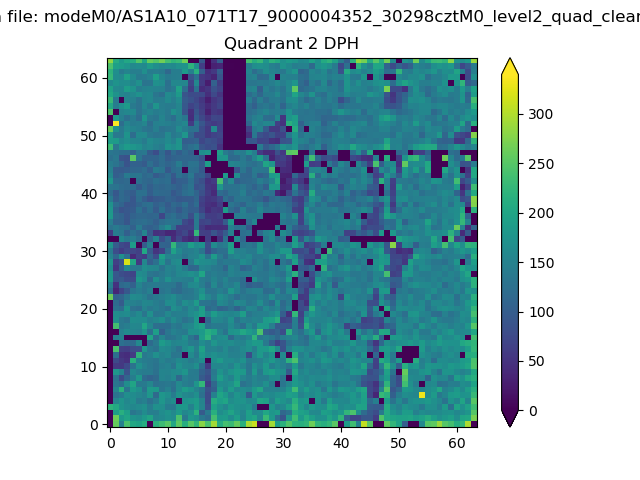
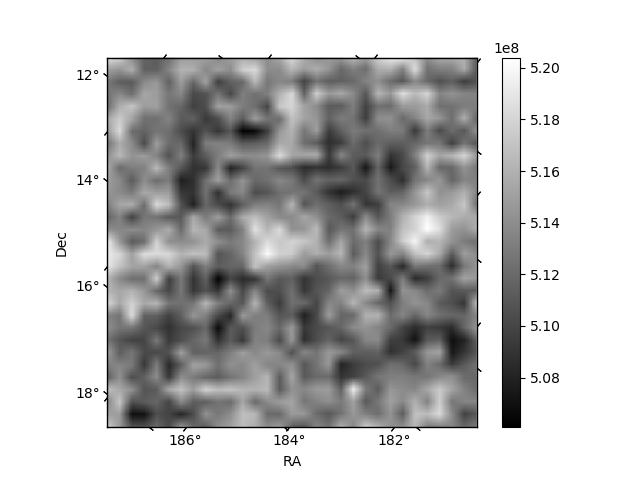
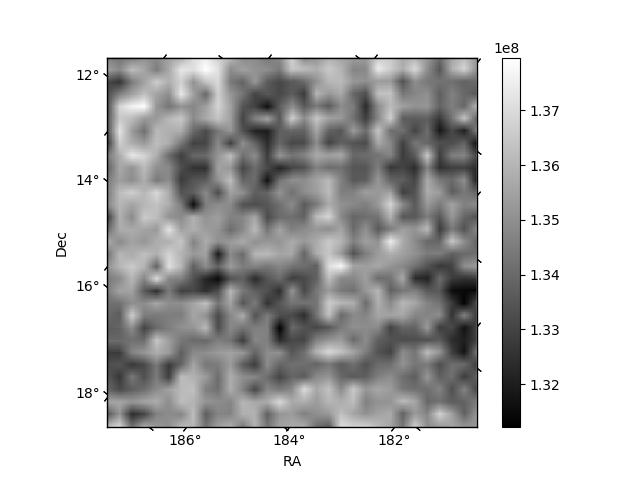
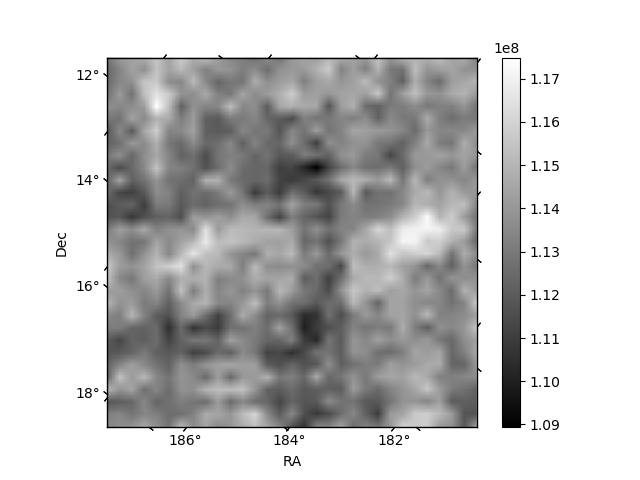
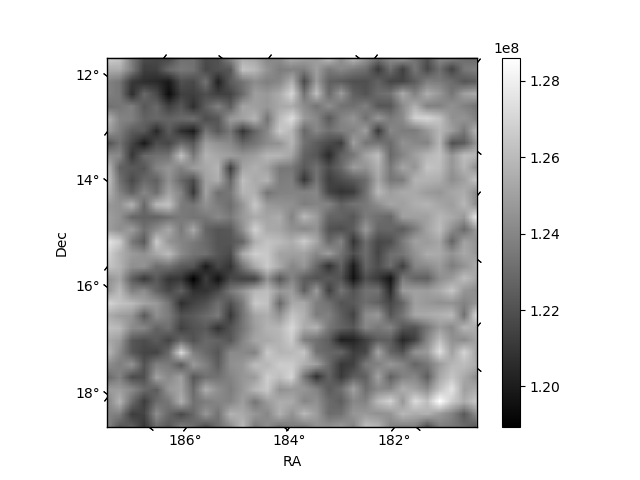
Histogram calculated using DETX and DETY for each event in the final _common_clean file
| Quadrant A | 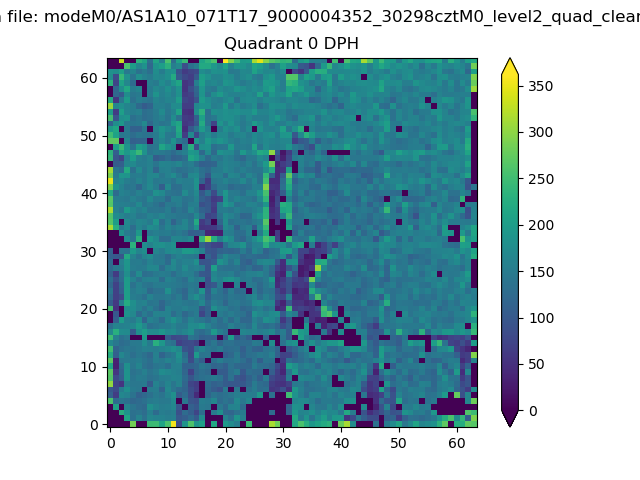 |
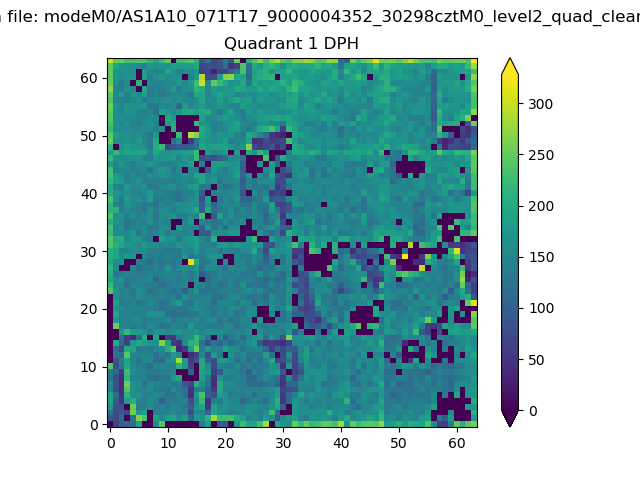 |
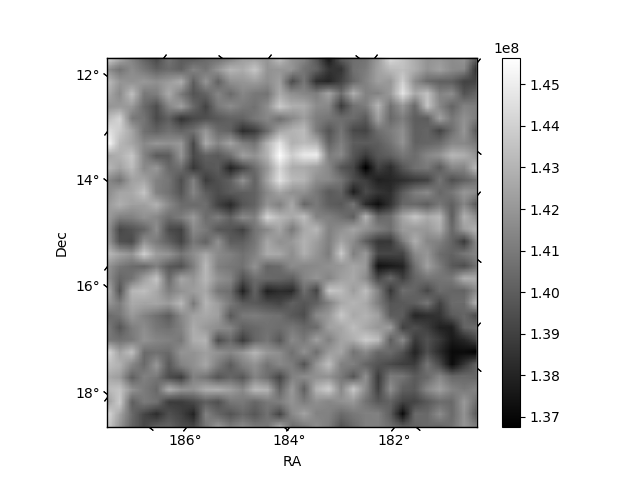
Quadrant B |
|---|---|---|---|
| Quadrant D | 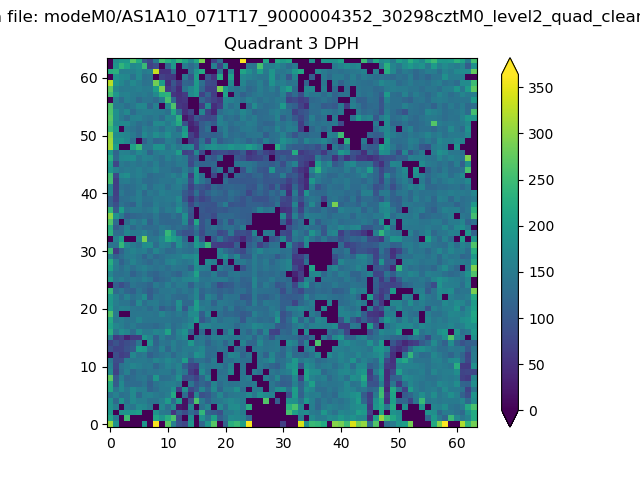 |
 |
Quadrant C |
| Plot type | Count rate plots | Images |
|---|---|---|
| Comparison with Poisson distribution Blue bars denote a histogram of data divided into 1 sec bins. Red curve is a Poisson curve with rate = median count rate of data. |
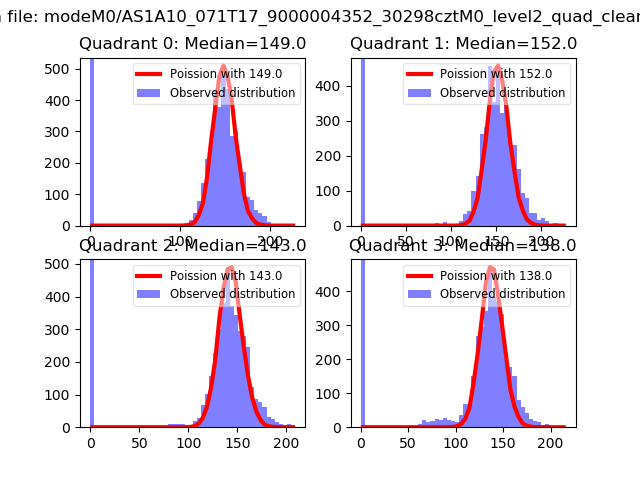 |
 |
| Quadrant-wise count rates Data is divided into 100 sec bins |
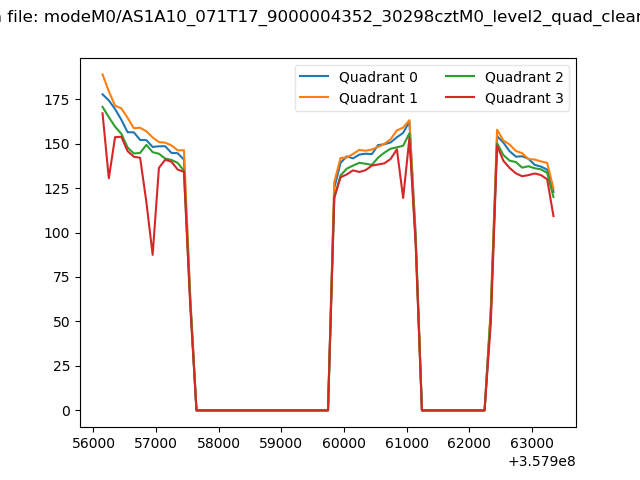 |
|
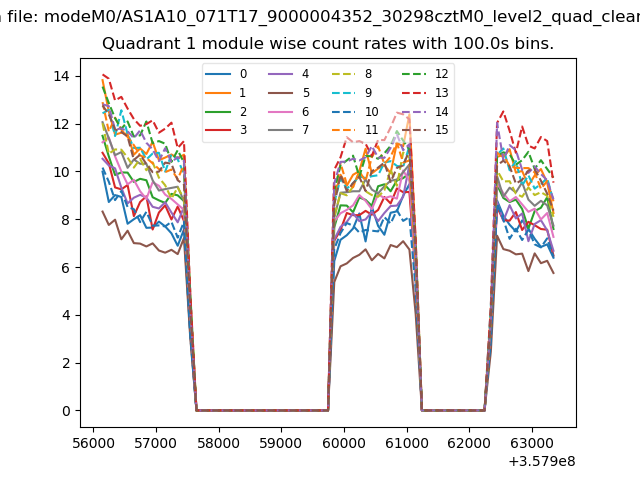
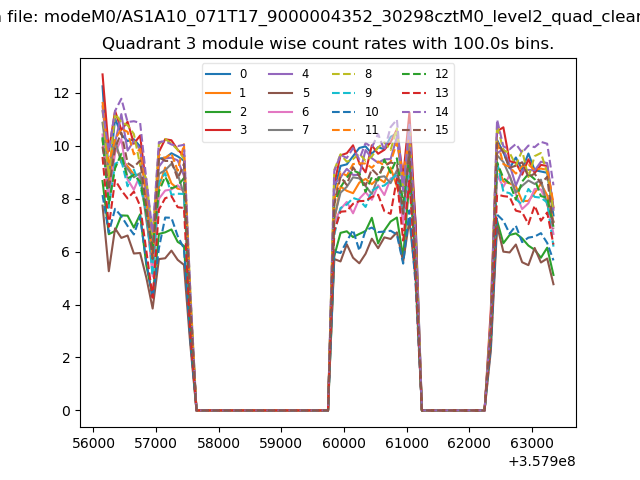
| Module-wise count rates for Quadrant A Data is divided into 100 sec bins |
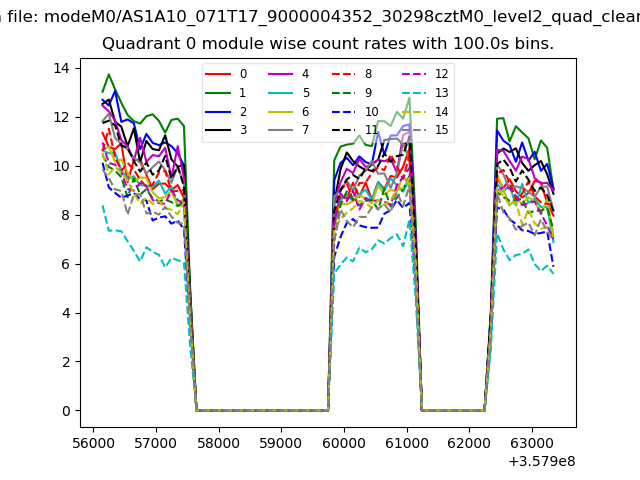 |
 |
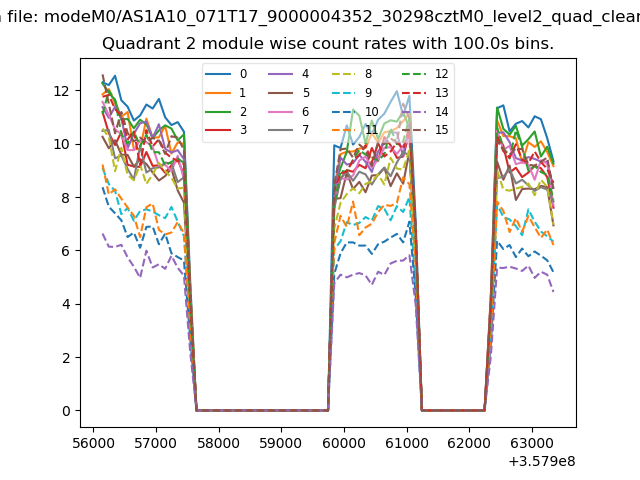
| Module-wise count rates for Quadrant B Data is divided into 100 sec bins |
 |
 |
| Module-wise count rates for Quadrant C Data is divided into 100 sec bins |
 |
 |
| Module-wise count rates for Quadrant D Data is divided into 100 sec bins |
 |
 |
| Parameter | Plot |
|---|---|
| CZT HV Monitor | 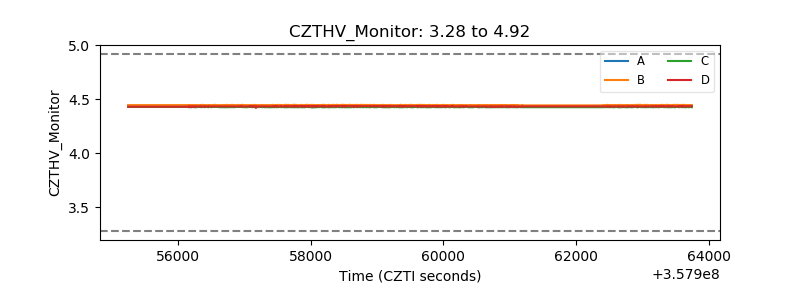 |
| D_VDD | 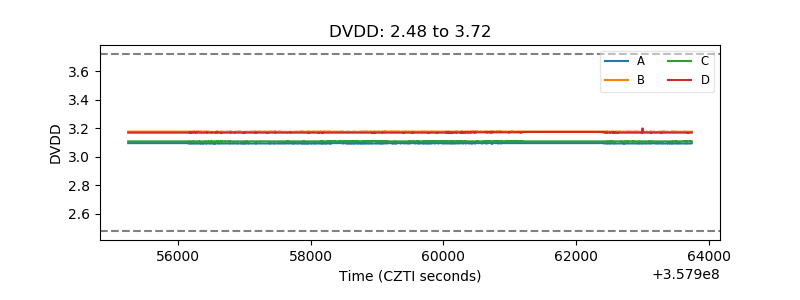 |
| Temperature 1 | 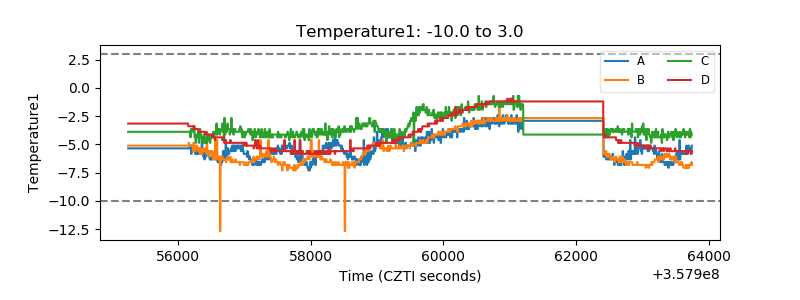 |
| Veto HV Monitor | 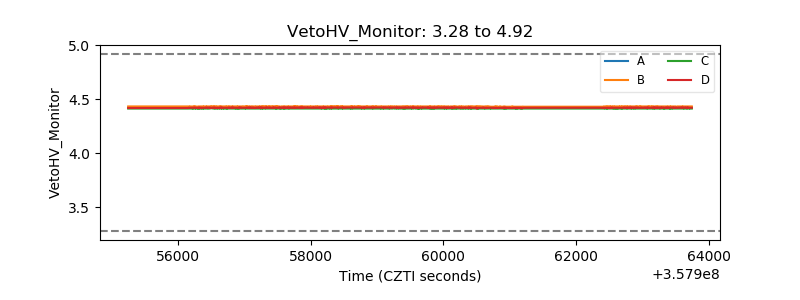 |
| Veto LLD | 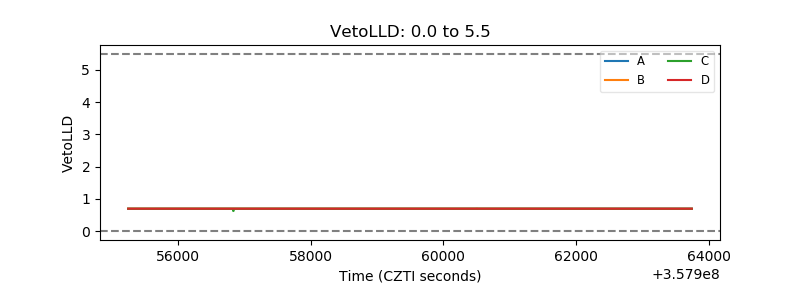 |
| Alpha Counter | 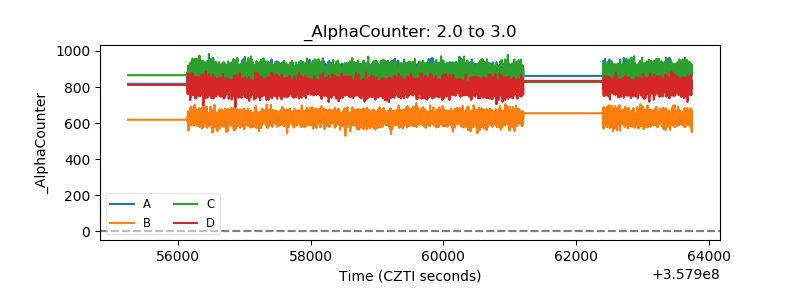 |
| _CPM_Rate | 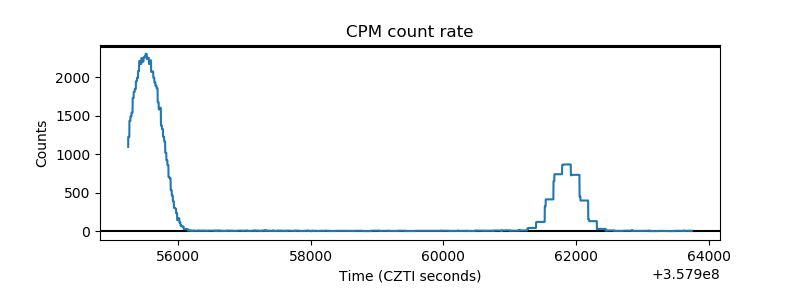 |
| CZT Counter | 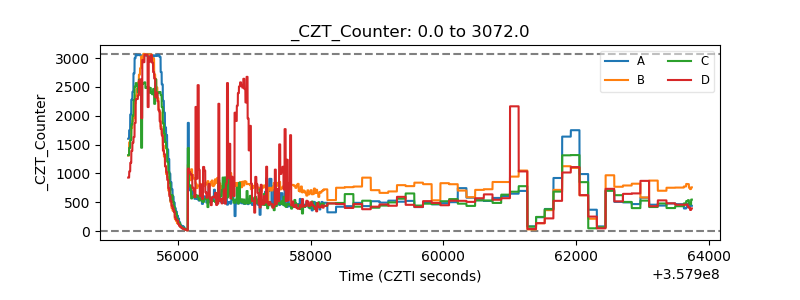 |
| +2.5 Volts monitor |  |
| +5 Volts monitor |  |
| _ROLL_ROT | 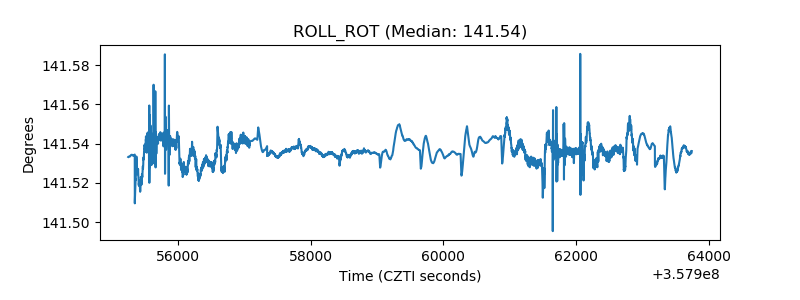 |
| _Roll_DEC | 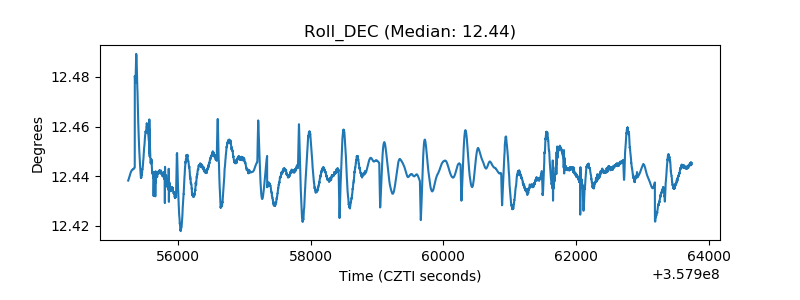 |
| _Roll_RA | 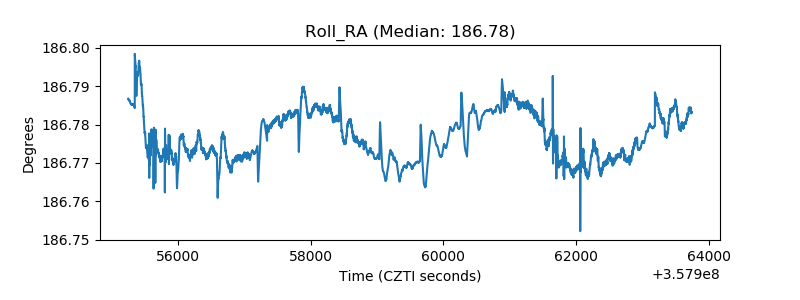 |
| Veto Counter | 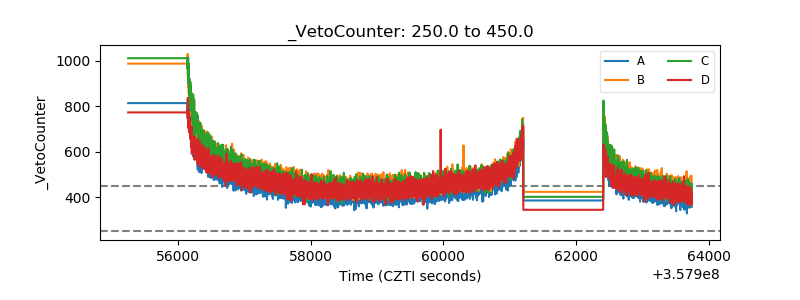 |