| Param | Original file | Final file |
|---|---|---|
| Filename | modeM0/AS1A10_071T17_9000004352_30299cztM0_level2.evt | modeM0/AS1A10_071T17_9000004352_30299cztM0_level2_quad_clean.evt |
| Size (bytes) | 541,944,000 | 83,773,440 |
| Size | 516.8 MB | 79.9 MB |
| Events in quadrant A | 3,286,189 | 527,715 |
| Events in quadrant B | 5,158,000 | 532,580 |
| Events in quadrant C | 3,371,869 | 511,961 |
| Events in quadrant D | 4,137,444 | 492,060 |
| Mode M9 | |||
|---|---|---|---|
| Quadrant | BADHDUFLAG | Total packets | Discarded packets |
| A | 0 | 15 | 0 |
| B | 0 | 16 | 0 |
| C | 0 | 16 | 0 |
| D | 0 | 16 | 0 |
| Mode M0 | |||
|---|---|---|---|
| Quadrant | BADHDUFLAG | Total packets | Discarded packets |
| A | 0 | 13950 | 2 |
| B | 0 | 20471 | 2 |
| C | 0 | 14079 | 2 |
| D | 0 | 16935 | 2 |
| Mode SS | |||
|---|---|---|---|
| Quadrant | BADHDUFLAG | Total packets | Discarded packets |
| A | 0 | 138 | 0 |
| B | 0 | 138 | 0 |
| C | 0 | 138 | 0 |
| D | 0 | 138 | 0 |
| Quadrant | Total seconds | Saturated seconds | Saturation percentage |
|---|---|---|---|
| A | 6776 | 37 | 0.546045% |
| B | 6776 | 83 | 1.224911% |
| C | 6776 | 109 | 1.608619% |
| D | 6776 | 246 | 3.630460% |
Noise dominated data is calculated using 1-second bins in cleaned event files. If a bin has >2000 counts, and if more than 50% of those come from <1% of pixels, then it is considered to be noise-dominated and hence unusable.
| Quadrant | # 1 sec bins | Bins with >0 counts | Bins with >2000 counts | High rate bins dominated by noise | Noise dominated (total time) | Noise dominated (detector-on time) | Marked lightcurve |
|---|---|---|---|---|---|---|---|
| A | 7616 | 6777 | 2 | 2 | 0.03% | 0.03% | 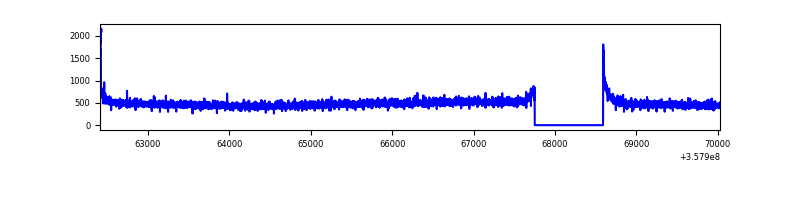 |
| B | 7616 | 6777 | 0 | 0 | 0.00% | 0.00% | 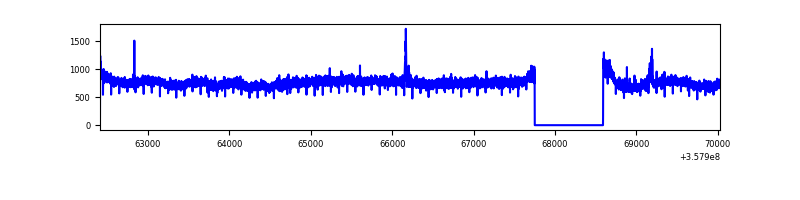 |
| C | 7616 | 6777 | 0 | 0 | 0.00% | 0.00% | 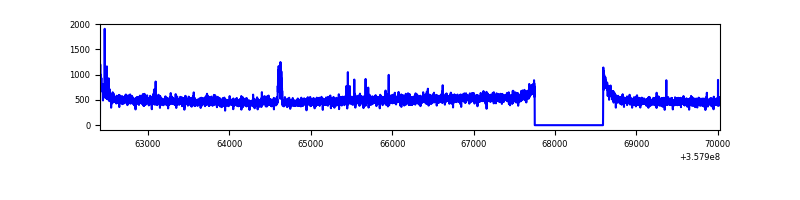 |
| D | 7616 | 6777 | 173 | 173 | 2.27% | 2.55% | 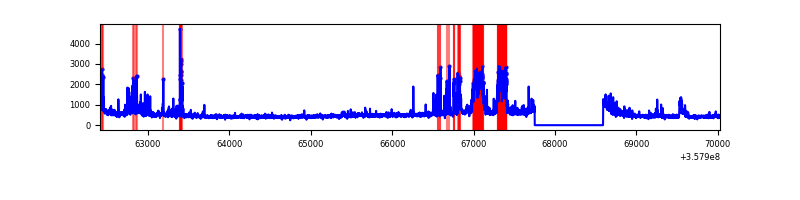 |
Top three noisy pixels from each quadrant. If the there are fewer than three noisy pixels in the level2.evt file, extra rows are filled as -1
| Pixel properties | Quadrant properties | ||||||
|---|---|---|---|---|---|---|---|
| Quadrant | DetID | PixID | Counts | Sigma | Mean | Median | Sigma |
| A | 8 | 192 | 22975 | 130.71 | 844 | 828 | 169.4 |
| A | 13 | 254 | 11770 | 64.58 | 844 | 828 | 169.4 |
| A | 14 | 239 | 9266 | 49.8 | 844 | 828 | 169.4 |
| B | 6 | 159 | 1837026 | 11267.12 | 838 | 818 | 163.0 |
| B | 12 | 111 | 20538 | 121.0 | 838 | 818 | 163.0 |
| B | 6 | 36 | 18650 | 109.42 | 838 | 818 | 163.0 |
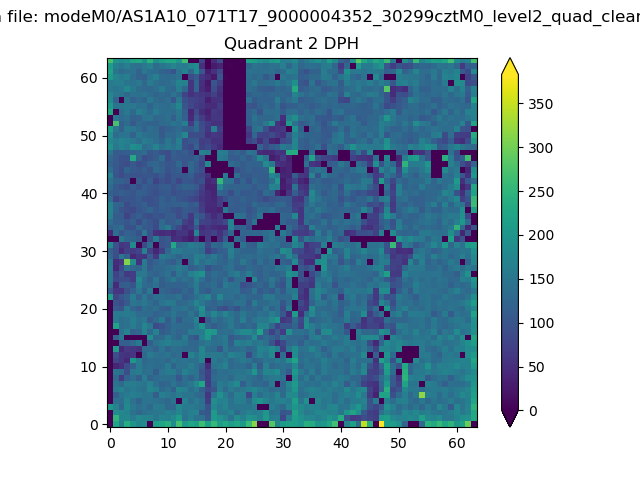
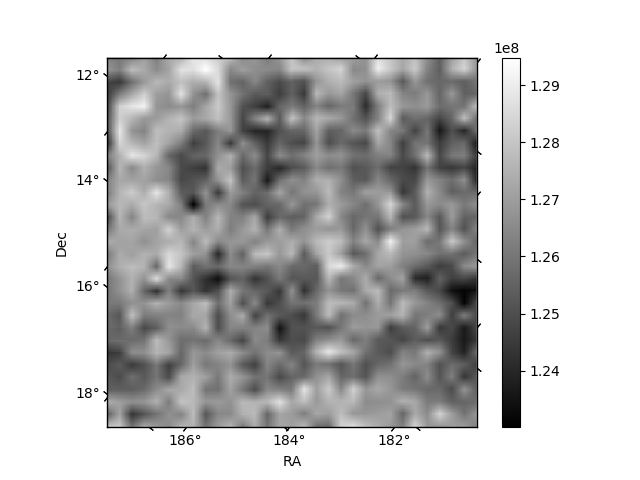
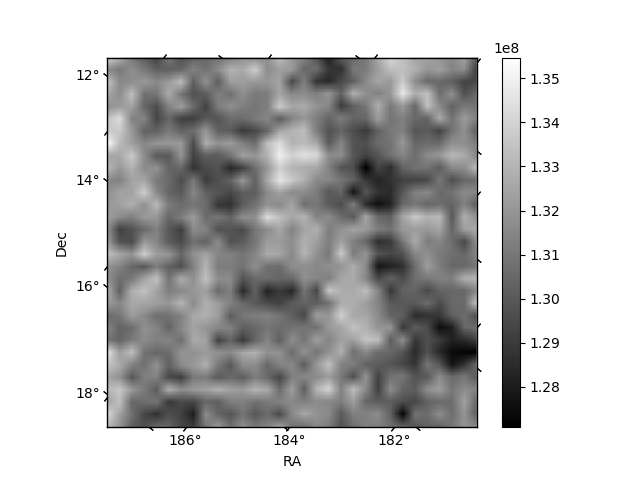
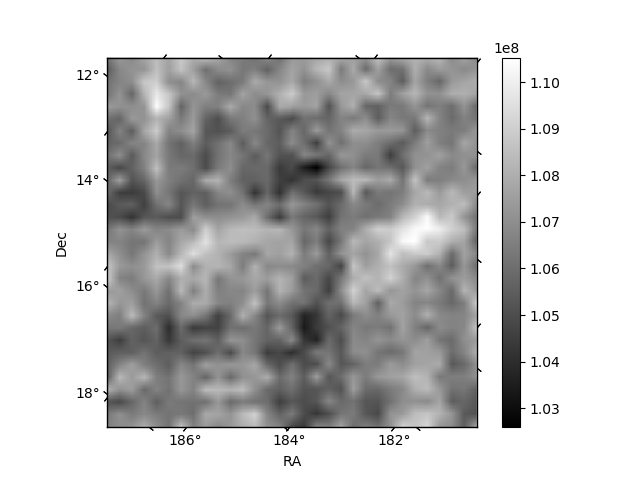
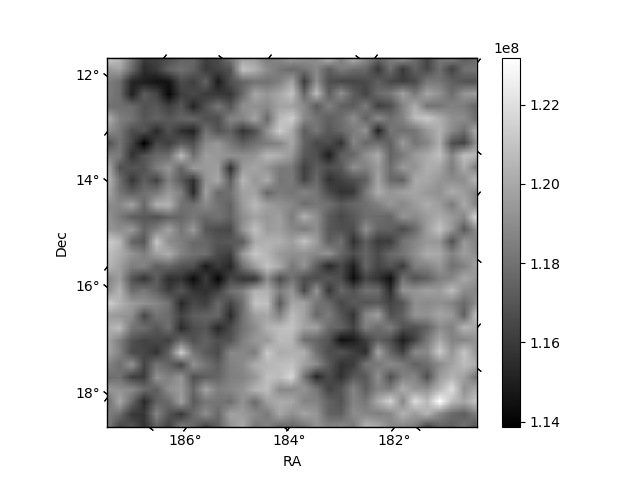
Histogram calculated using DETX and DETY for each event in the final _common_clean file
| Quadrant A | 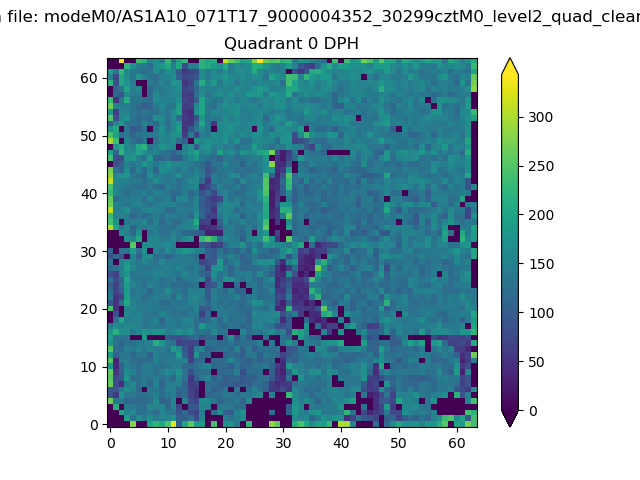 |
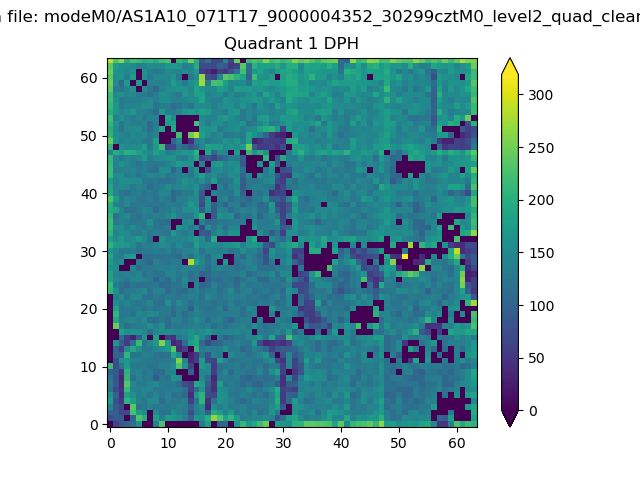 |
Quadrant B |
|---|---|---|---|
| Quadrant D | 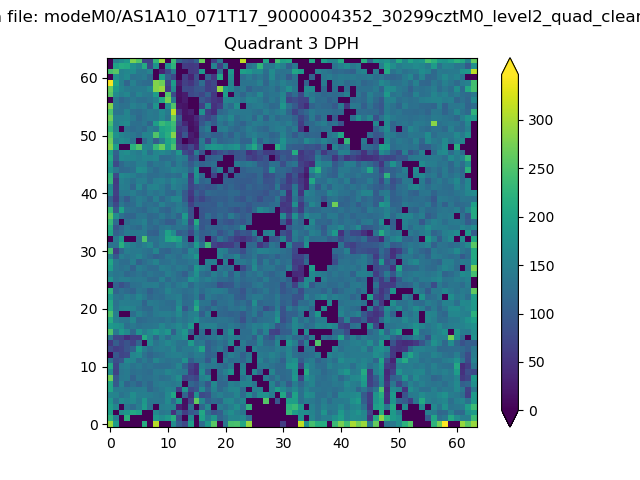 |
 |
Quadrant C |
| Plot type | Count rate plots | Images |
|---|---|---|
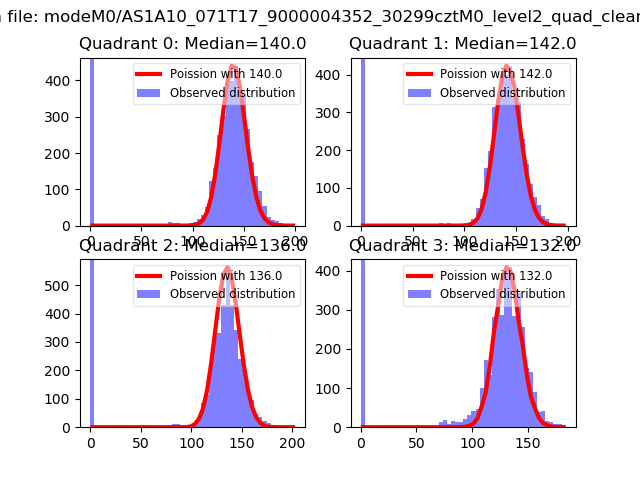
| Comparison with Poisson distribution Blue bars denote a histogram of data divided into 1 sec bins. Red curve is a Poisson curve with rate = median count rate of data. |
 |
 |
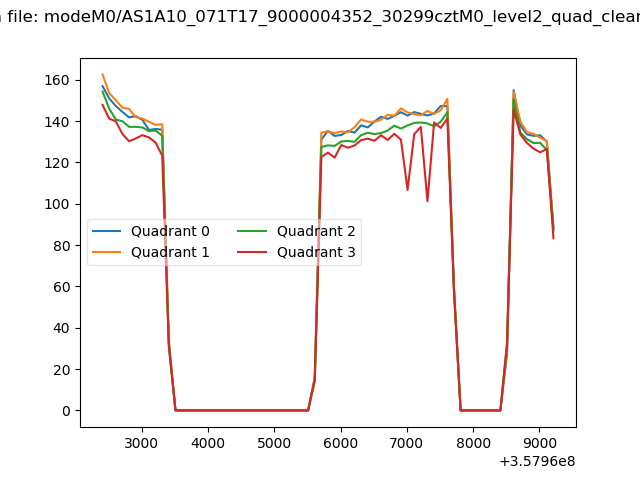
| Quadrant-wise count rates Data is divided into 100 sec bins |
 |
|
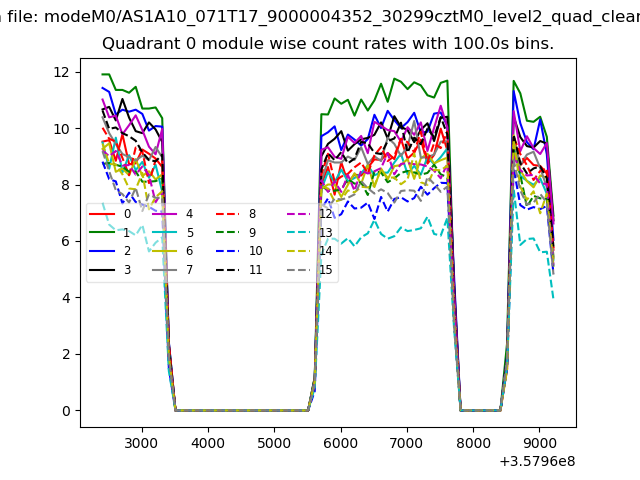
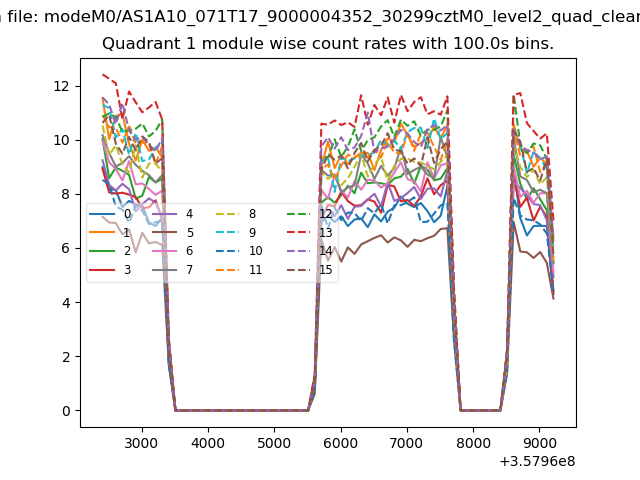
| Module-wise count rates for Quadrant A Data is divided into 100 sec bins |
 |
 |
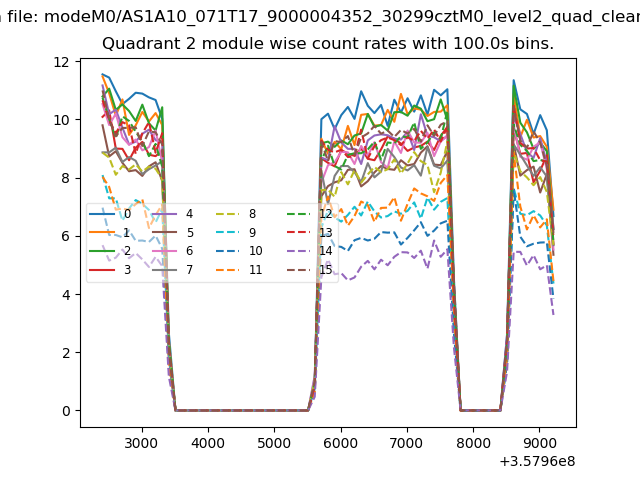
| Module-wise count rates for Quadrant B Data is divided into 100 sec bins |
 |
 |
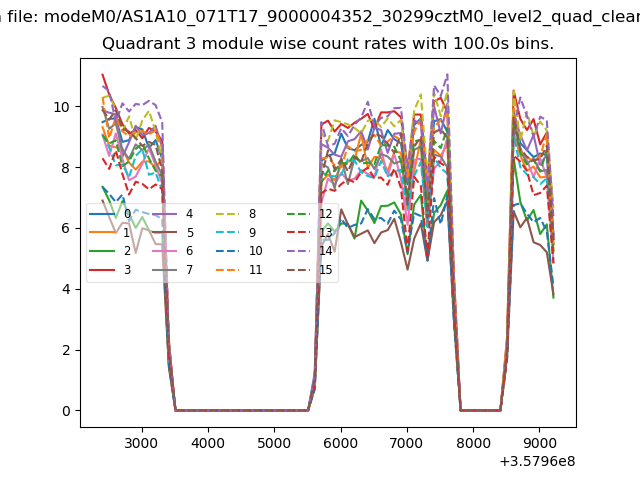
| Module-wise count rates for Quadrant C Data is divided into 100 sec bins |
 |
 |
| Module-wise count rates for Quadrant D Data is divided into 100 sec bins |
 |
 |
| Parameter | Plot |
|---|---|
| CZT HV Monitor | 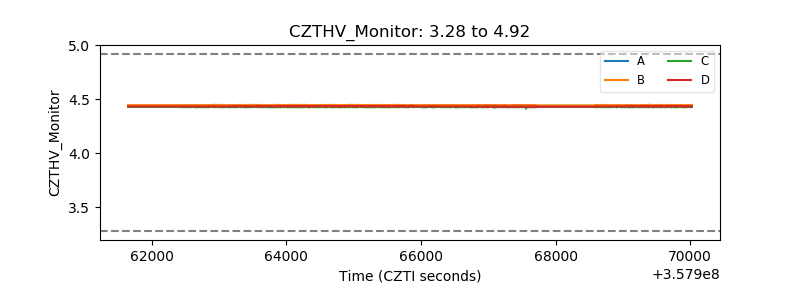 |
| D_VDD | 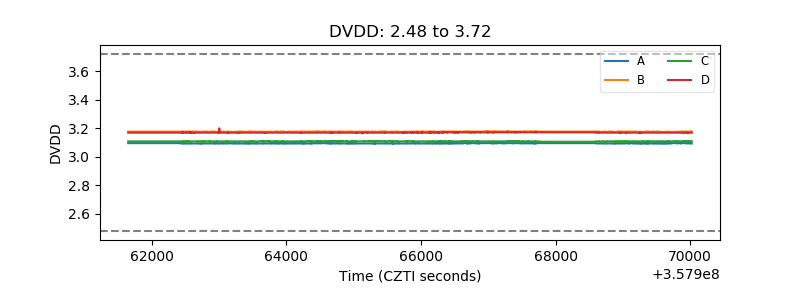 |
| Temperature 1 | 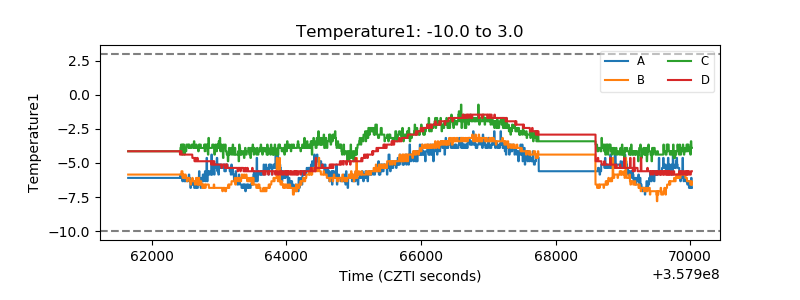 |
| Veto HV Monitor | 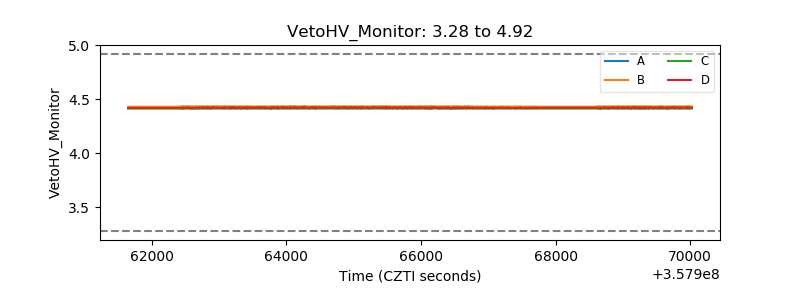 |
| Veto LLD | 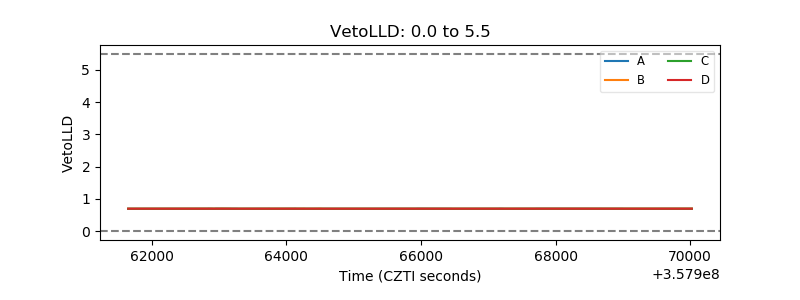 |
| Alpha Counter | 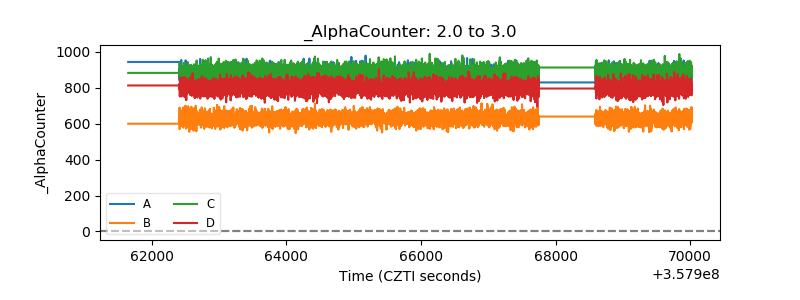 |
| _CPM_Rate | 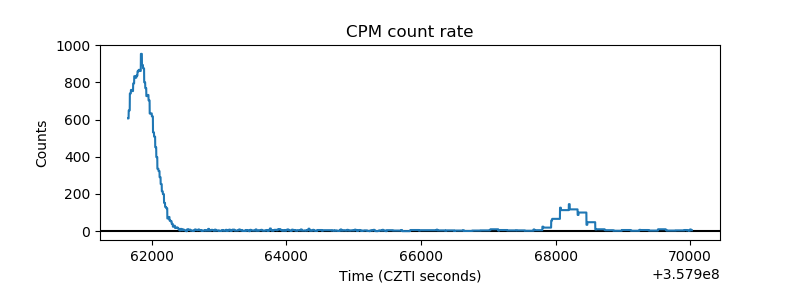 |
| CZT Counter | 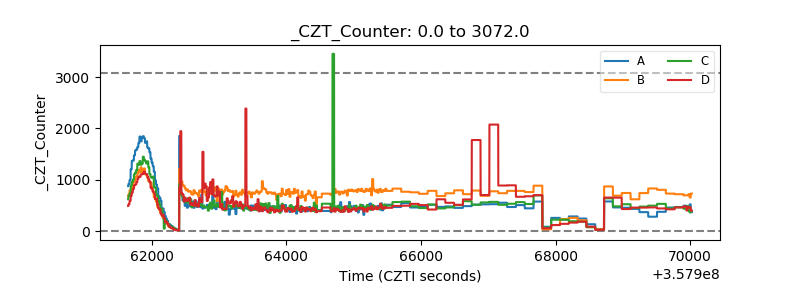 |
| +2.5 Volts monitor |  |
| +5 Volts monitor |  |
| _ROLL_ROT | 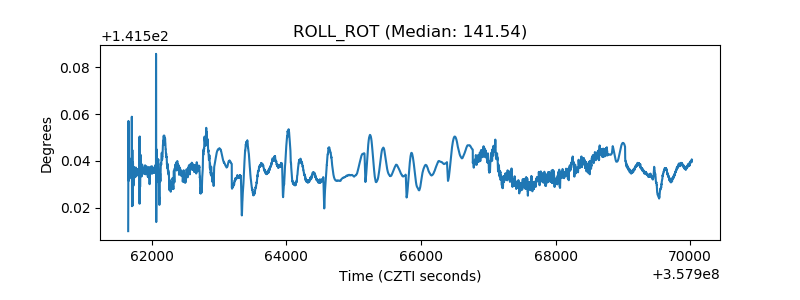 |
| _Roll_DEC | 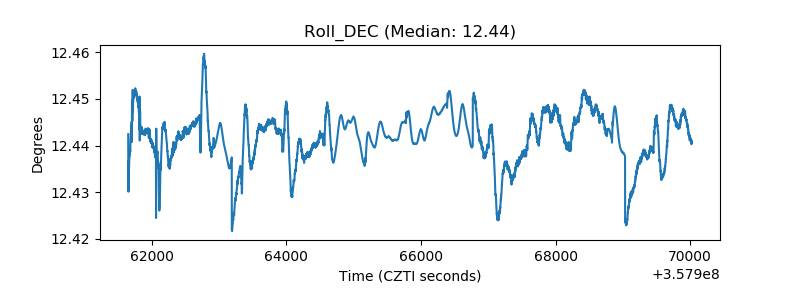 |
| _Roll_RA | 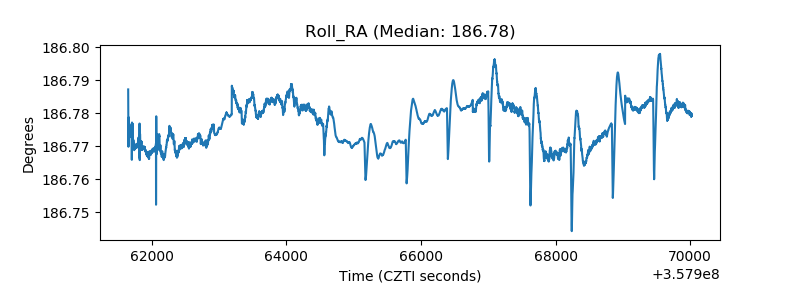 |
| Veto Counter | 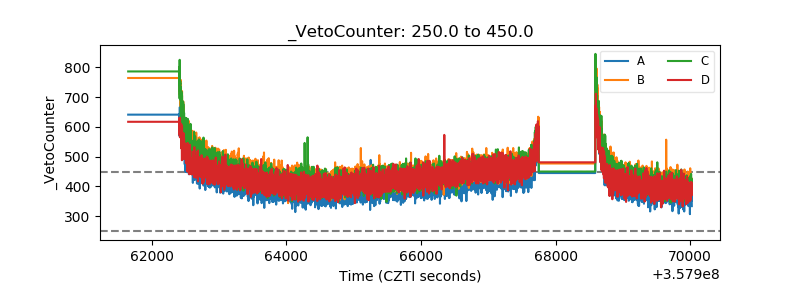 |