| Param | Original file | Final file |
|---|---|---|
| Filename | modeM0/AS1A10_071T17_9000004352_30300cztM0_level2.evt | modeM0/AS1A10_071T17_9000004352_30300cztM0_level2_quad_clean.evt |
| Size (bytes) | 561,487,680 | 84,113,280 |
| Size | 535.5 MB | 80.2 MB |
| Events in quadrant A | 3,517,060 | 519,510 |
| Events in quadrant B | 5,606,398 | 517,873 |
| Events in quadrant C | 3,717,613 | 501,573 |
| Events in quadrant D | 3,667,236 | 498,167 |
| Mode M9 | |||
|---|---|---|---|
| Quadrant | BADHDUFLAG | Total packets | Discarded packets |
| A | 0 | 4 | 0 |
| B | 0 | 5 | 0 |
| C | 0 | 5 | 0 |
| D | 0 | 5 | 0 |
| Mode M0 | |||
|---|---|---|---|
| Quadrant | BADHDUFLAG | Total packets | Discarded packets |
| A | 0 | 15136 | 2 |
| B | 0 | 22401 | 2 |
| C | 0 | 15540 | 2 |
| D | 0 | 15726 | 2 |
| Mode SS | |||
|---|---|---|---|
| Quadrant | BADHDUFLAG | Total packets | Discarded packets |
| A | 0 | 148 | 0 |
| B | 0 | 148 | 0 |
| C | 0 | 148 | 0 |
| D | 0 | 148 | 0 |
| Quadrant | Total seconds | Saturated seconds | Saturation percentage |
|---|---|---|---|
| A | 7325 | 64 | 0.873720% |
| B | 7325 | 166 | 2.266212% |
| C | 7325 | 196 | 2.675768% |
| D | 7325 | 37 | 0.505119% |
Noise dominated data is calculated using 1-second bins in cleaned event files. If a bin has >2000 counts, and if more than 50% of those come from <1% of pixels, then it is considered to be noise-dominated and hence unusable.
| Quadrant | # 1 sec bins | Bins with >0 counts | Bins with >2000 counts | High rate bins dominated by noise | Noise dominated (total time) | Noise dominated (detector-on time) | Marked lightcurve |
|---|---|---|---|---|---|---|---|
| A | 7735 | 7327 | 0 | 0 | 0.00% | 0.00% | 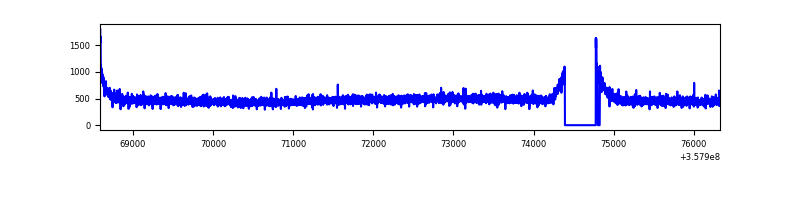 |
| B | 7735 | 7327 | 30 | 30 | 0.39% | 0.41% | 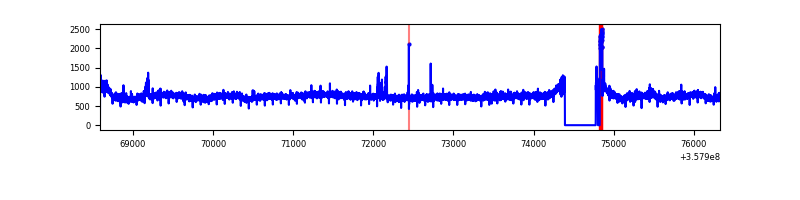 |
| C | 7735 | 7327 | 0 | 0 | 0.00% | 0.00% | 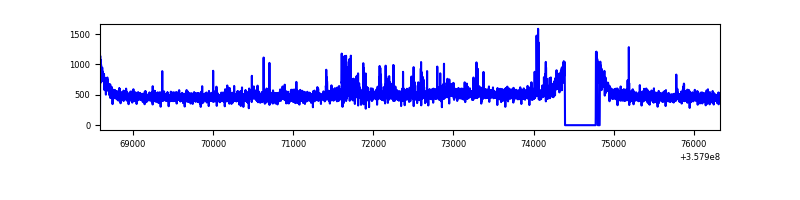 |
| D | 7735 | 7327 | 4 | 4 | 0.05% | 0.05% | 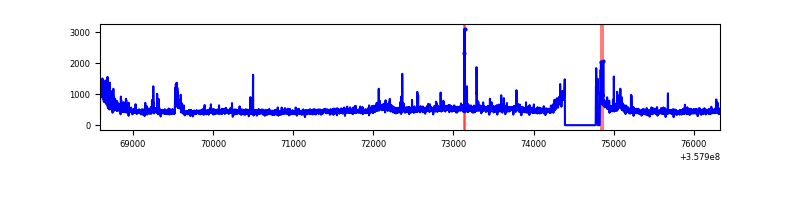 |
Top three noisy pixels from each quadrant. If the there are fewer than three noisy pixels in the level2.evt file, extra rows are filled as -1
| Pixel properties | Quadrant properties | ||||||
|---|---|---|---|---|---|---|---|
| Quadrant | DetID | PixID | Counts | Sigma | Mean | Median | Sigma |
| A | 8 | 192 | 19831 | 103.78 | 905 | 886 | 182.5 |
| A | 13 | 254 | 12740 | 64.94 | 905 | 886 | 182.5 |
| A | 3 | 137 | 9602 | 47.75 | 905 | 886 | 182.5 |
| B | 6 | 159 | 1962641 | 11221.21 | 892 | 868 | 174.8 |
| B | 6 | 36 | 110035 | 624.43 | 892 | 868 | 174.8 |
| B | 0 | 190 | 29147 | 161.75 | 892 | 868 | 174.8 |
| C | 14 | 238 | 187705 | 906.32 | 866 | 870 | 206.1 |
| C | 14 | 254 | 69075 | 330.85 | 866 | 870 | 206.1 |
| C | 3 | 233 | 57884 | 276.57 | 866 | 870 | 206.1 |
| D | 8 | 195 | 124149 | 571.12 | 870 | 854 | 215.9 |
| D | 13 | 104 | 79871 | 366.02 | 870 | 854 | 215.9 |
| D | 1 | 52 | 64488 | 294.76 | 870 | 854 | 215.9 |
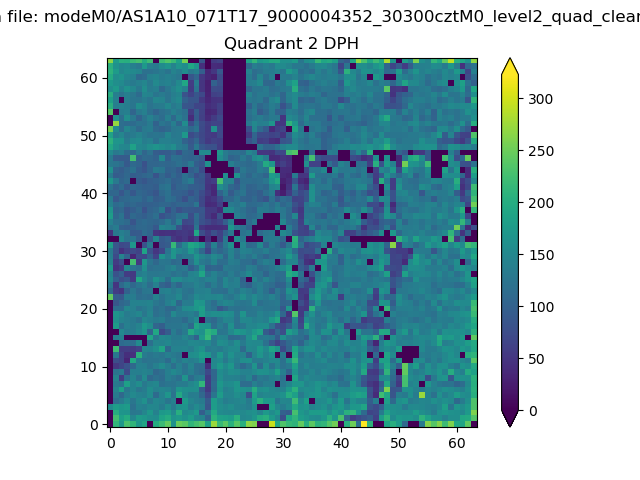
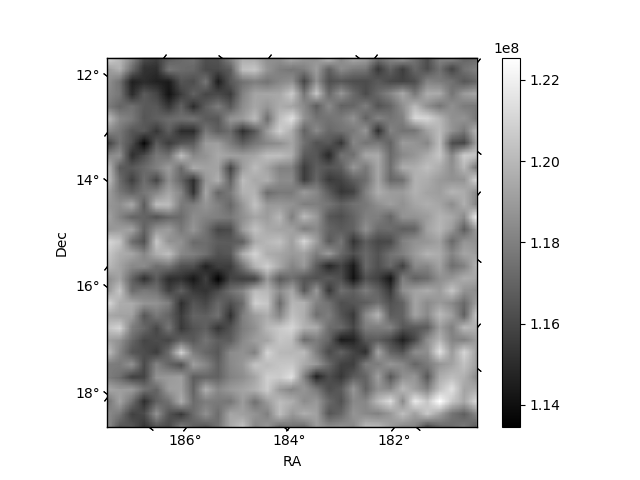
Histogram calculated using DETX and DETY for each event in the final _common_clean file
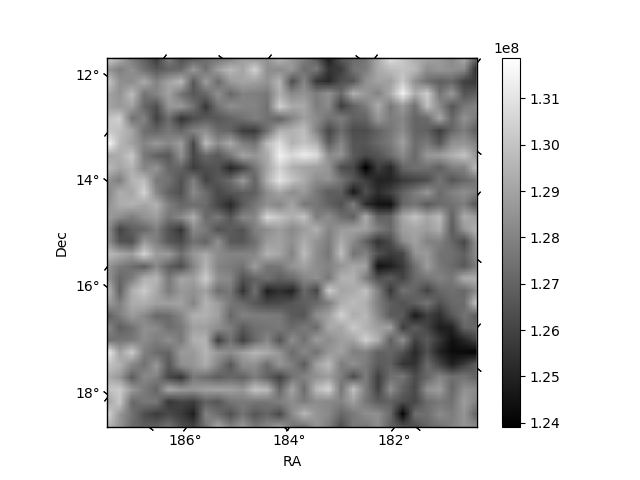
| Quadrant A | 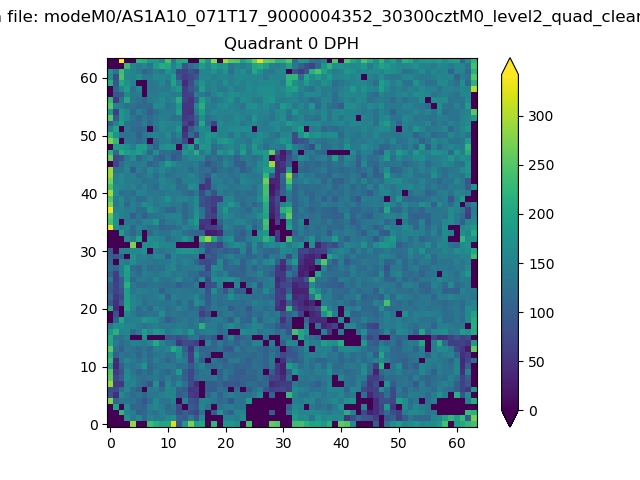 |
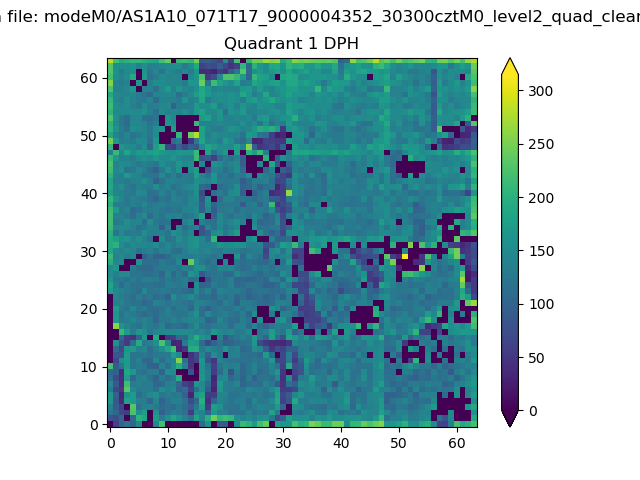 |
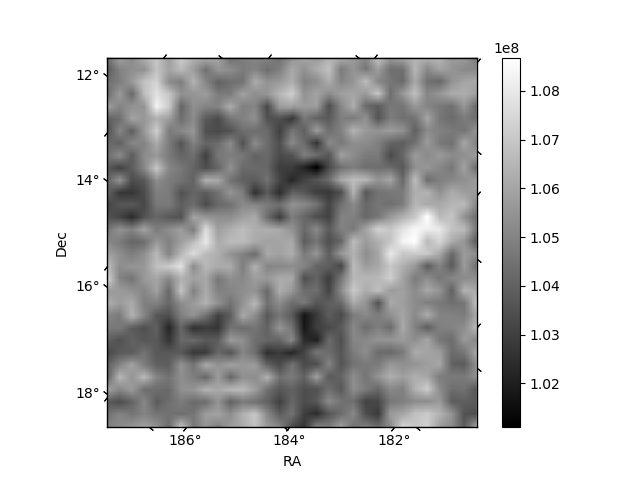
Quadrant B |
|---|---|---|---|
| Quadrant D | 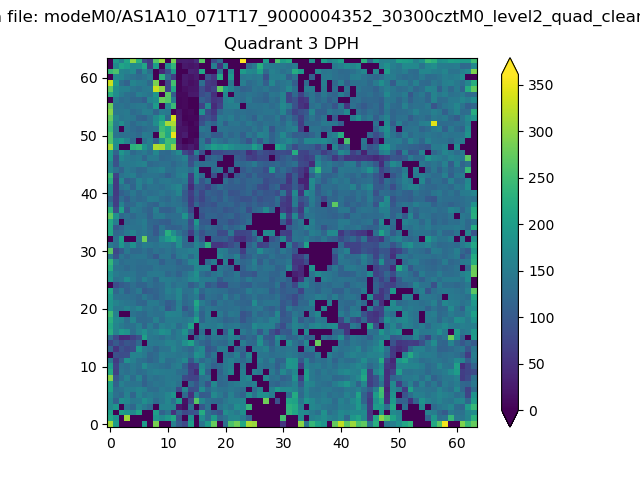 |
 |
Quadrant C |
| Plot type | Count rate plots | Images |
|---|---|---|
| Comparison with Poisson distribution Blue bars denote a histogram of data divided into 1 sec bins. Red curve is a Poisson curve with rate = median count rate of data. |
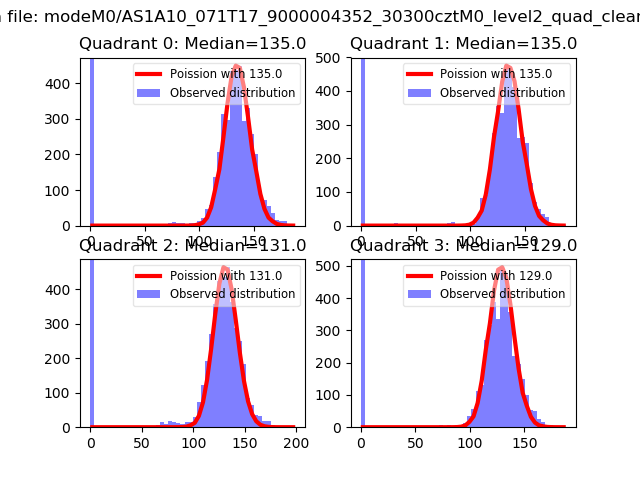 |
 |
| Quadrant-wise count rates Data is divided into 100 sec bins |
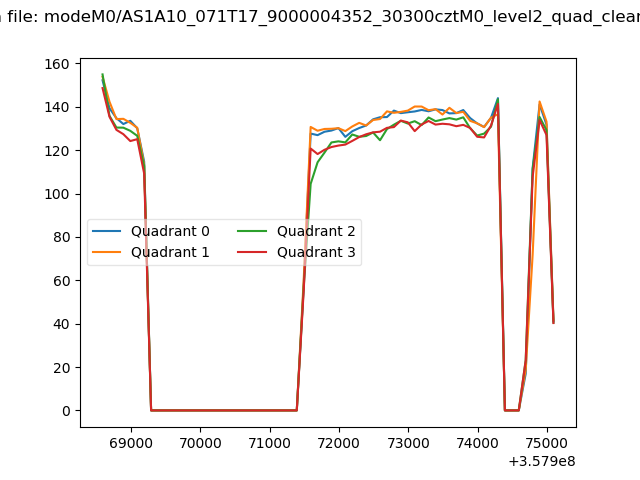 |
|
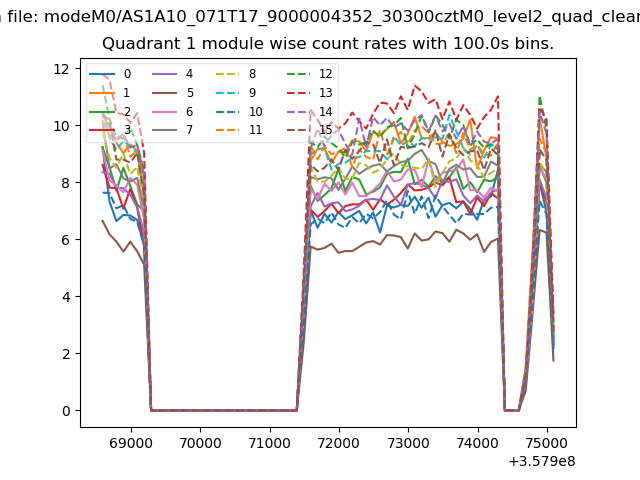
| Module-wise count rates for Quadrant A Data is divided into 100 sec bins |
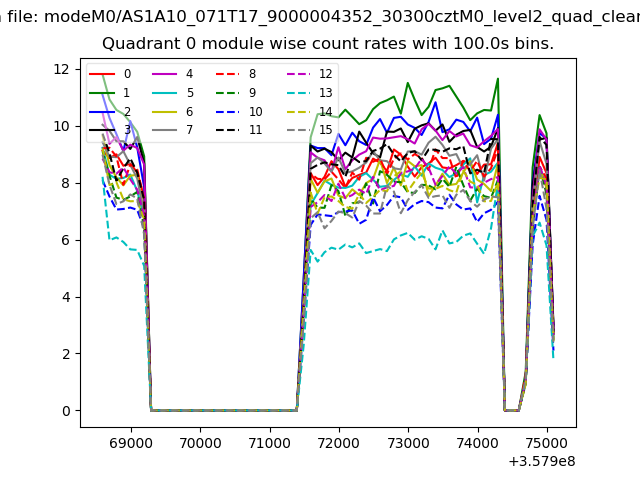 |
 |
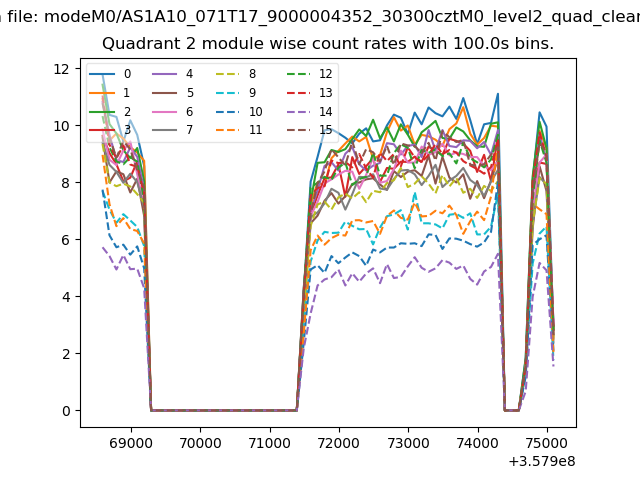
| Module-wise count rates for Quadrant B Data is divided into 100 sec bins |
 |
 |
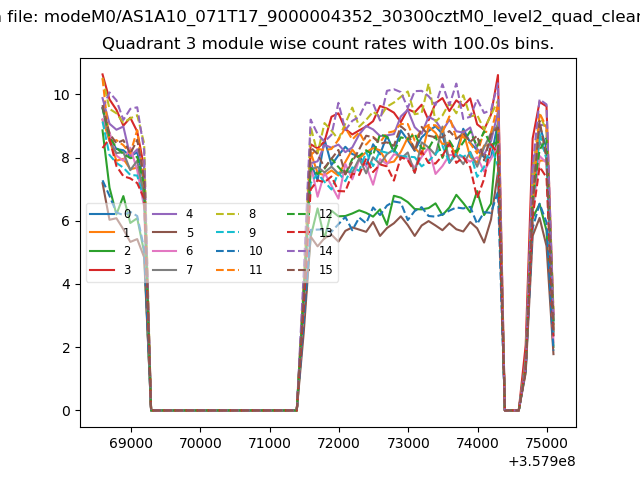
| Module-wise count rates for Quadrant C Data is divided into 100 sec bins |
 |
 |
| Module-wise count rates for Quadrant D Data is divided into 100 sec bins |
 |
 |
| Parameter | Plot |
|---|---|
| CZT HV Monitor | 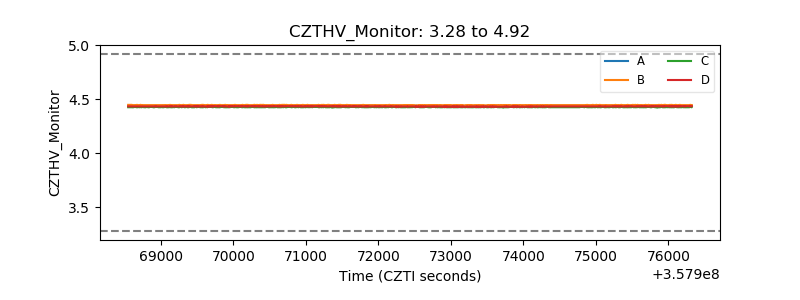 |
| D_VDD | 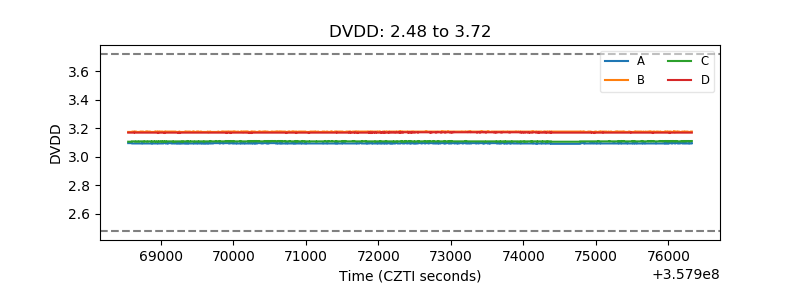 |
| Temperature 1 | 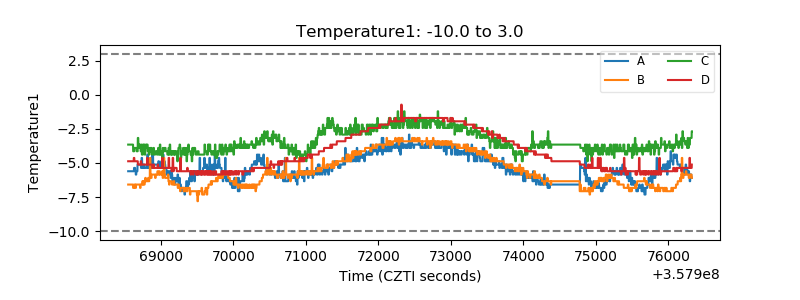 |
| Veto HV Monitor | 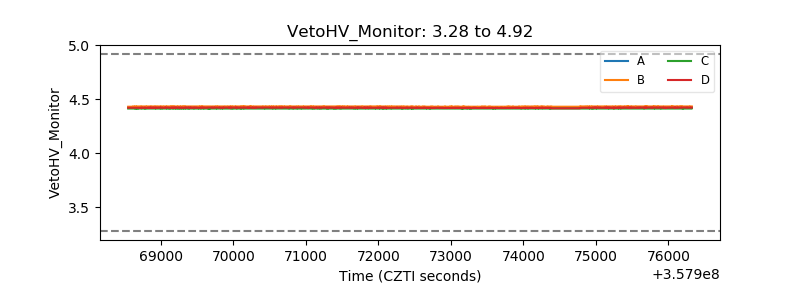 |
| Veto LLD | 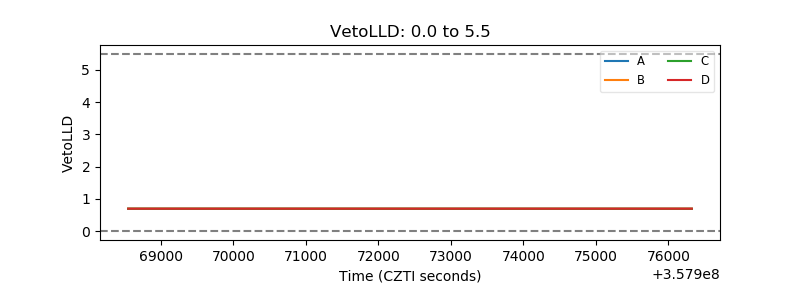 |
| Alpha Counter | 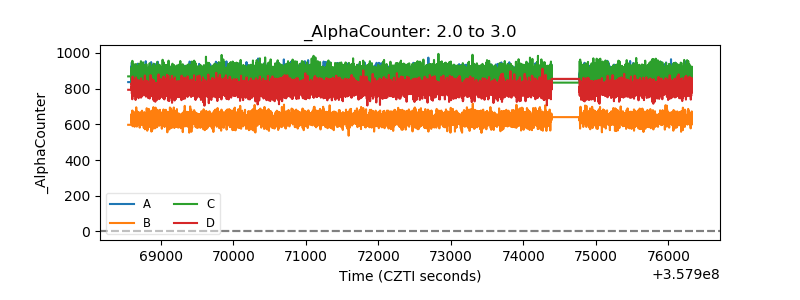 |
| _CPM_Rate | 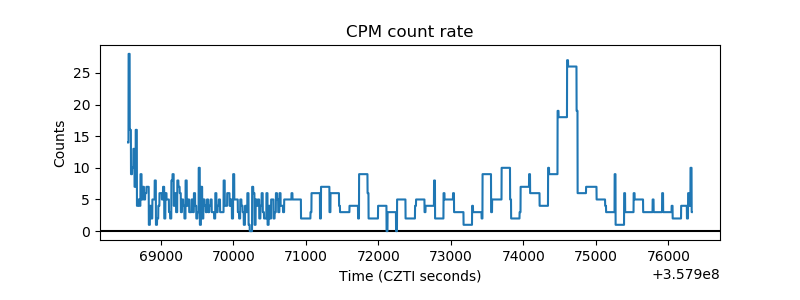 |
| CZT Counter | 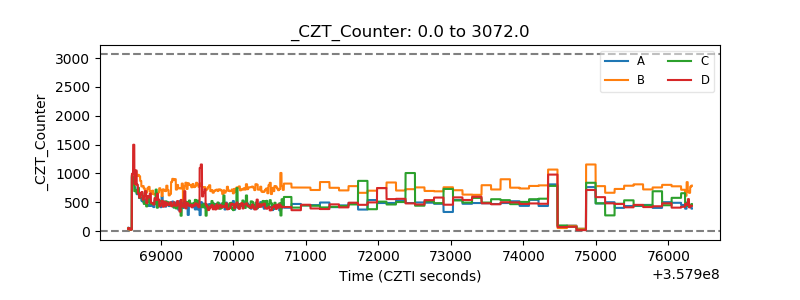 |
| +2.5 Volts monitor |  |
| +5 Volts monitor |  |
| _ROLL_ROT | 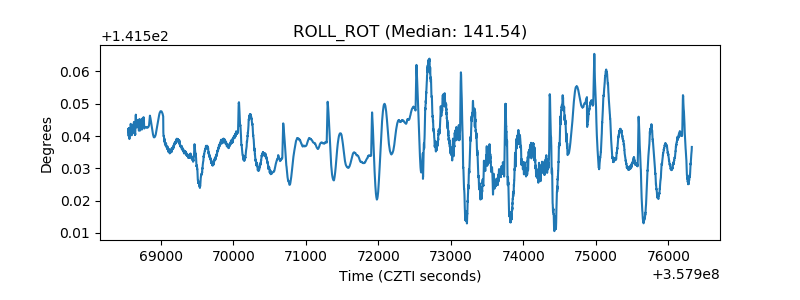 |
| _Roll_DEC | 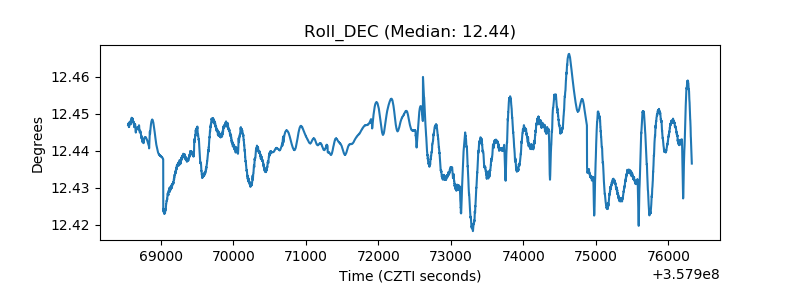 |
| _Roll_RA |  |
| Veto Counter | 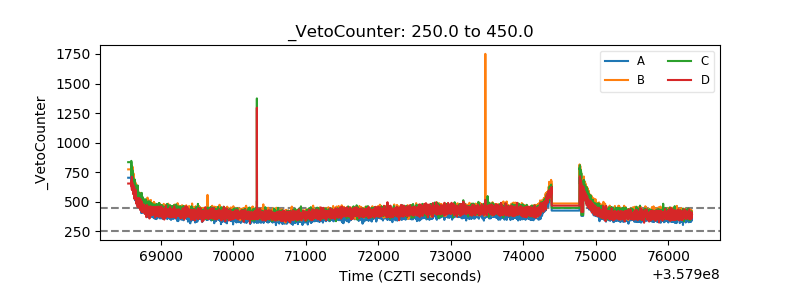 |