| Param | Original file | Final file |
|---|---|---|
| Filename | modeM0/AS1A10_071T17_9000004352_30304cztM0_level2.evt | modeM0/AS1A10_071T17_9000004352_30304cztM0_level2_quad_clean.evt |
| Size (bytes) | 1,037,934,720 | 160,505,280 |
| Size | 989.9 MB | 153.1 MB |
| Events in quadrant A | 6,372,728 | 1,017,005 |
| Events in quadrant B | 10,122,075 | 1,014,596 |
| Events in quadrant C | 6,748,812 | 947,303 |
| Events in quadrant D | 7,290,213 | 962,017 |
| Mode M9 | |||
|---|---|---|---|
| Quadrant | BADHDUFLAG | Total packets | Discarded packets |
| A | 0 | 13 | 0 |
| B | 0 | 13 | 0 |
| C | 0 | 13 | 0 |
| D | 0 | 13 | 0 |
| Mode M0 | |||
|---|---|---|---|
| Quadrant | BADHDUFLAG | Total packets | Discarded packets |
| A | 0 | 27345 | 4 |
| B | 0 | 40273 | 3 |
| C | 0 | 28232 | 3 |
| D | 0 | 29726 | 3 |
| Mode SS | |||
|---|---|---|---|
| Quadrant | BADHDUFLAG | Total packets | Discarded packets |
| A | 0 | 274 | 0 |
| B | 0 | 274 | 0 |
| C | 0 | 274 | 0 |
| D | 0 | 274 | 0 |
| Quadrant | Total seconds | Saturated seconds | Saturation percentage |
|---|---|---|---|
| A | 13307 | 289 | 2.171789% |
| B | 13308 | 414 | 3.110911% |
| C | 13308 | 849 | 6.379621% |
| D | 13308 | 307 | 2.306883% |
Noise dominated data is calculated using 1-second bins in cleaned event files. If a bin has >2000 counts, and if more than 50% of those come from <1% of pixels, then it is considered to be noise-dominated and hence unusable.
| Quadrant | # 1 sec bins | Bins with >0 counts | Bins with >2000 counts | High rate bins dominated by noise | Noise dominated (total time) | Noise dominated (detector-on time) | Marked lightcurve |
|---|---|---|---|---|---|---|---|
| A | 14732 | 13308 | 0 | 0 | 0.00% | 0.00% | 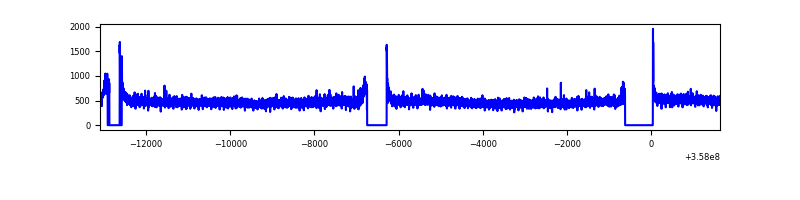 |
| B | 14733 | 13309 | 3 | 3 | 0.02% | 0.02% | 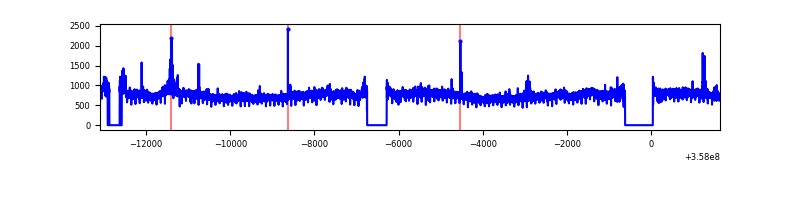 |
| C | 14733 | 13309 | 2 | 2 | 0.01% | 0.02% | 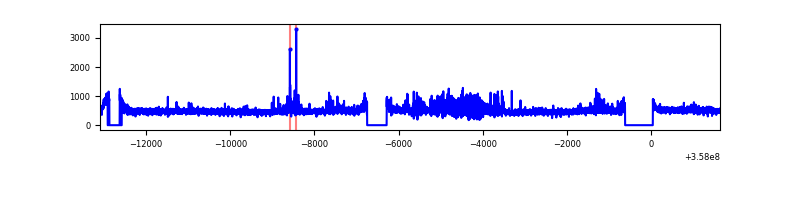 |
| D | 14733 | 13309 | 101 | 101 | 0.69% | 0.76% | 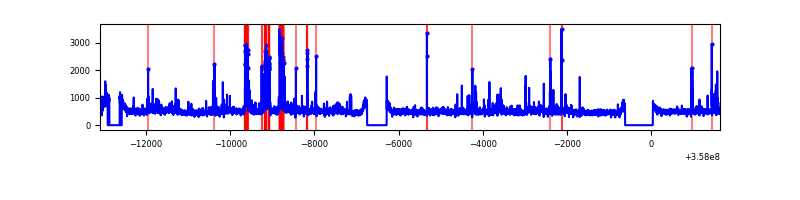 |
Top three noisy pixels from each quadrant. If the there are fewer than three noisy pixels in the level2.evt file, extra rows are filled as -1
| Pixel properties | Quadrant properties | ||||||
|---|---|---|---|---|---|---|---|
| Quadrant | DetID | PixID | Counts | Sigma | Mean | Median | Sigma |
| A | 8 | 192 | 33797 | 97.03 | 1642 | 1605 | 331.8 |
| A | 13 | 254 | 23304 | 65.4 | 1642 | 1605 | 331.8 |
| A | 3 | 137 | 17798 | 48.81 | 1642 | 1605 | 331.8 |
| B | 6 | 159 | 3640738 | 11562.67 | 1612 | 1567 | 314.7 |
| B | 6 | 36 | 113351 | 355.17 | 1612 | 1567 | 314.7 |
| B | 12 | 111 | 40540 | 123.83 | 1612 | 1567 | 314.7 |
| C | 14 | 238 | 369416 | 1013.73 | 1541 | 1551 | 362.9 |
| C | 14 | 254 | 185074 | 505.74 | 1541 | 1551 | 362.9 |
| C | 3 | 233 | 93222 | 252.62 | 1541 | 1551 | 362.9 |
| D | 8 | 195 | 442915 | 1101.31 | 1579 | 1543 | 400.8 |
| D | 13 | 104 | 389708 | 968.55 | 1579 | 1543 | 400.8 |
| D | 1 | 52 | 150487 | 371.64 | 1579 | 1543 | 400.8 |
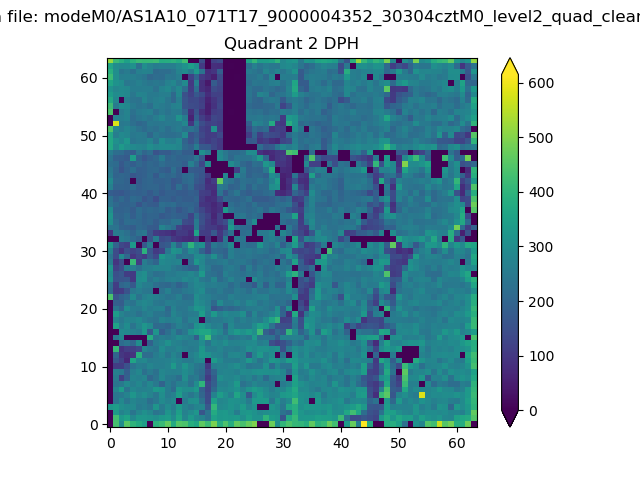
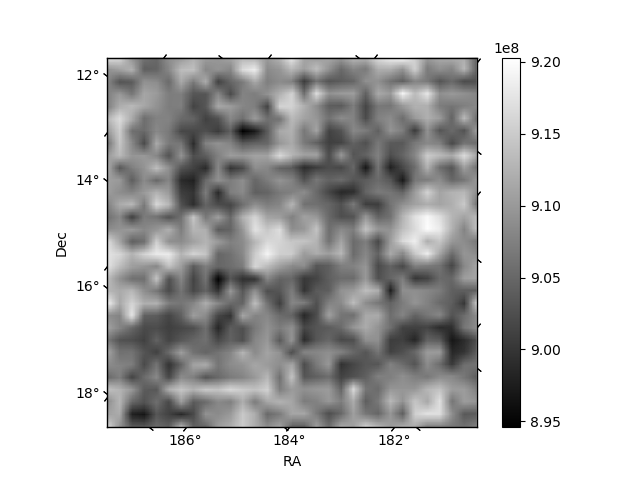
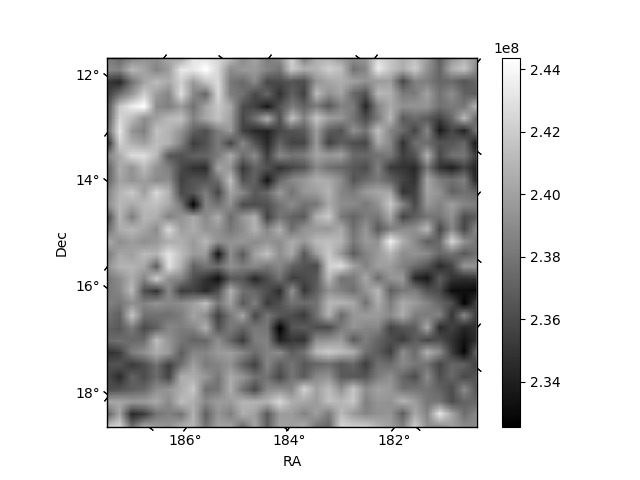
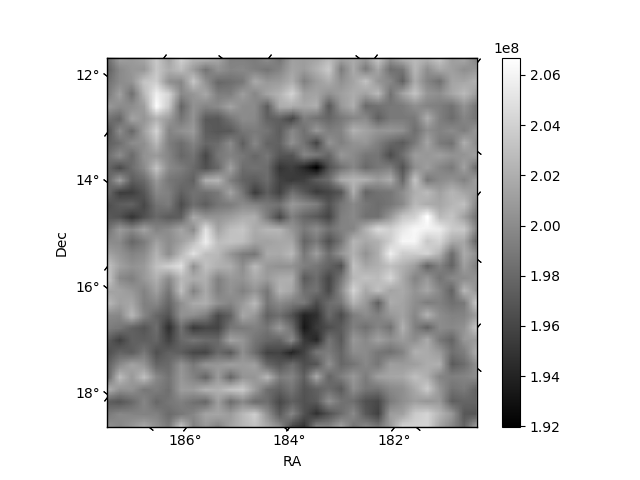
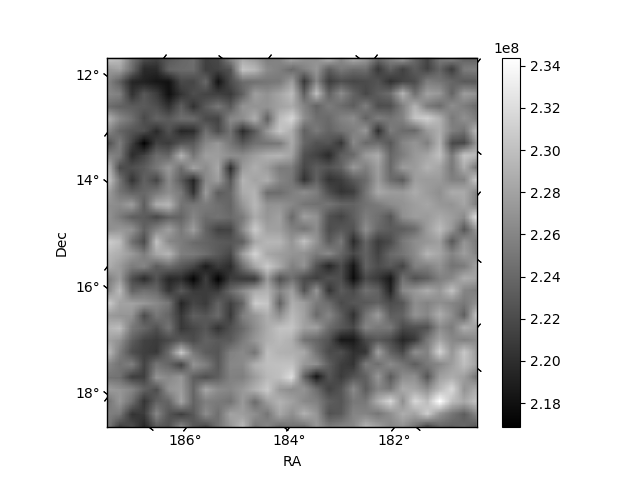
Histogram calculated using DETX and DETY for each event in the final _common_clean file
| Quadrant A | 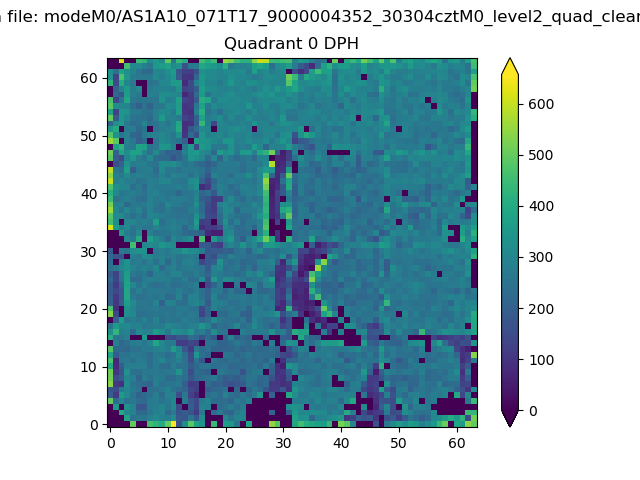 |
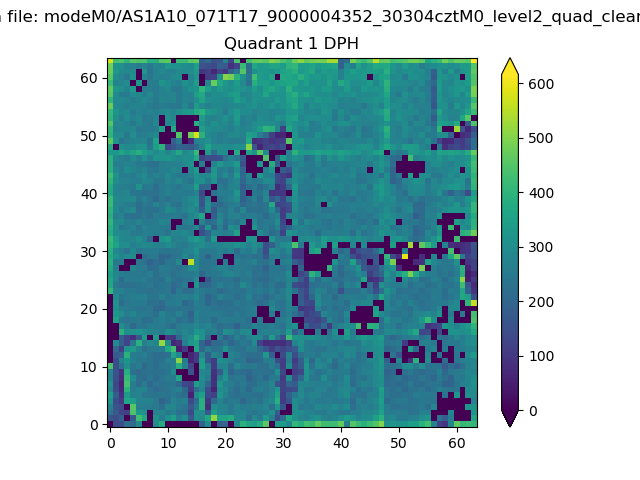 |
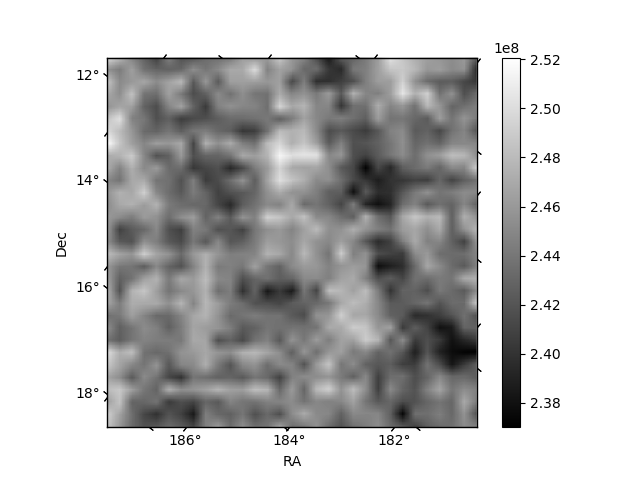
Quadrant B |
|---|---|---|---|
| Quadrant D | 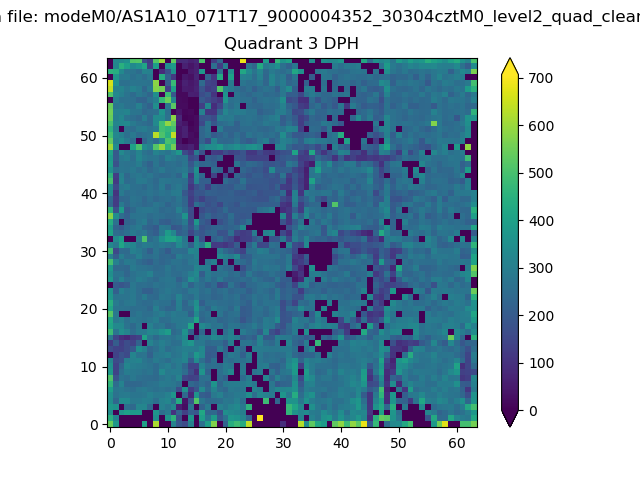 |
 |
Quadrant C |
| Plot type | Count rate plots | Images |
|---|---|---|
| Comparison with Poisson distribution Blue bars denote a histogram of data divided into 1 sec bins. Red curve is a Poisson curve with rate = median count rate of data. |
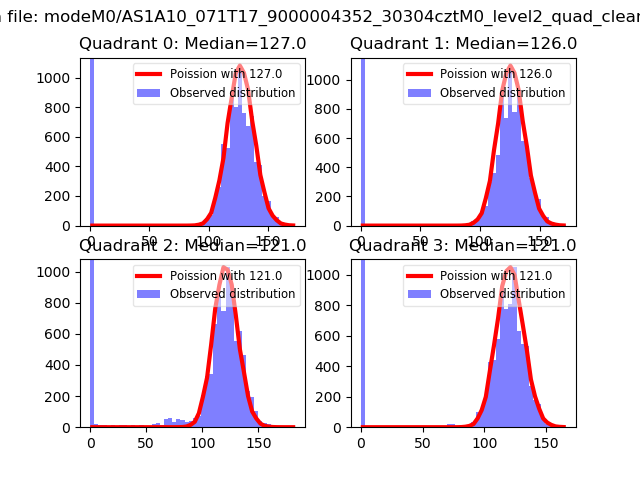 |
 |
| Quadrant-wise count rates Data is divided into 100 sec bins |
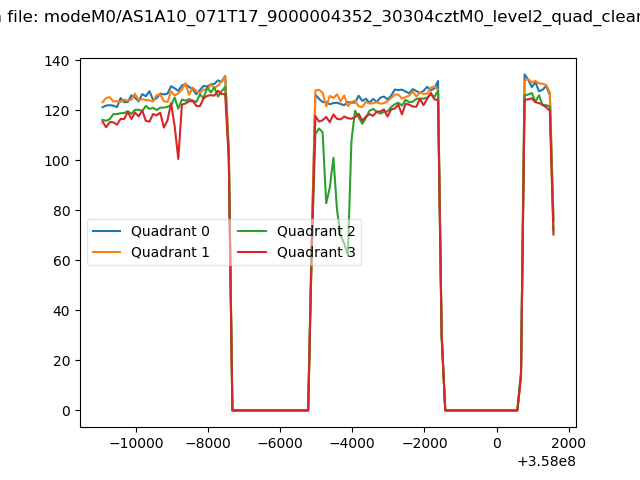 |
|
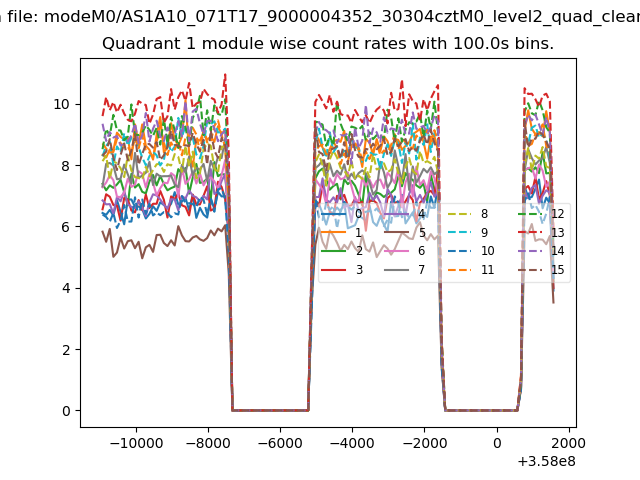
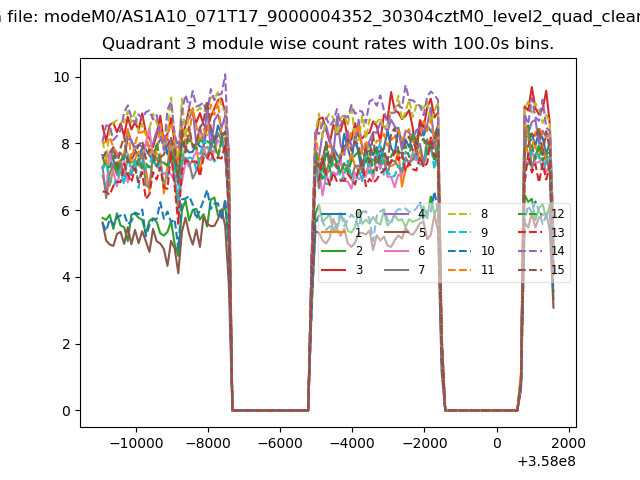
| Module-wise count rates for Quadrant A Data is divided into 100 sec bins |
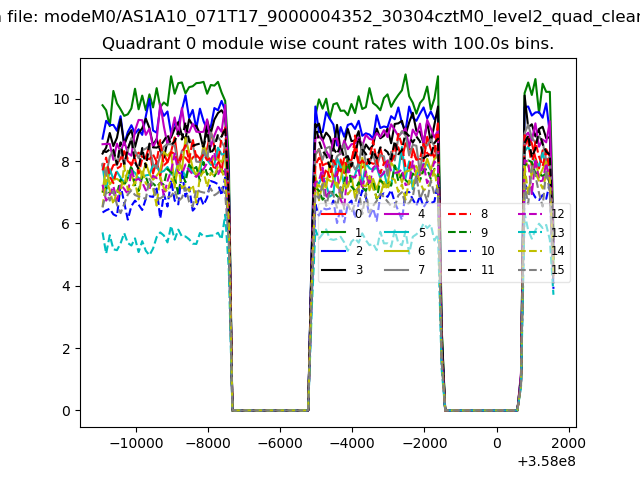 |
 |
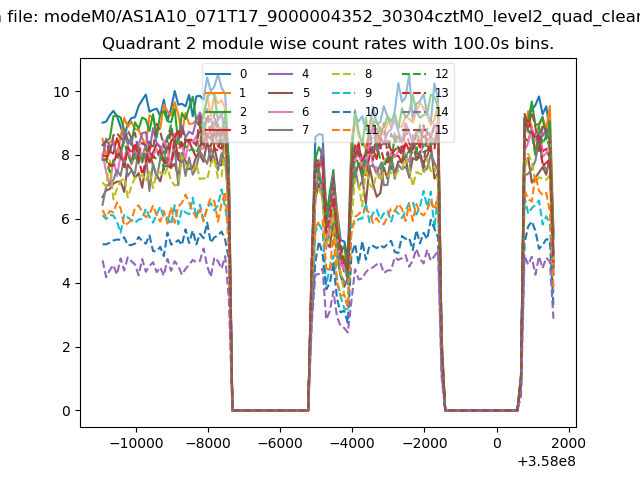
| Module-wise count rates for Quadrant B Data is divided into 100 sec bins |
 |
 |
| Module-wise count rates for Quadrant C Data is divided into 100 sec bins |
 |
 |
| Module-wise count rates for Quadrant D Data is divided into 100 sec bins |
 |
 |
| Parameter | Plot |
|---|---|
| CZT HV Monitor | 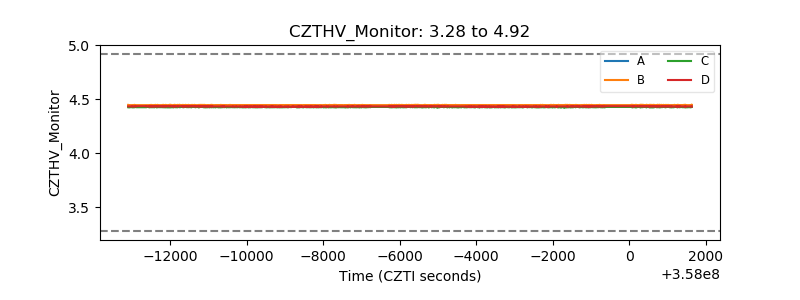 |
| D_VDD | 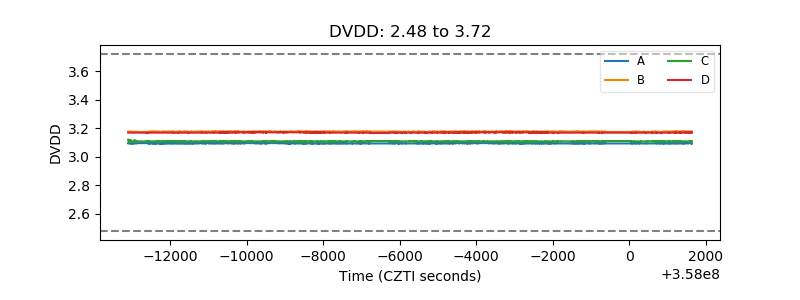 |
| Temperature 1 | 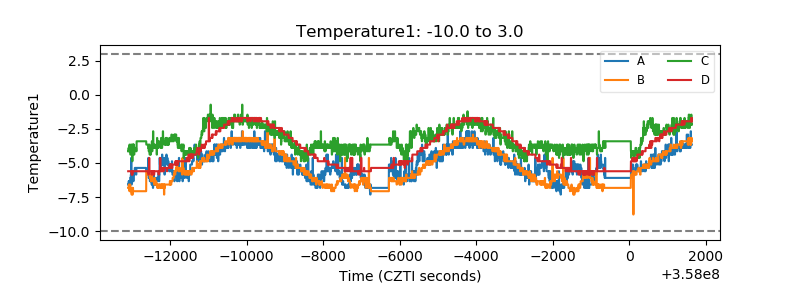 |
| Veto HV Monitor |  |
| Veto LLD | 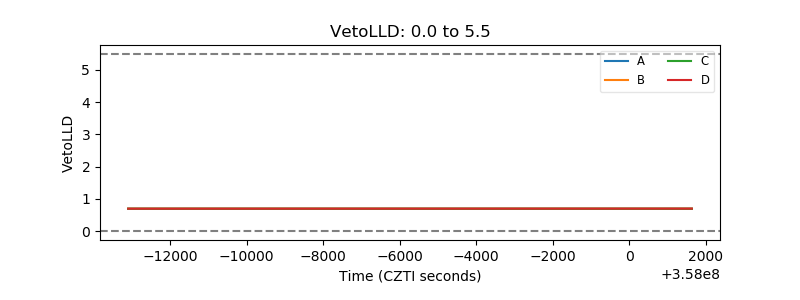 |
| Alpha Counter | 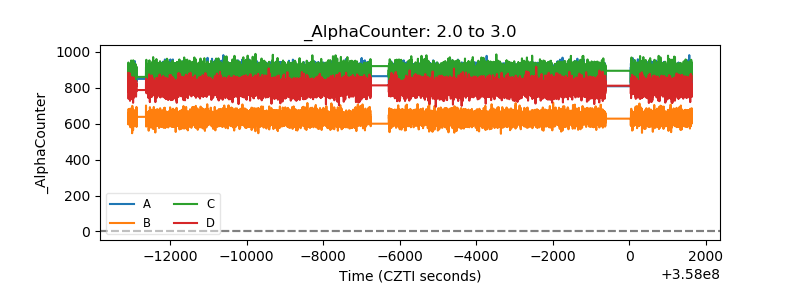 |
| _CPM_Rate | 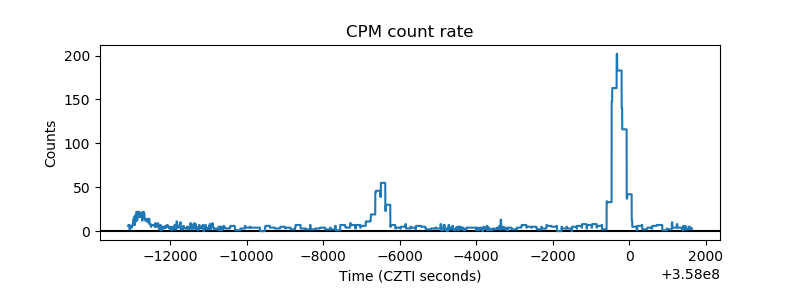 |
| CZT Counter | 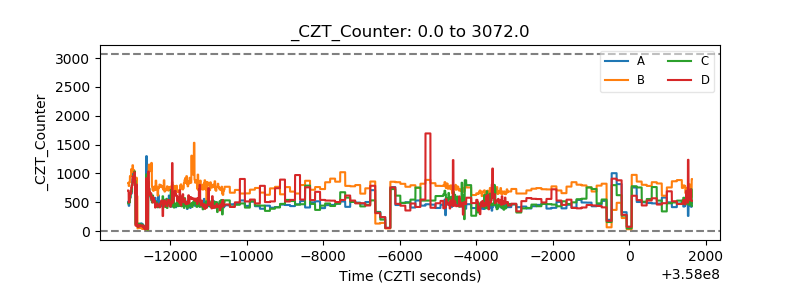 |
| +2.5 Volts monitor | 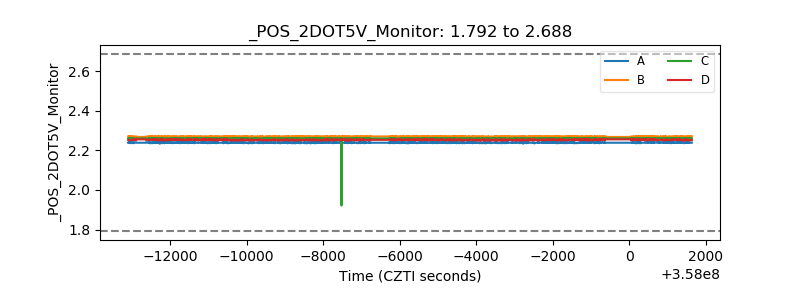 |
| +5 Volts monitor |  |
| _ROLL_ROT |  |
| _Roll_DEC |  |
| _Roll_RA | 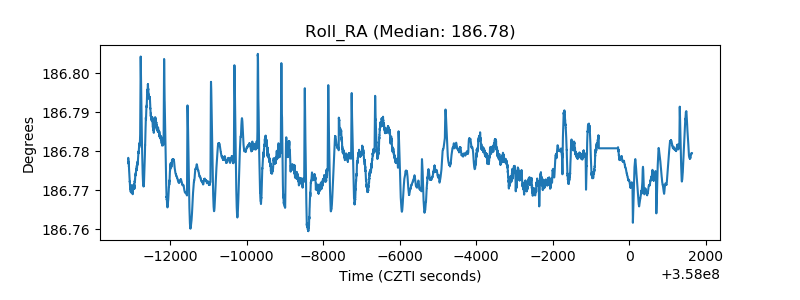 |
| Veto Counter | 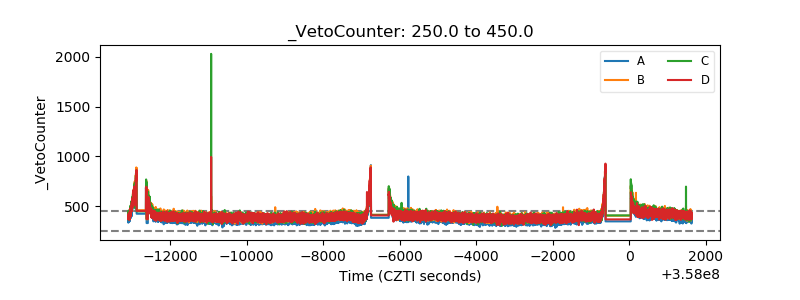 |