| Param | Original file | Final file |
|---|---|---|
| Filename | modeM0/AS1A10_071T17_9000004352_30305cztM0_level2.evt | modeM0/AS1A10_071T17_9000004352_30305cztM0_level2_quad_clean.evt |
| Size (bytes) | 171,201,600 | 38,099,520 |
| Size | 163.3 MB | 36.3 MB |
| Events in quadrant A | 1,022,621 | 256,415 |
| Events in quadrant B | 1,590,829 | 256,622 |
| Events in quadrant C | 1,038,509 | 245,935 |
| Events in quadrant D | 1,381,997 | 236,156 |
| Mode M0 | |||
|---|---|---|---|
| Quadrant | BADHDUFLAG | Total packets | Discarded packets |
| A | 0 | 4397 | 0 |
| B | 0 | 6553 | 0 |
| C | 0 | 4416 | 0 |
| D | 0 | 5406 | 0 |
| Mode SS | |||
|---|---|---|---|
| Quadrant | BADHDUFLAG | Total packets | Discarded packets |
| A | 0 | 44 | 0 |
| B | 0 | 44 | 0 |
| C | 0 | 44 | 0 |
| D | 0 | 44 | 0 |
| Quadrant | Total seconds | Saturated seconds | Saturation percentage |
|---|---|---|---|
| A | 2186 | 1 | 0.045746% |
| B | 2186 | 7 | 0.320220% |
| C | 2186 | 14 | 0.640439% |
| D | 2187 | 99 | 4.526749% |
Noise dominated data is calculated using 1-second bins in cleaned event files. If a bin has >2000 counts, and if more than 50% of those come from <1% of pixels, then it is considered to be noise-dominated and hence unusable.
| Quadrant | # 1 sec bins | Bins with >0 counts | Bins with >2000 counts | High rate bins dominated by noise | Noise dominated (total time) | Noise dominated (detector-on time) | Marked lightcurve |
|---|---|---|---|---|---|---|---|
| A | 2186 | 2186 | 0 | 0 | 0.00% | 0.00% | 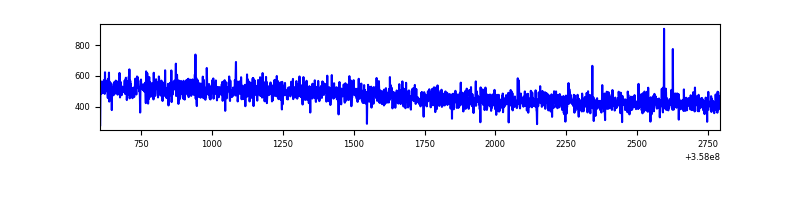 |
| B | 2186 | 2186 | 0 | 0 | 0.00% | 0.00% | 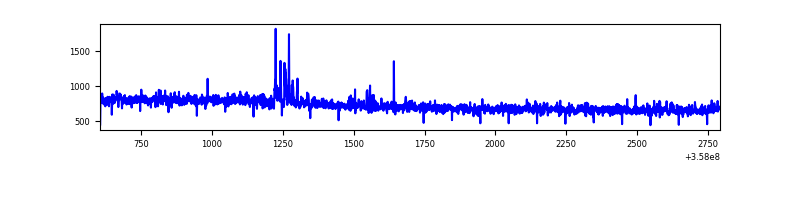 |
| C | 2186 | 2186 | 0 | 0 | 0.00% | 0.00% | 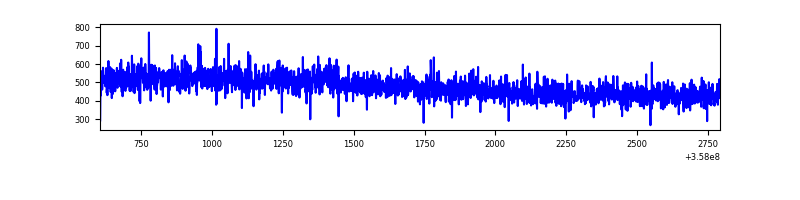 |
| D | 2187 | 2187 | 90 | 90 | 4.12% | 4.12% | 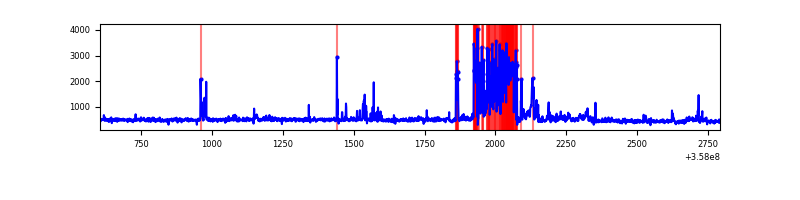 |
Top three noisy pixels from each quadrant. If the there are fewer than three noisy pixels in the level2.evt file, extra rows are filled as -1
| Pixel properties | Quadrant properties | ||||||
|---|---|---|---|---|---|---|---|
| Quadrant | DetID | PixID | Counts | Sigma | Mean | Median | Sigma |
| A | 13 | 254 | 3832 | 64.29 | 265 | 258 | 55.6 |
| A | 3 | 137 | 2735 | 44.56 | 265 | 258 | 55.6 |
| A | 0 | 226 | 2237 | 35.6 | 265 | 258 | 55.6 |
| B | 6 | 159 | 550417 | 10688.08 | 257 | 251 | 51.5 |
| B | 6 | 36 | 23488 | 451.43 | 257 | 251 | 51.5 |
| B | 12 | 111 | 6197 | 115.51 | 257 | 251 | 51.5 |
| C | 14 | 238 | 40584 | 668.48 | 252 | 253 | 60.3 |
| C | 3 | 233 | 10774 | 174.39 | 252 | 253 | 60.3 |
| C | 2 | 114 | 5101 | 80.36 | 252 | 253 | 60.3 |
| D | 5 | 222 | 300303 | 4799.81 | 252 | 245 | 62.5 |
| D | 1 | 52 | 40589 | 645.35 | 252 | 245 | 62.5 |
| D | 2 | 250 | 26955 | 427.26 | 252 | 245 | 62.5 |
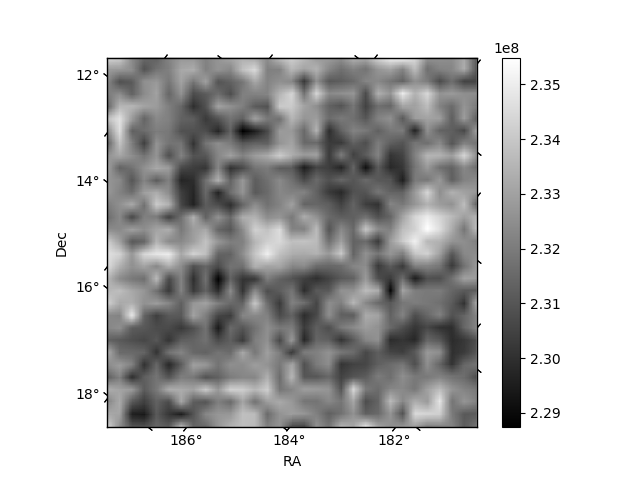
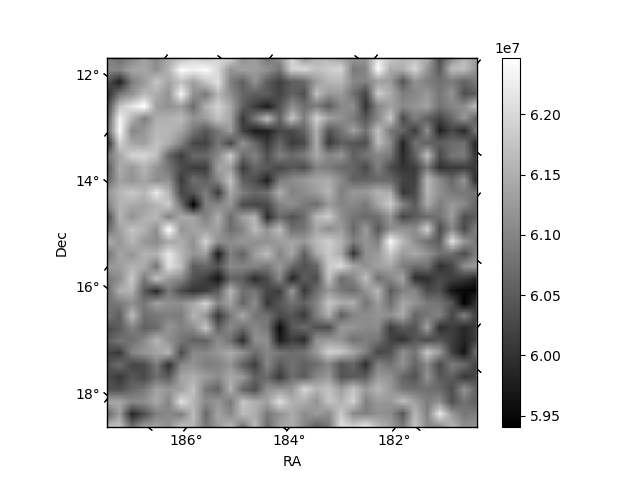
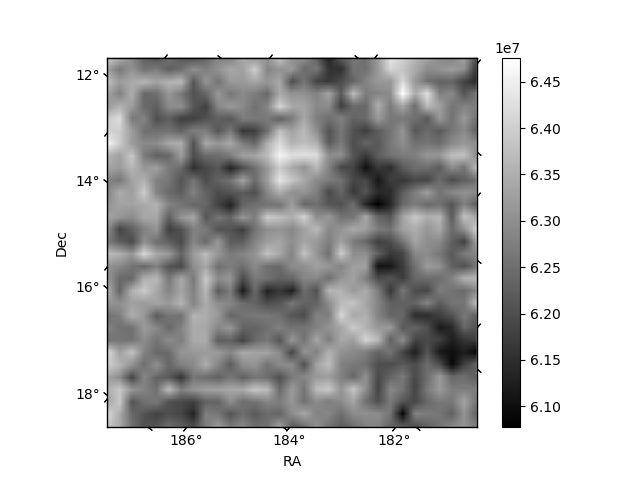
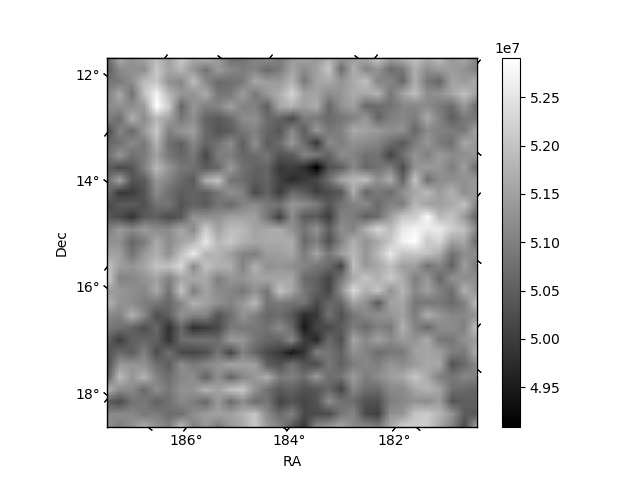
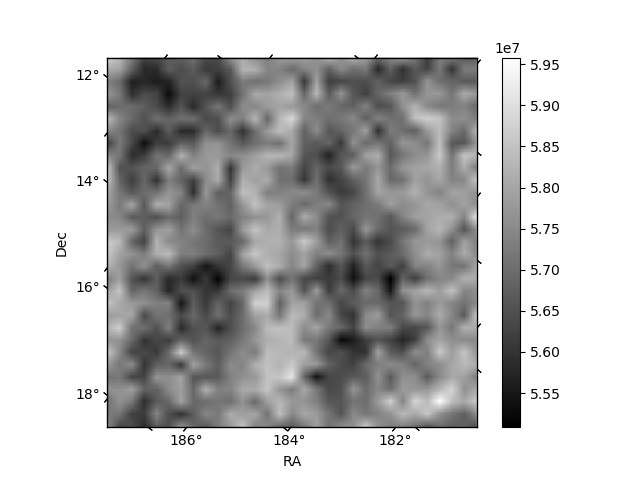
Histogram calculated using DETX and DETY for each event in the final _common_clean file
| Quadrant A | 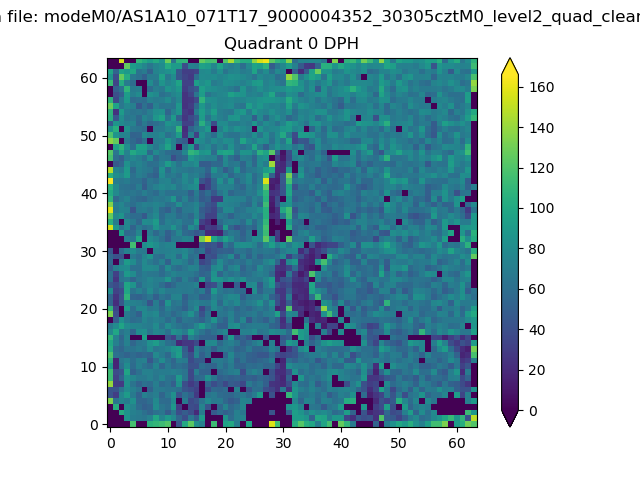 |
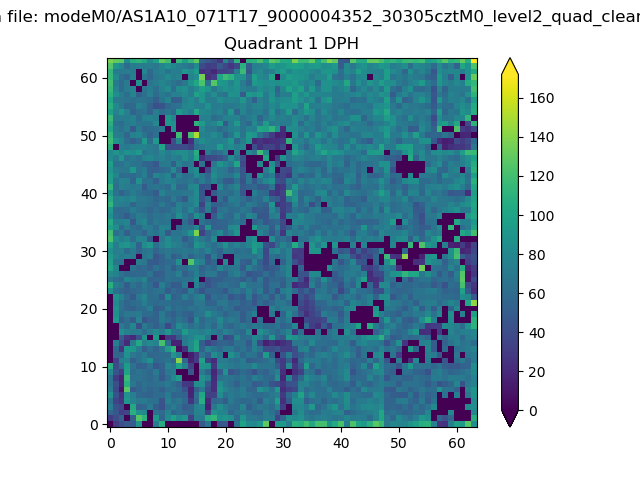 |
Quadrant B |
|---|---|---|---|
| Quadrant D | 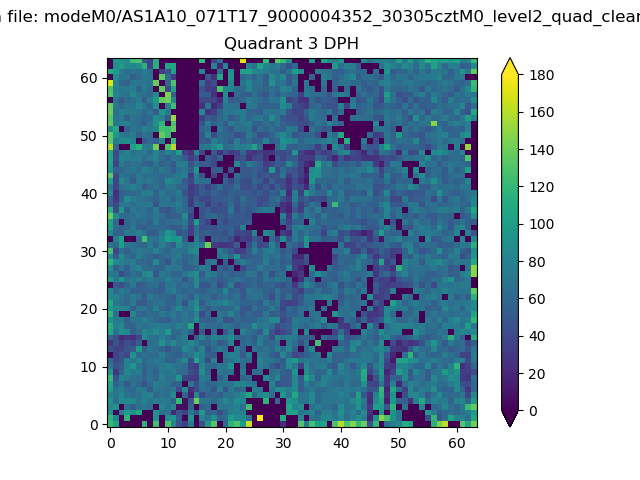 |
 |
Quadrant C |
| Plot type | Count rate plots | Images |
|---|---|---|
| Comparison with Poisson distribution Blue bars denote a histogram of data divided into 1 sec bins. Red curve is a Poisson curve with rate = median count rate of data. |
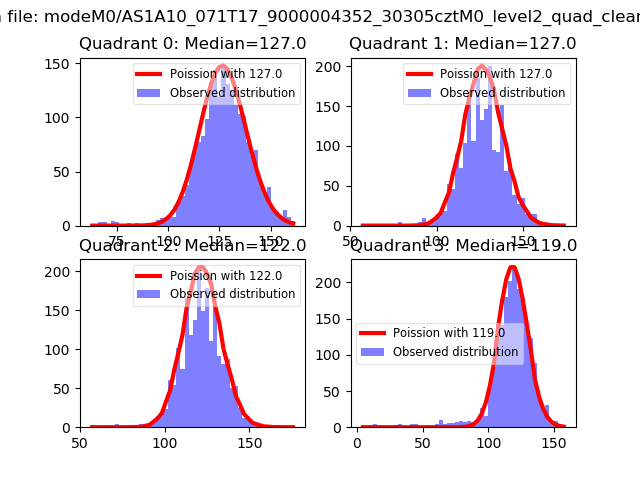 |
 |
| Quadrant-wise count rates Data is divided into 100 sec bins |
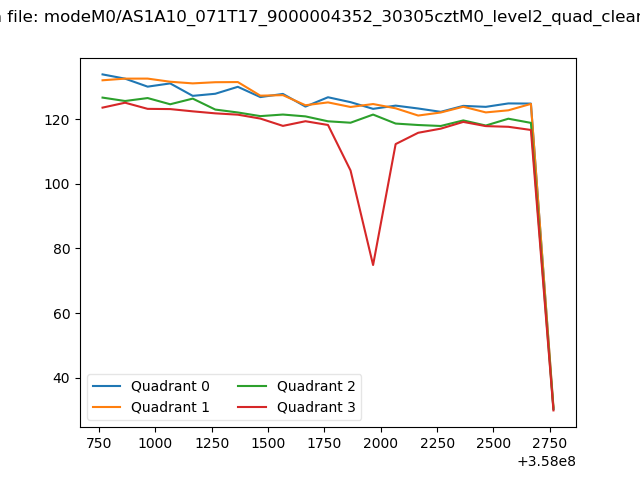 |
|
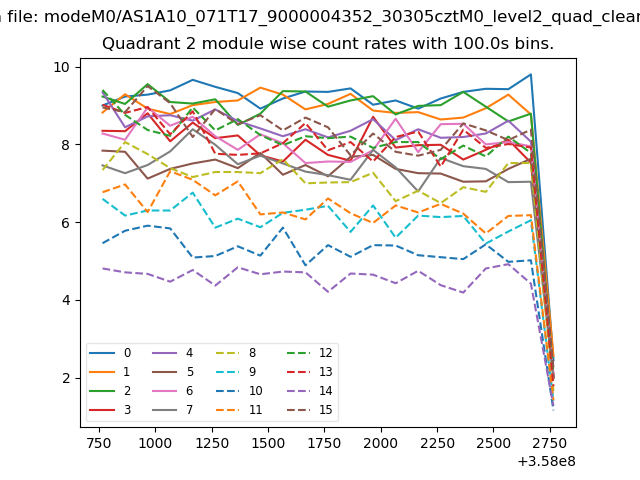
| Module-wise count rates for Quadrant A Data is divided into 100 sec bins |
 |
 |
| Module-wise count rates for Quadrant B Data is divided into 100 sec bins |
 |
 |
| Module-wise count rates for Quadrant C Data is divided into 100 sec bins |
 |
 |
| Module-wise count rates for Quadrant D Data is divided into 100 sec bins |
 |
 |
| Parameter | Plot |
|---|---|
| CZT HV Monitor |  |
| D_VDD | 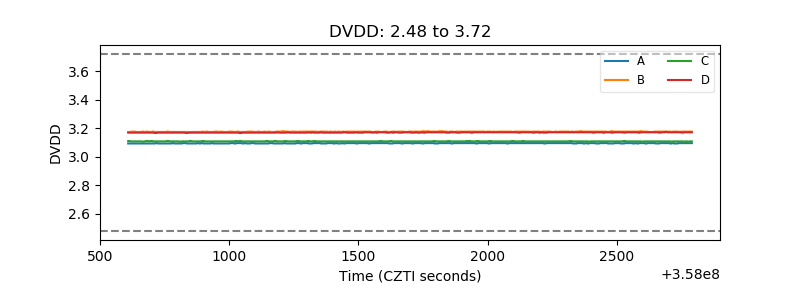 |
| Temperature 1 | 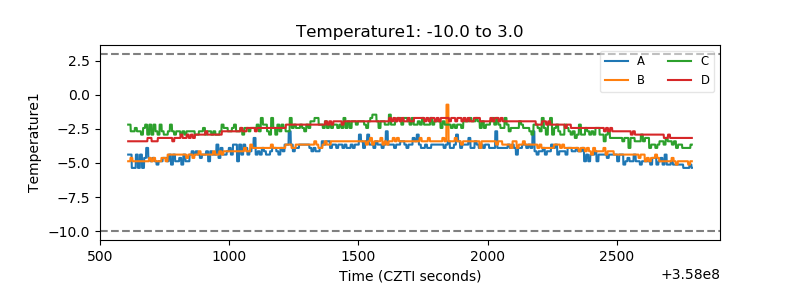 |
| Veto HV Monitor | 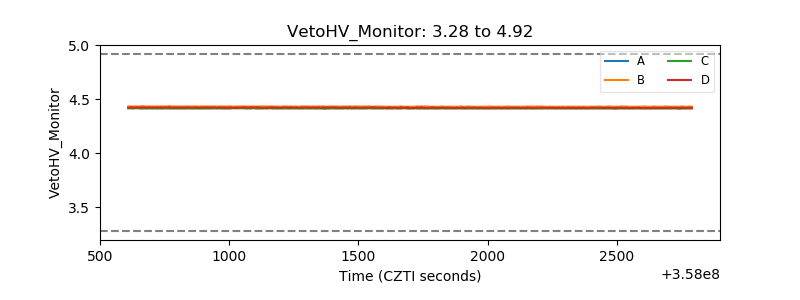 |
| Veto LLD | 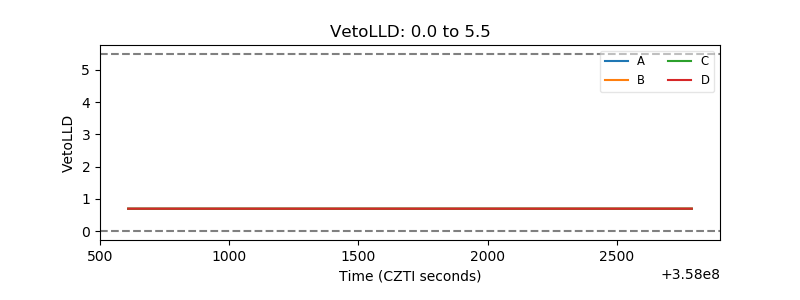 |
| Alpha Counter | 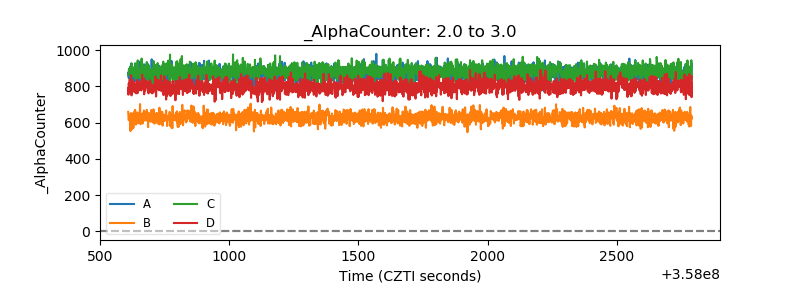 |
| _CPM_Rate | 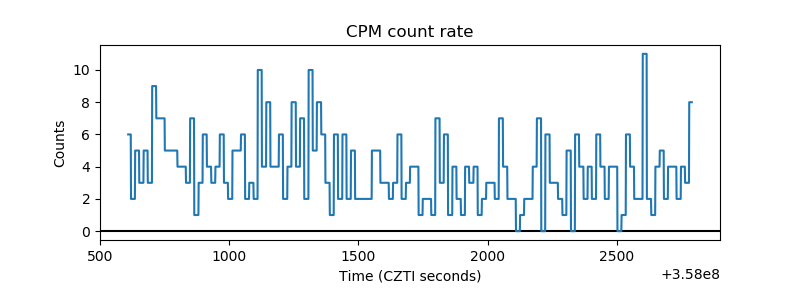 |
| CZT Counter | 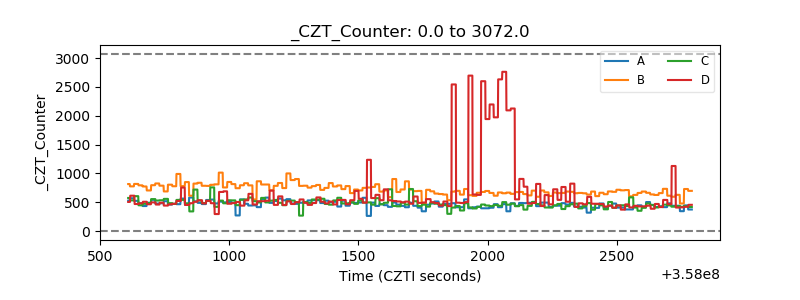 |
| +2.5 Volts monitor | 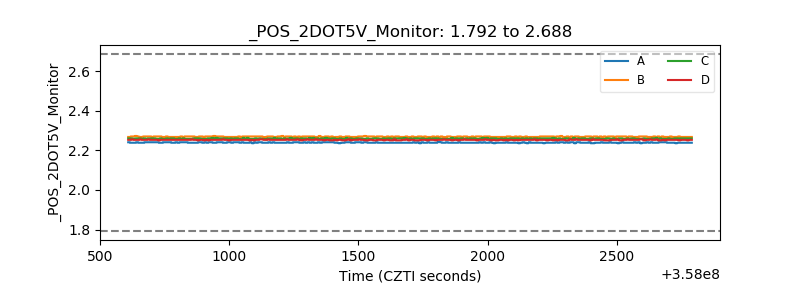 |
| +5 Volts monitor | 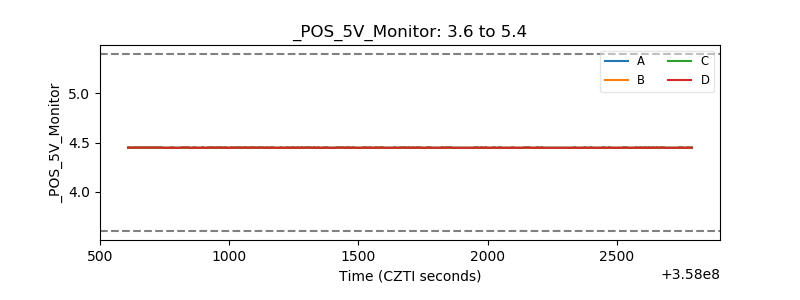 |
| _ROLL_ROT | 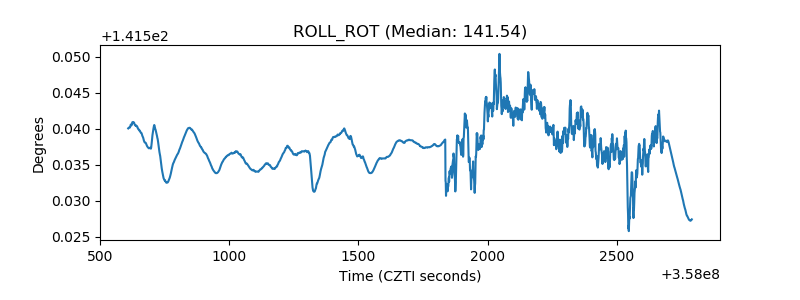 |
| _Roll_DEC | 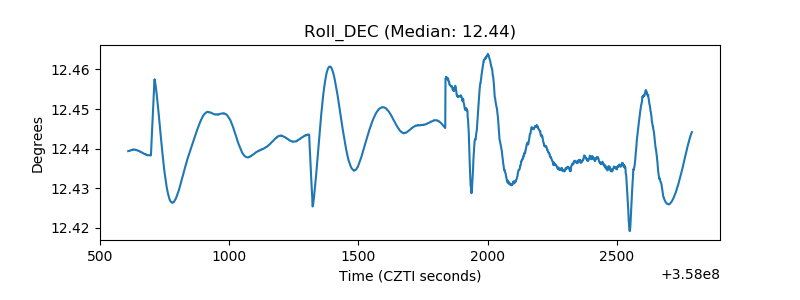 |
| _Roll_RA | 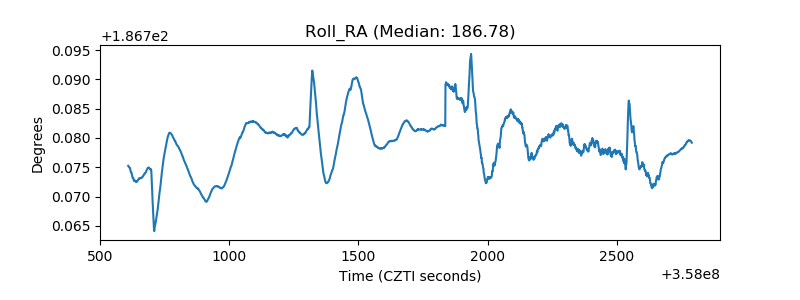 |
| Veto Counter |  |