| Param | Original file | Final file |
|---|---|---|
| Filename | modeM0/AS1A10_071T20_9000004354cztM0_level2.fits | modeM0/AS1A10_071T20_9000004354cztM0_level2_quad_clean.evt |
| Size (bytes) | 51,779,520 | 50,267,520 |
| Size | 49.4 MB | 47.9 MB |
| Events in quadrant A | 321,084 | 320,687 |
| Events in quadrant B | 302,066 | 317,969 |
| Events in quadrant C | 285,380 | 222,660 |
| Events in quadrant D | 275,730 | 276,597 |
| Mode SS | |||
|---|---|---|---|
| Quadrant | BADHDUFLAG | Total packets | Discarded packets |
| A | 0 | 110 | 0 |
| B | 0 | 110 | 0 |
| C | 0 | 110 | 0 |
| D | 0 | 110 | 0 |
| Mode M0 | |||
|---|---|---|---|
| Quadrant | BADHDUFLAG | Total packets | Discarded packets |
| A | 0 | 11274 | 0 |
| B | 0 | 17518 | 0 |
| C | 0 | 14727 | 0 |
| D | 0 | 11915 | 0 |
| Mode M9 | |||
|---|---|---|---|
| Quadrant | BADHDUFLAG | Total packets | Discarded packets |
| A | 0 | 3 | 0 |
| B | 0 | 4 | 0 |
| C | 0 | 4 | 0 |
| D | 0 | 4 | 0 |
| Quadrant | Total seconds | Saturated seconds | Saturation percentage |
|---|---|---|---|
| A | 5476 | 35 | 0.639153% |
| B | 5476 | 125 | 2.282688% |
| C | 5476 | 1547 | 28.250548% |
| D | 5476 | 64 | 1.168736% |
Noise dominated data is calculated using 1-second bins in cleaned event files. If a bin has >2000 counts, and if more than 50% of those come from <1% of pixels, then it is considered to be noise-dominated and hence unusable.
| Quadrant | # 1 sec bins | Bins with >0 counts | Bins with >2000 counts | High rate bins dominated by noise | Noise dominated (total time) | Noise dominated (detector-on time) | Marked lightcurve |
|---|---|---|---|---|---|---|---|
| A | 5475 | 5475 | 0 | 0 | 0.00% | 0.00% | 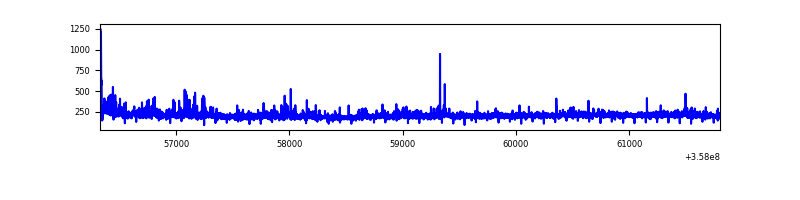 |
| B | 5475 | 5475 | 0 | 0 | 0.00% | 0.00% | 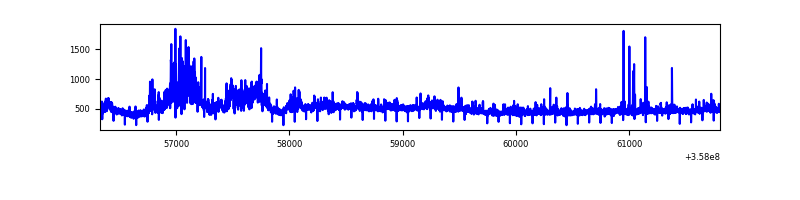 |
| C | 5475 | 5475 | 0 | 0 | 0.00% | 0.00% | 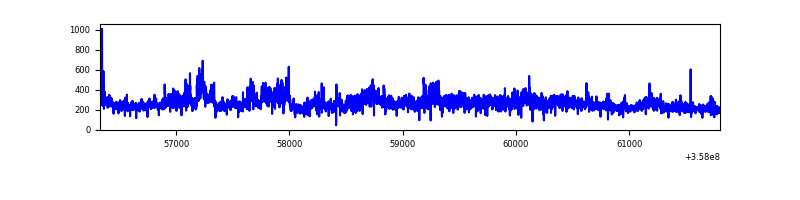 |
| D | 5475 | 5475 | 0 | 0 | 0.00% | 0.00% | 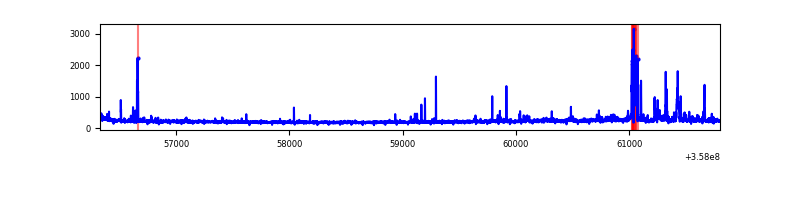 |
Top three noisy pixels from each quadrant. If the there are fewer than three noisy pixels in the level2.evt file, extra rows are filled as -1
| Pixel properties | Quadrant properties | ||||||
|---|---|---|---|---|---|---|---|
| Quadrant | DetID | PixID | Counts | Sigma | Mean | Median | Sigma |
| A | 0 | 29 | 321 | 10.42 | 83 | 78 | 23.3 |
| A | 15 | 236 | 257 | 7.68 | 83 | 78 | 23.3 |
| A | 7 | 110 | 240 | 6.95 | 83 | 78 | 23.3 |
| B | 2 | 9 | 243 | 9.07 | 79 | 75 | 18.5 |
| B | 3 | 80 | 219 | 7.78 | 79 | 75 | 18.5 |
| B | 5 | 225 | 207 | 7.13 | 79 | 75 | 18.5 |
| C | 9 | 242 | 199 | 6.06 | 75 | 70 | 21.3 |
| C | 7 | 111 | 199 | 6.06 | 75 | 70 | 21.3 |
| C | 12 | 241 | 198 | 6.01 | 75 | 70 | 21.3 |
| D | 15 | 46 | 215 | 6.3 | 78 | 71 | 22.9 |
| D | 7 | 5 | 212 | 6.16 | 78 | 71 | 22.9 |
| D | 3 | 14 | 199 | 5.6 | 78 | 71 | 22.9 |
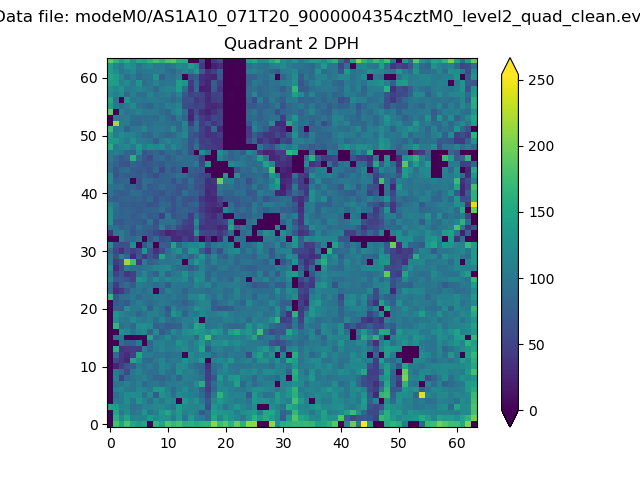
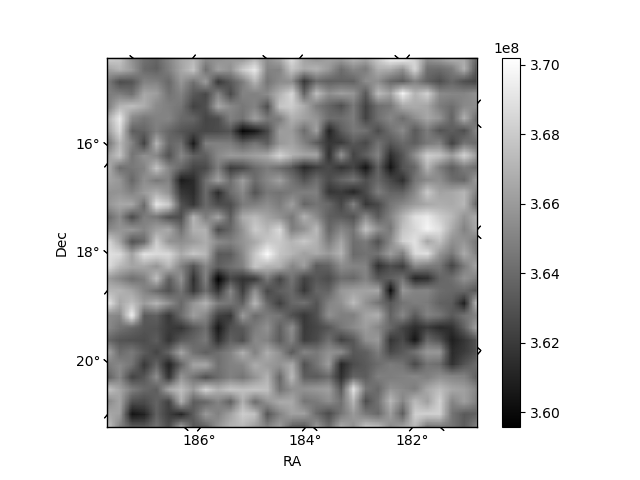
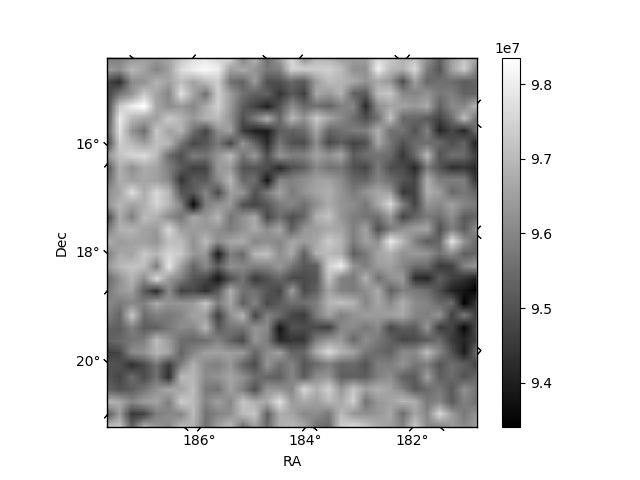
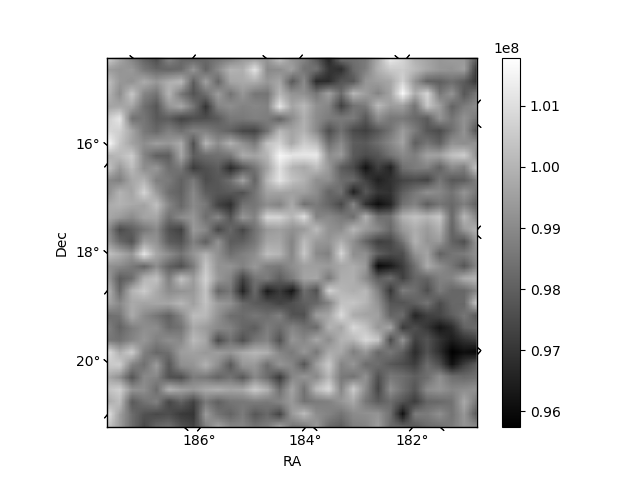
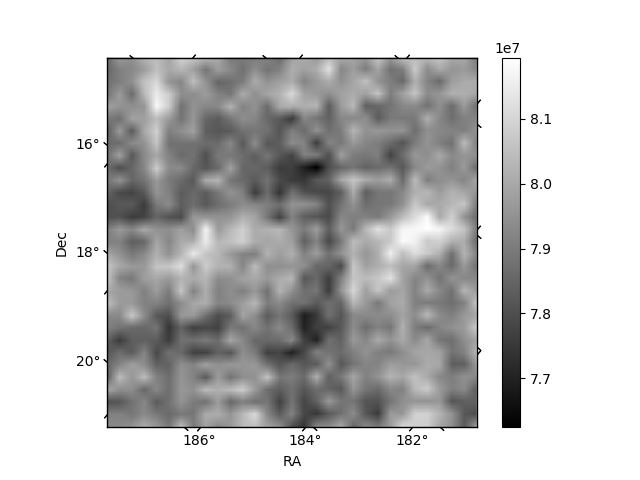
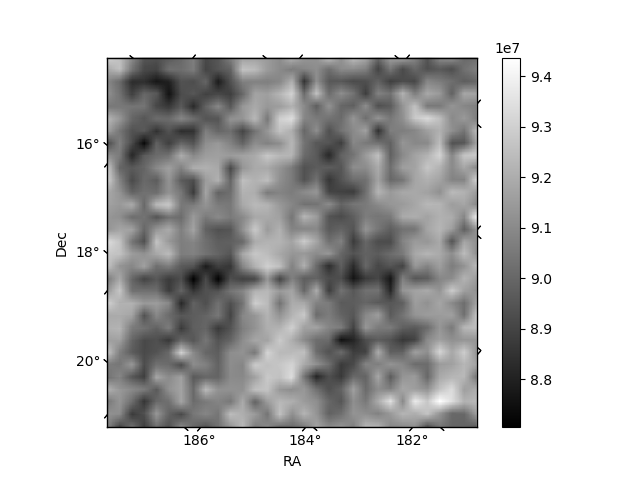
Histogram calculated using DETX and DETY for each event in the final _common_clean file
| Quadrant A | 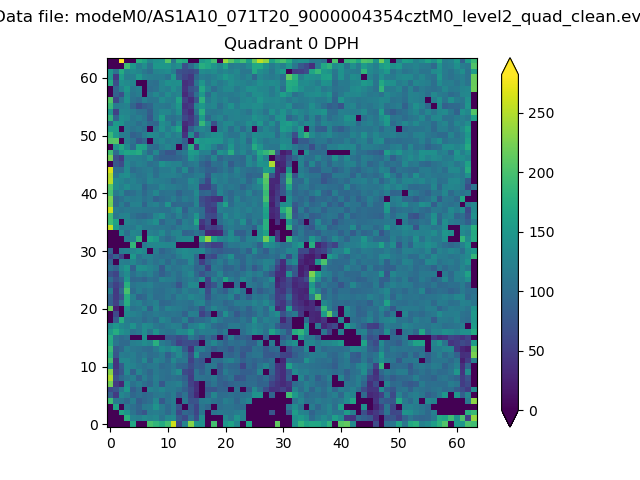 |
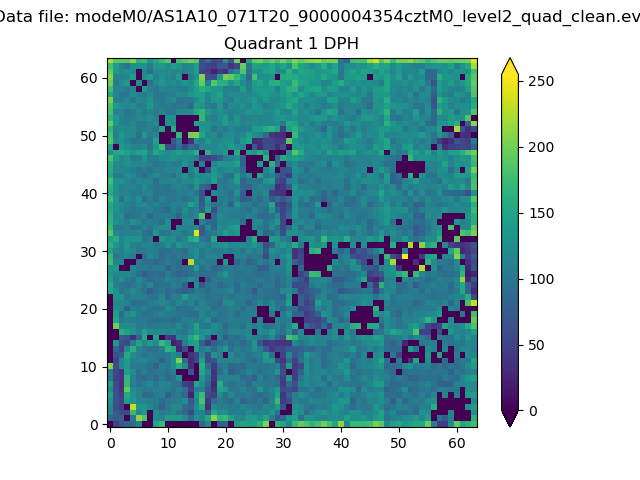 |
Quadrant B |
|---|---|---|---|
| Quadrant D | 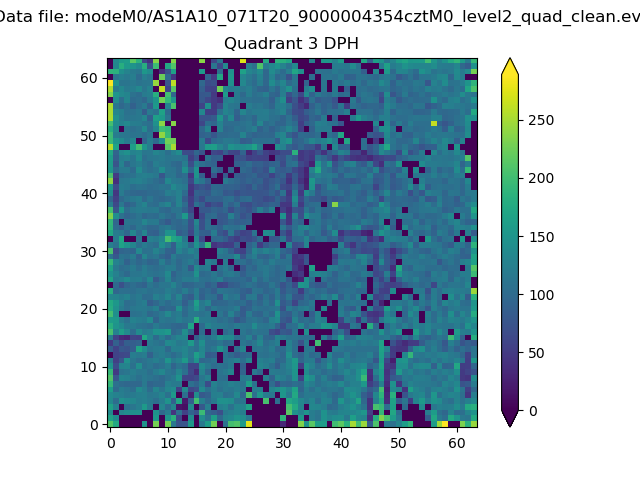 |
 |
Quadrant C |
| Plot type | Count rate plots | Images |
|---|---|---|
| Comparison with Poisson distribution Blue bars denote a histogram of data divided into 1 sec bins. Red curve is a Poisson curve with rate = median count rate of data. |
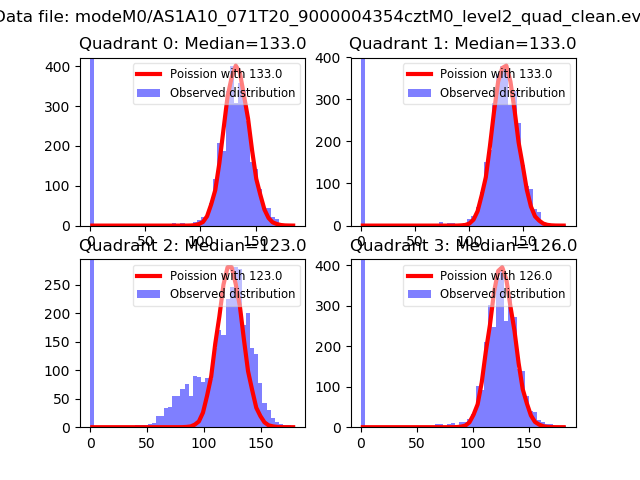 |
 |
| Quadrant-wise count rates Data is divided into 100 sec bins |
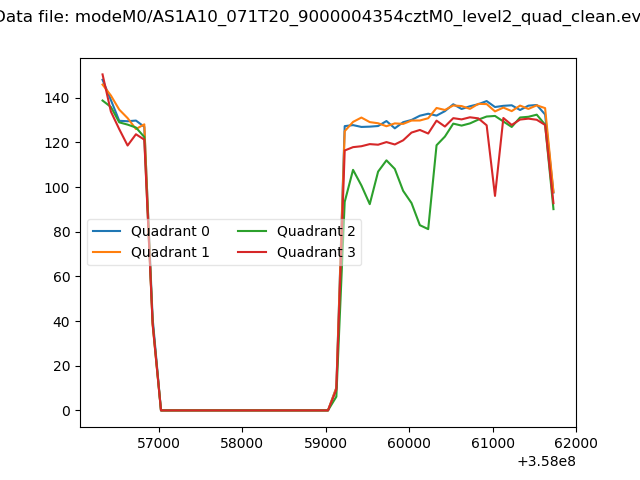 |
|
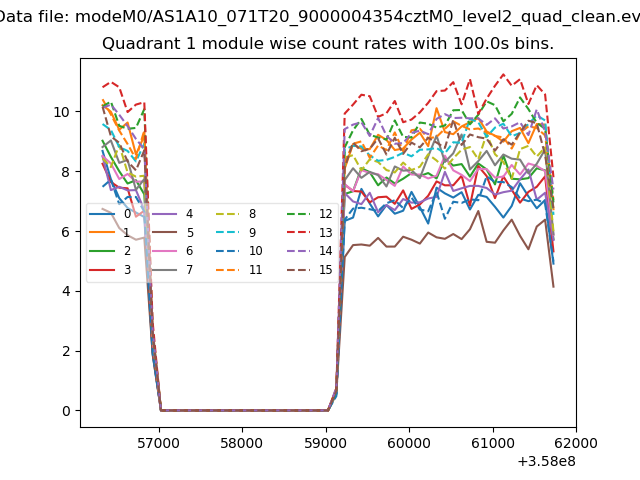
| Module-wise count rates for Quadrant A Data is divided into 100 sec bins |
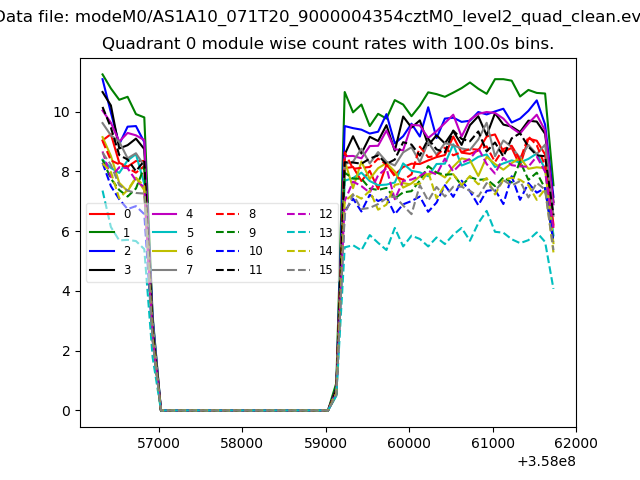 |
 |
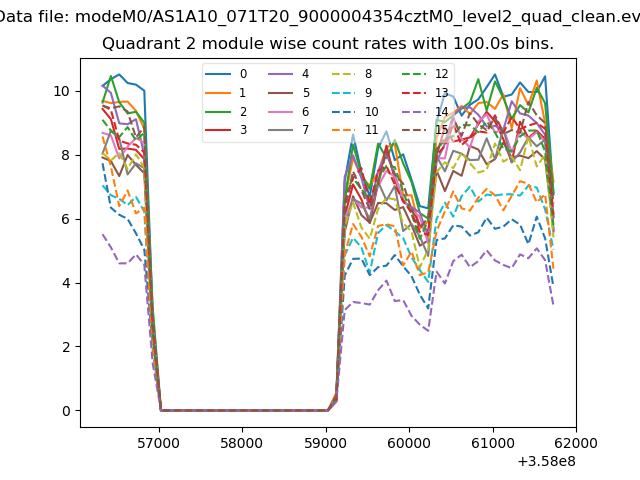
| Module-wise count rates for Quadrant B Data is divided into 100 sec bins |
 |
 |
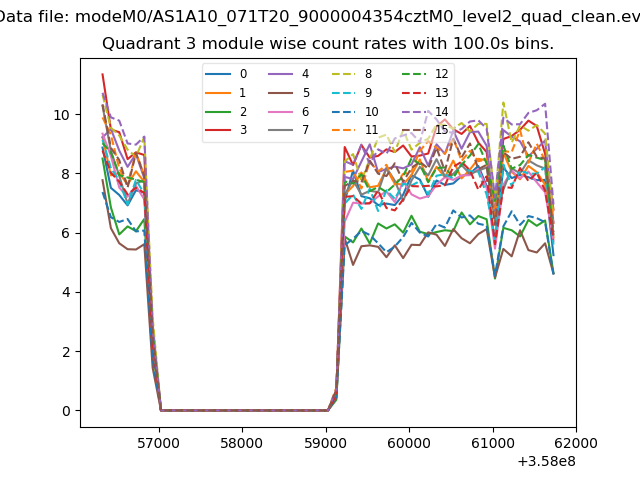
| Module-wise count rates for Quadrant C Data is divided into 100 sec bins |
 |
 |
| Module-wise count rates for Quadrant D Data is divided into 100 sec bins |
 |
 |
| Parameter | Plot |
|---|---|
| CZT HV Monitor | 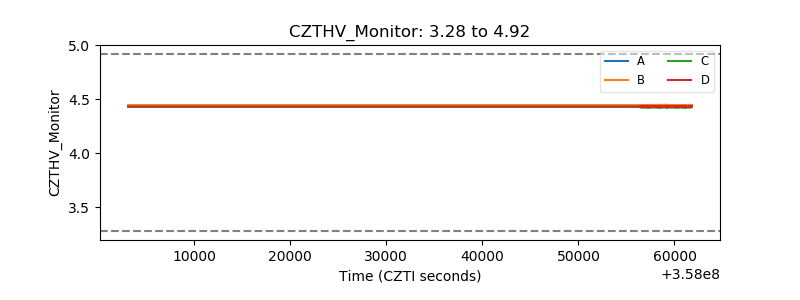 |
| D_VDD | 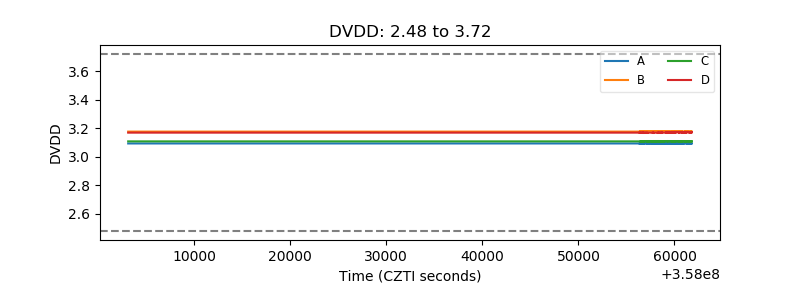 |
| Temperature 1 | 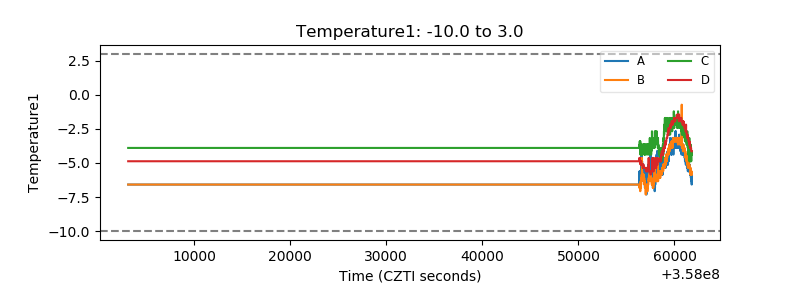 |
| Veto HV Monitor |  |
| Veto LLD | 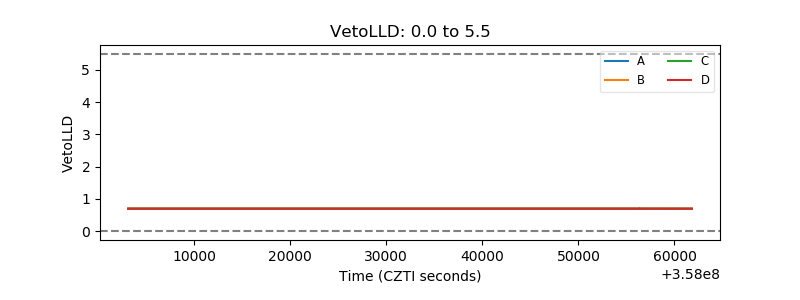 |
| Alpha Counter | 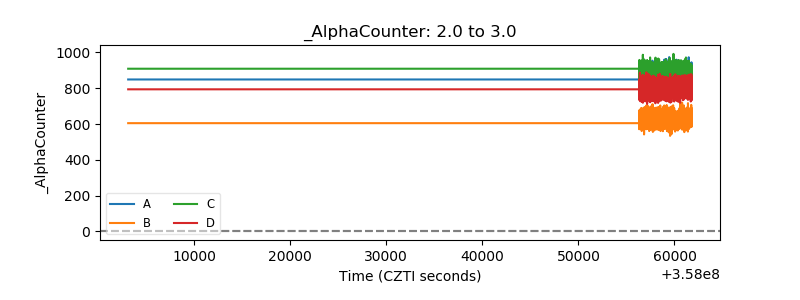 |
| _CPM_Rate | 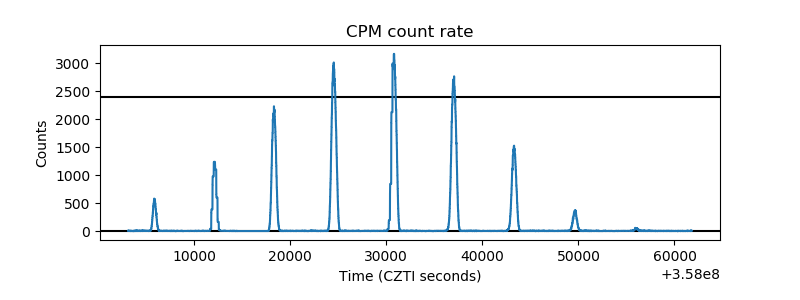 |
| CZT Counter | 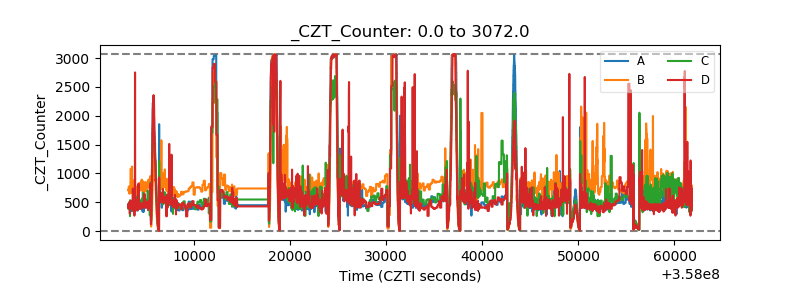 |
| +2.5 Volts monitor | 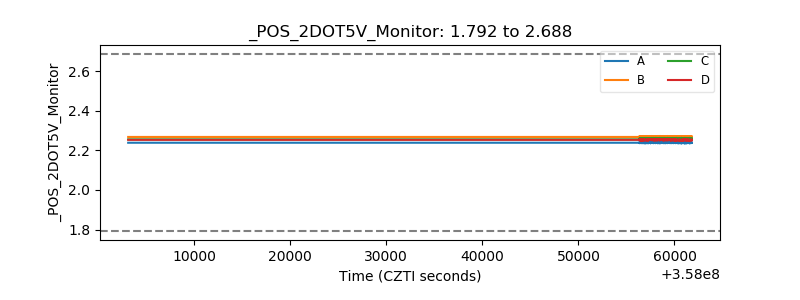 |
| +5 Volts monitor | 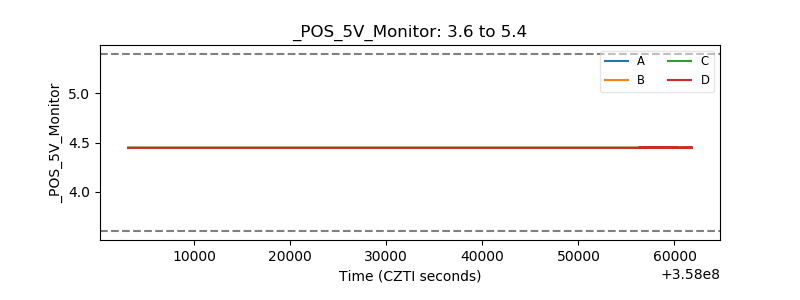 |
| _ROLL_ROT | 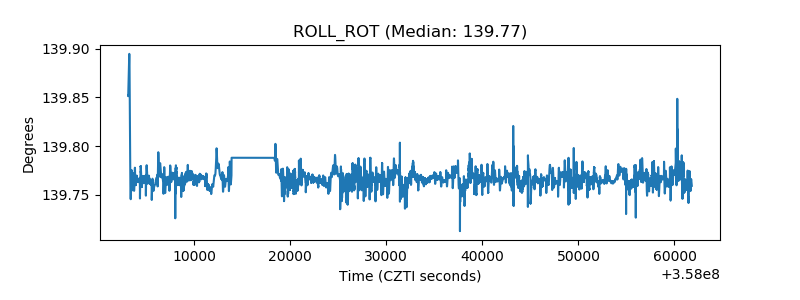 |
| _Roll_DEC | 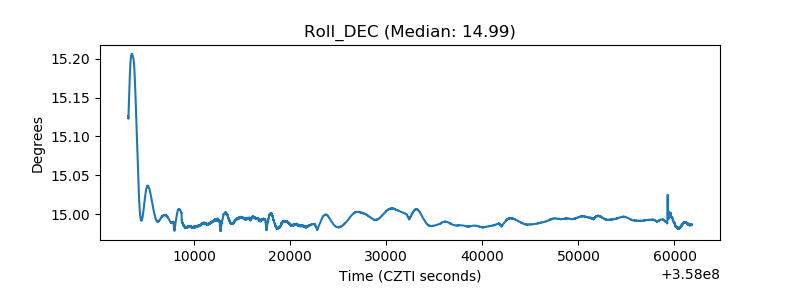 |
| _Roll_RA | 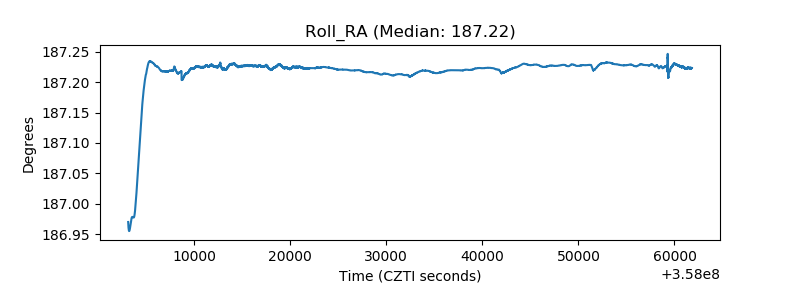 |
| Veto Counter | 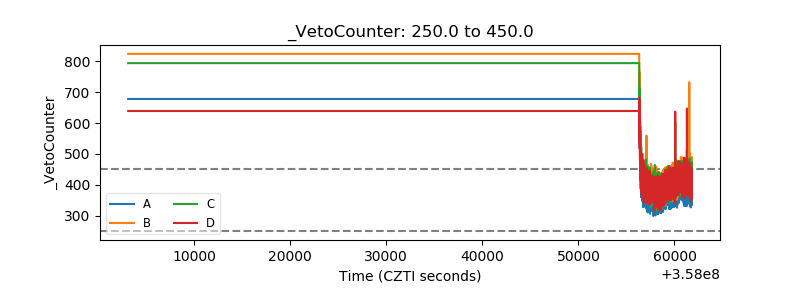 |