| Param | Original file | Final file |
|---|---|---|
| Filename | modeM0/AS1A10_071T20_9000004354_30306cztM0_level2.evt | modeM0/AS1A10_071T20_9000004354_30306cztM0_level2_quad_clean.evt |
| Size (bytes) | 508,936,320 | 101,223,360 |
| Size | 485.4 MB | 96.5 MB |
| Events in quadrant A | 3,236,324 | 665,803 |
| Events in quadrant B | 4,940,679 | 665,050 |
| Events in quadrant C | 3,370,203 | 642,992 |
| Events in quadrant D | 3,423,169 | 636,292 |
| Mode SS | |||
|---|---|---|---|
| Quadrant | BADHDUFLAG | Total packets | Discarded packets |
| A | 0 | 134 | 0 |
| B | 0 | 134 | 0 |
| C | 0 | 134 | 0 |
| D | 0 | 134 | 0 |
| Mode M0 | |||
|---|---|---|---|
| Quadrant | BADHDUFLAG | Total packets | Discarded packets |
| A | 0 | 13920 | 2 |
| B | 0 | 19732 | 2 |
| C | 0 | 14171 | 2 |
| D | 0 | 14512 | 2 |
| Mode M9 | |||
|---|---|---|---|
| Quadrant | BADHDUFLAG | Total packets | Discarded packets |
| A | 0 | 18 | 0 |
| B | 0 | 19 | 0 |
| C | 0 | 19 | 0 |
| D | 0 | 19 | 0 |
| Quadrant | Total seconds | Saturated seconds | Saturation percentage |
|---|---|---|---|
| A | 6534 | 79 | 1.209060% |
| B | 6534 | 109 | 1.668197% |
| C | 6534 | 120 | 1.836547% |
| D | 6534 | 62 | 0.948883% |
Noise dominated data is calculated using 1-second bins in cleaned event files. If a bin has >2000 counts, and if more than 50% of those come from <1% of pixels, then it is considered to be noise-dominated and hence unusable.
| Quadrant | # 1 sec bins | Bins with >0 counts | Bins with >2000 counts | High rate bins dominated by noise | Noise dominated (total time) | Noise dominated (detector-on time) | Marked lightcurve |
|---|---|---|---|---|---|---|---|
| A | 7539 | 6534 | 0 | 0 | 0.00% | 0.00% | 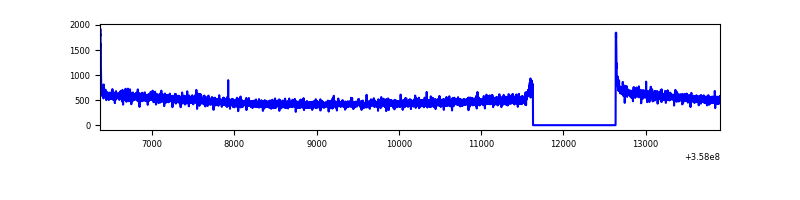 |
| B | 7539 | 6534 | 0 | 0 | 0.00% | 0.00% | 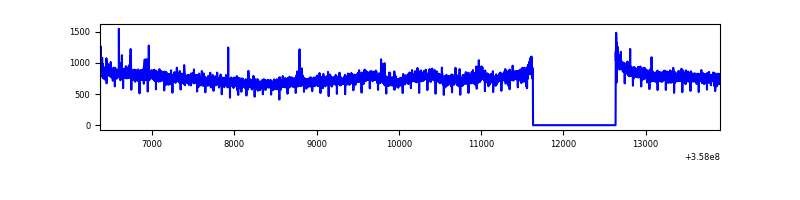 |
| C | 7539 | 6534 | 0 | 0 | 0.00% | 0.00% | 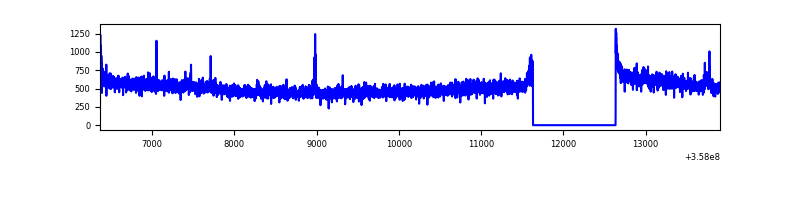 |
| D | 7539 | 6534 | 20 | 20 | 0.27% | 0.31% | 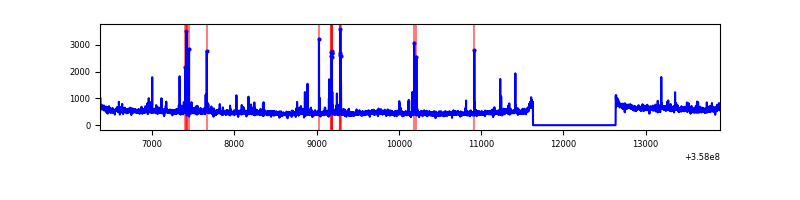 |
Top three noisy pixels from each quadrant. If the there are fewer than three noisy pixels in the level2.evt file, extra rows are filled as -1
| Pixel properties | Quadrant properties | ||||||
|---|---|---|---|---|---|---|---|
| Quadrant | DetID | PixID | Counts | Sigma | Mean | Median | Sigma |
| A | 8 | 192 | 24986 | 144.69 | 832 | 816 | 167.0 |
| A | 13 | 254 | 11968 | 66.76 | 832 | 816 | 167.0 |
| A | 3 | 137 | 8519 | 46.11 | 832 | 816 | 167.0 |
| B | 6 | 159 | 1711905 | 10867.94 | 816 | 793 | 157.4 |
| B | 12 | 111 | 19888 | 121.28 | 816 | 793 | 157.4 |
| B | 11 | 111 | 18266 | 110.98 | 816 | 793 | 157.4 |
| C | 14 | 238 | 127503 | 674.32 | 798 | 801 | 187.9 |
| C | 3 | 233 | 108057 | 570.83 | 798 | 801 | 187.9 |
| C | 2 | 114 | 15361 | 77.49 | 798 | 801 | 187.9 |
| D | 8 | 195 | 119164 | 574.42 | 805 | 790 | 206.1 |
| D | 2 | 250 | 69637 | 334.09 | 805 | 790 | 206.1 |
| D | 1 | 52 | 61728 | 295.71 | 805 | 790 | 206.1 |
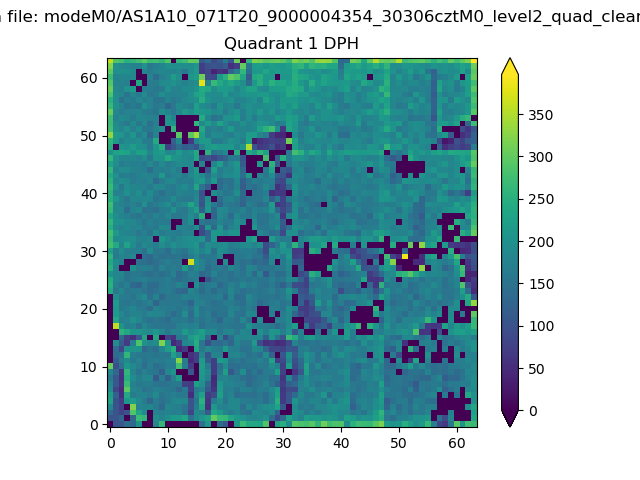
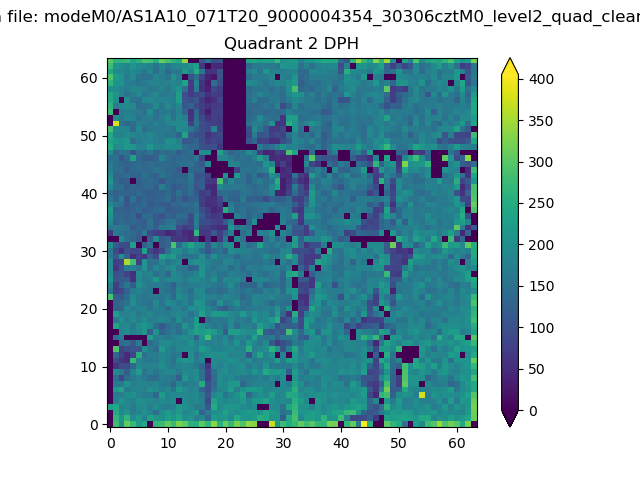
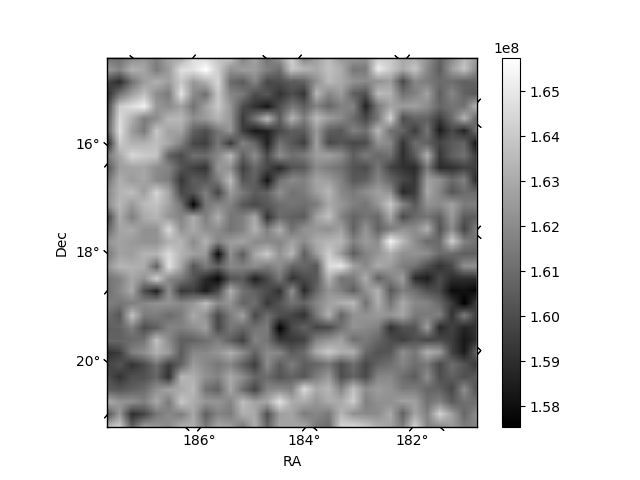
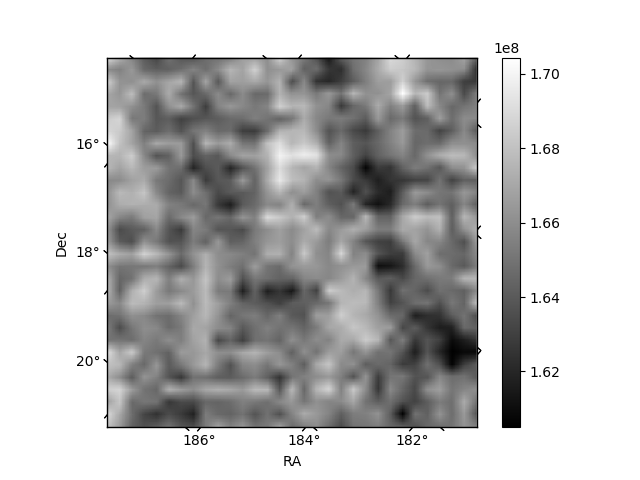
Histogram calculated using DETX and DETY for each event in the final _common_clean file
| Quadrant A |  |
 |
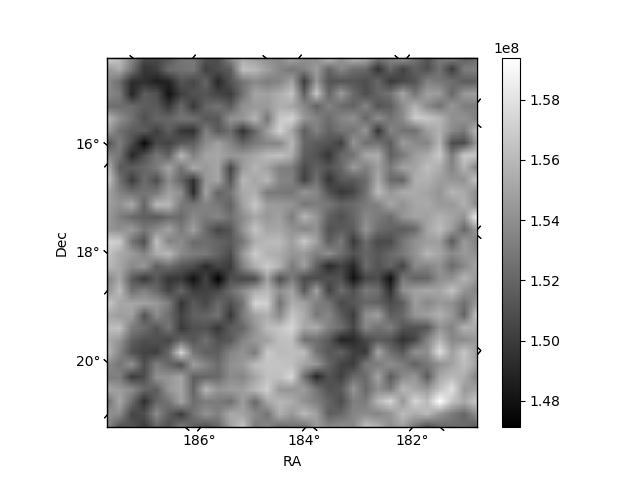
Quadrant B |
|---|---|---|---|
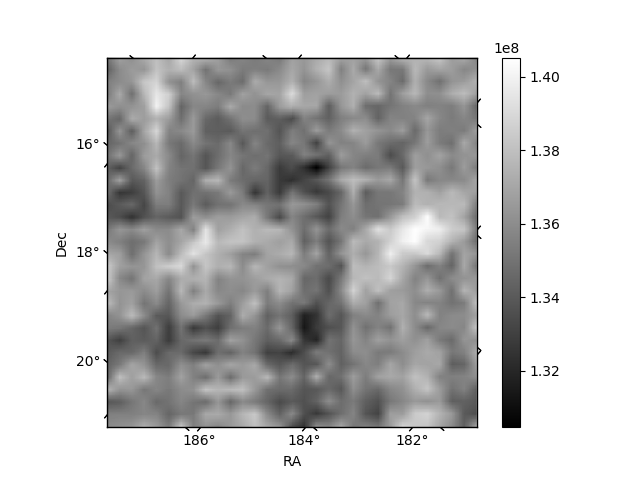
| Quadrant D | 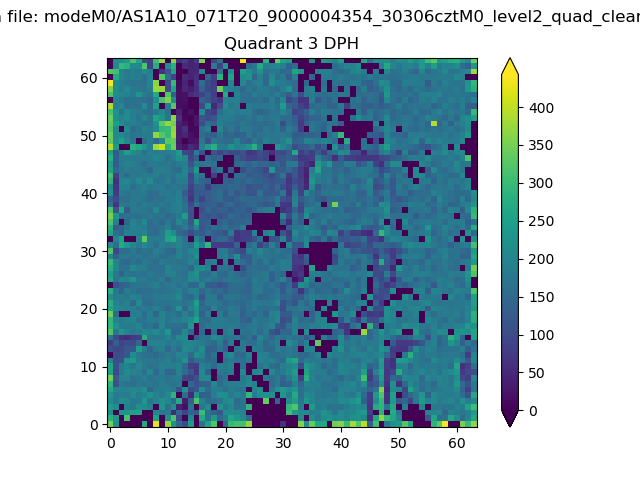 |
 |
Quadrant C |
| Plot type | Count rate plots | Images |
|---|---|---|
| Comparison with Poisson distribution Blue bars denote a histogram of data divided into 1 sec bins. Red curve is a Poisson curve with rate = median count rate of data. |
 |
 |
| Quadrant-wise count rates Data is divided into 100 sec bins |
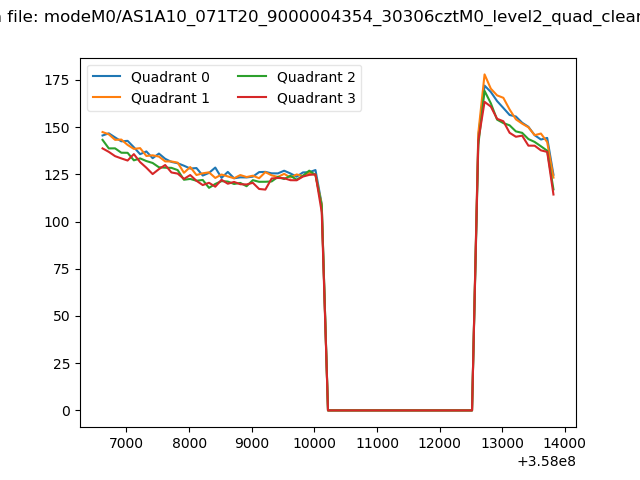 |
|
| Module-wise count rates for Quadrant A Data is divided into 100 sec bins |
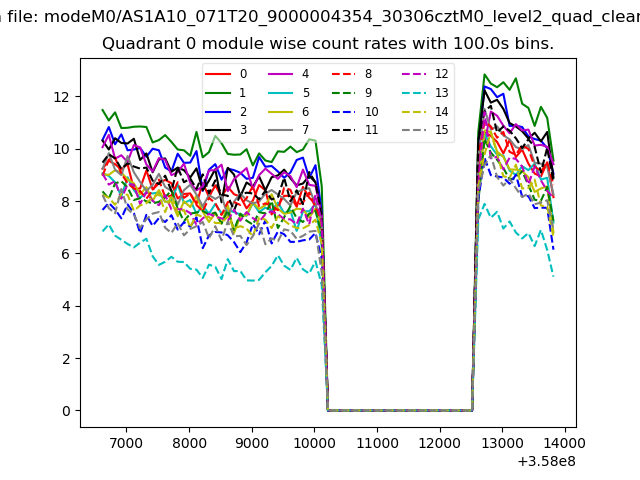 |
 |
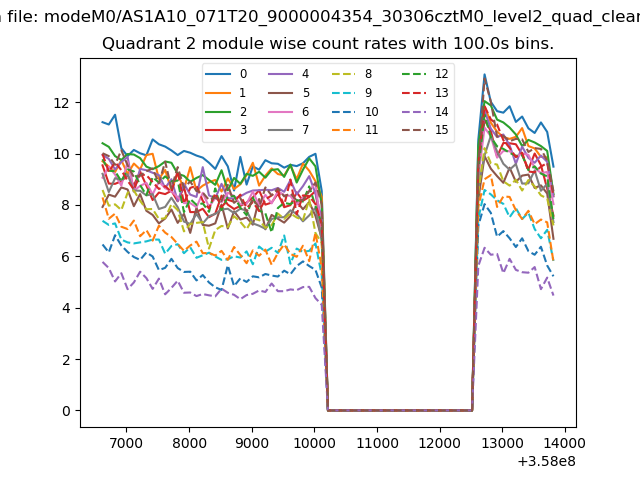
| Module-wise count rates for Quadrant B Data is divided into 100 sec bins |
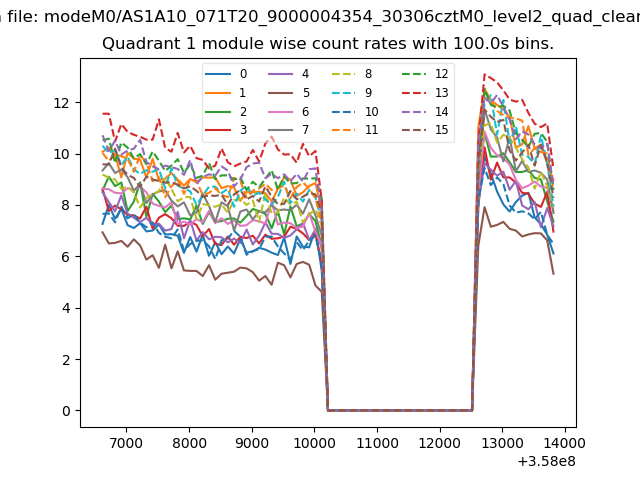 |
 |
| Module-wise count rates for Quadrant C Data is divided into 100 sec bins |
 |
 |
| Module-wise count rates for Quadrant D Data is divided into 100 sec bins |
 |
 |
| Parameter | Plot |
|---|---|
| CZT HV Monitor | 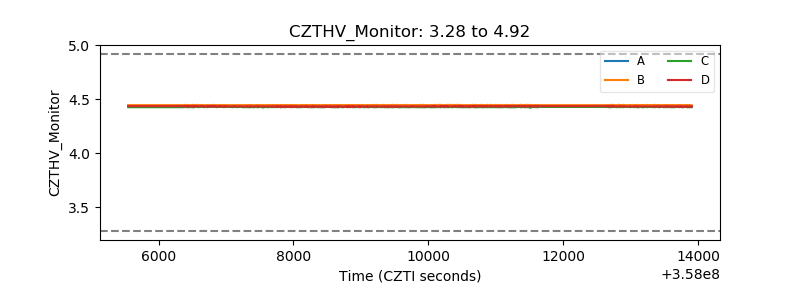 |
| D_VDD | 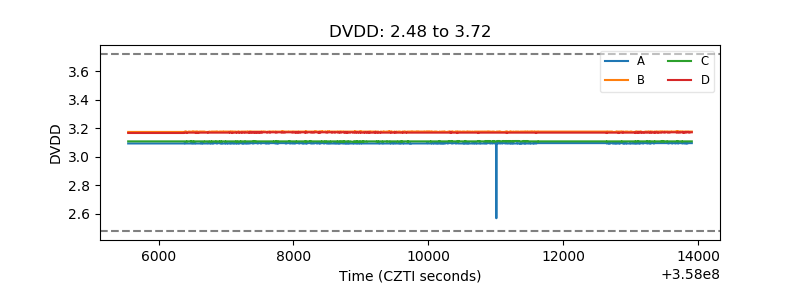 |
| Temperature 1 | 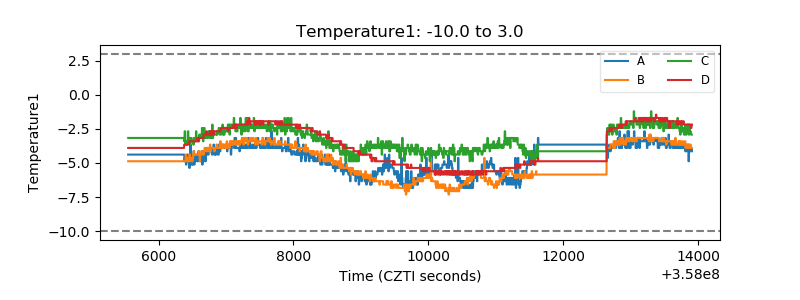 |
| Veto HV Monitor | 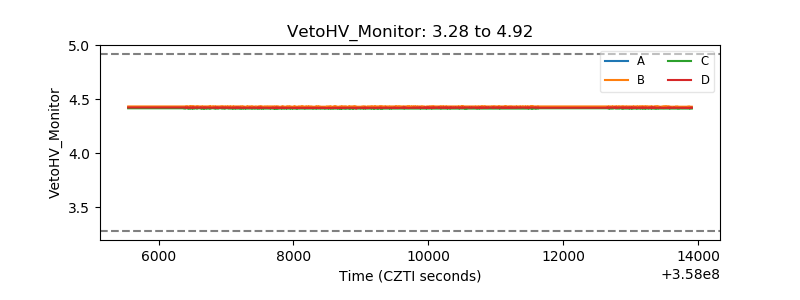 |
| Veto LLD | 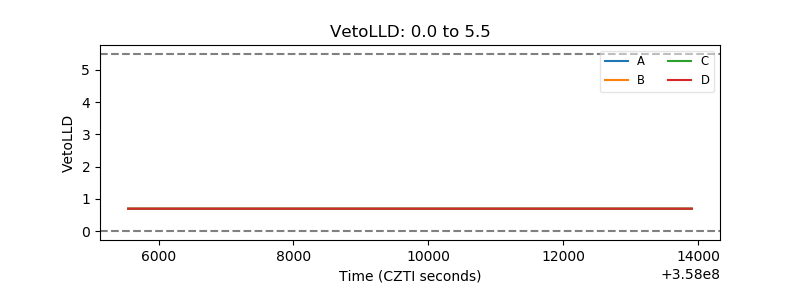 |
| Alpha Counter | 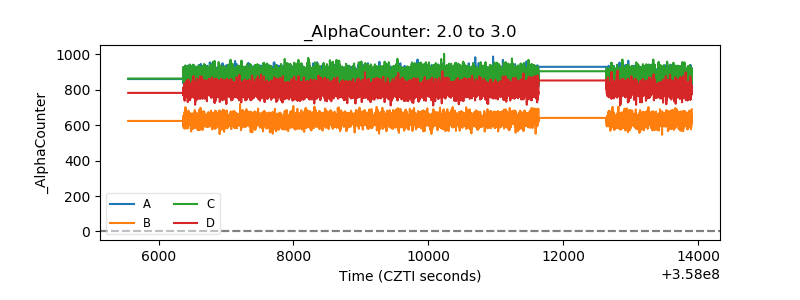 |
| _CPM_Rate | 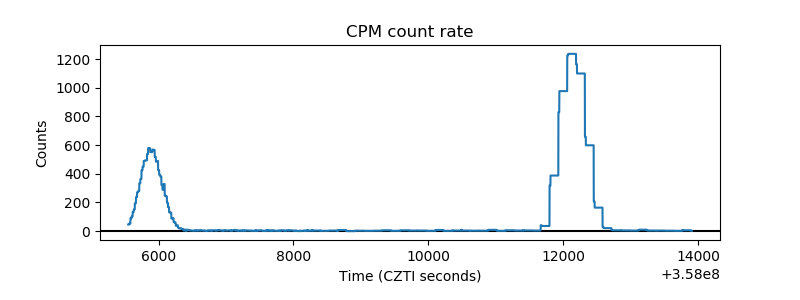 |
| CZT Counter | 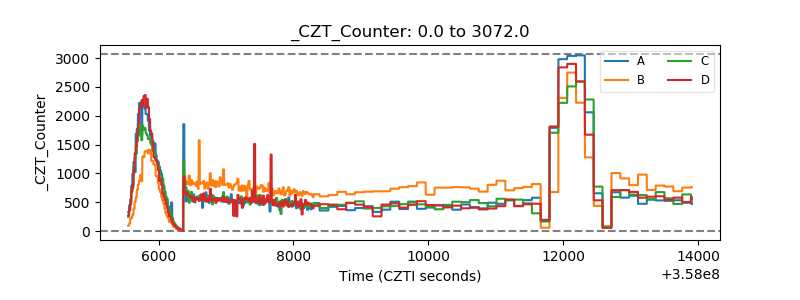 |
| +2.5 Volts monitor |  |
| +5 Volts monitor |  |
| _ROLL_ROT |  |
| _Roll_DEC | 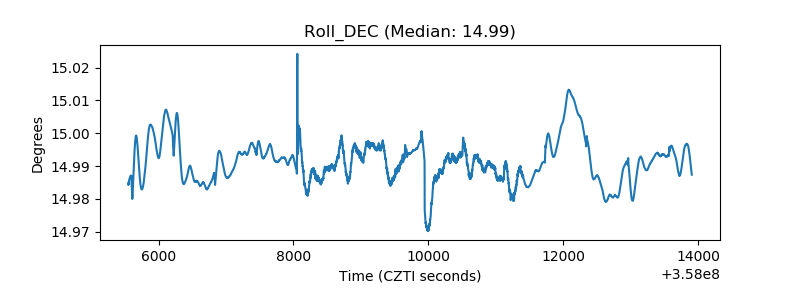 |
| _Roll_RA | 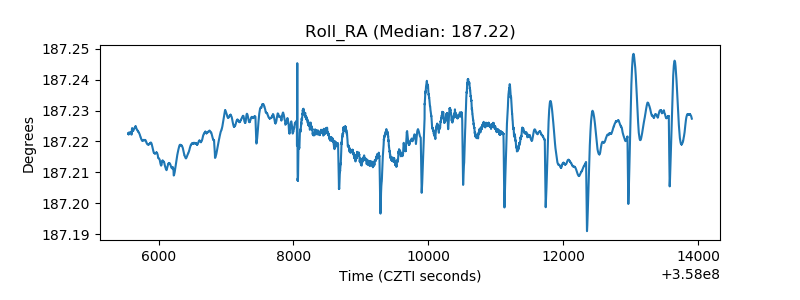 |
| Veto Counter | 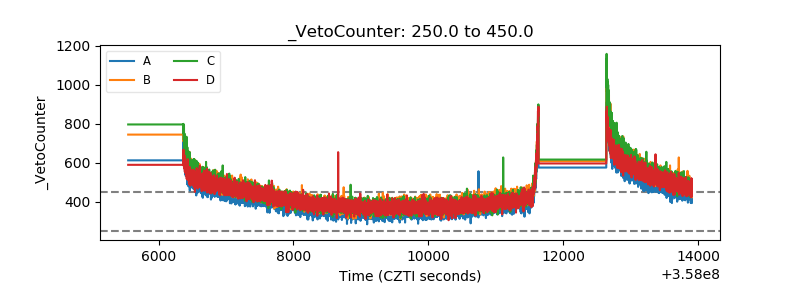 |