| Param | Original file | Final file |
|---|---|---|
| Filename | modeM0/AS1A10_071T20_9000004354_30309cztM0_level2.evt | modeM0/AS1A10_071T20_9000004354_30309cztM0_level2_quad_clean.evt |
| Size (bytes) | 554,109,120 | 101,249,280 |
| Size | 528.4 MB | 96.6 MB |
| Events in quadrant A | 3,285,072 | 672,435 |
| Events in quadrant B | 5,239,035 | 678,754 |
| Events in quadrant C | 3,769,130 | 652,180 |
| Events in quadrant D | 4,063,567 | 625,416 |
| Mode SS | |||
|---|---|---|---|
| Quadrant | BADHDUFLAG | Total packets | Discarded packets |
| A | 0 | 126 | 0 |
| B | 0 | 126 | 0 |
| C | 0 | 126 | 0 |
| D | 0 | 126 | 0 |
| Mode M0 | |||
|---|---|---|---|
| Quadrant | BADHDUFLAG | Total packets | Discarded packets |
| A | 0 | 13819 | 2 |
| B | 0 | 20002 | 2 |
| C | 0 | 15455 | 2 |
| D | 0 | 16482 | 2 |
| Mode M9 | |||
|---|---|---|---|
| Quadrant | BADHDUFLAG | Total packets | Discarded packets |
| A | 0 | 18 | 0 |
| B | 0 | 19 | 0 |
| C | 0 | 19 | 0 |
| D | 0 | 19 | 0 |
| Quadrant | Total seconds | Saturated seconds | Saturation percentage |
|---|---|---|---|
| A | 6276 | 87 | 1.386233% |
| B | 6276 | 183 | 2.915870% |
| C | 6276 | 168 | 2.676864% |
| D | 6276 | 127 | 2.023582% |
Noise dominated data is calculated using 1-second bins in cleaned event files. If a bin has >2000 counts, and if more than 50% of those come from <1% of pixels, then it is considered to be noise-dominated and hence unusable.
| Quadrant | # 1 sec bins | Bins with >0 counts | Bins with >2000 counts | High rate bins dominated by noise | Noise dominated (total time) | Noise dominated (detector-on time) | Marked lightcurve |
|---|---|---|---|---|---|---|---|
| A | 7501 | 6276 | 3 | 3 | 0.04% | 0.05% | 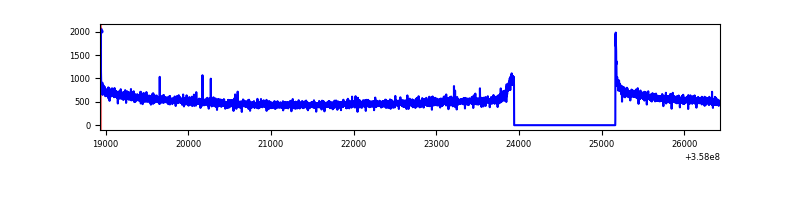 |
| B | 7501 | 6276 | 11 | 11 | 0.15% | 0.18% | 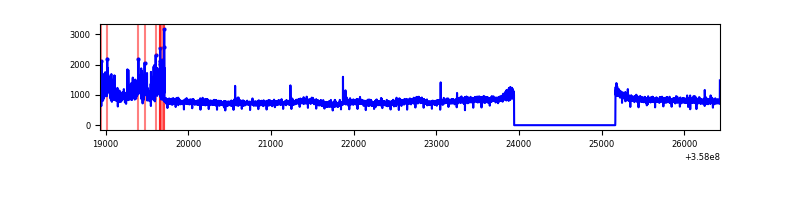 |
| C | 7501 | 6276 | 3 | 3 | 0.04% | 0.05% | 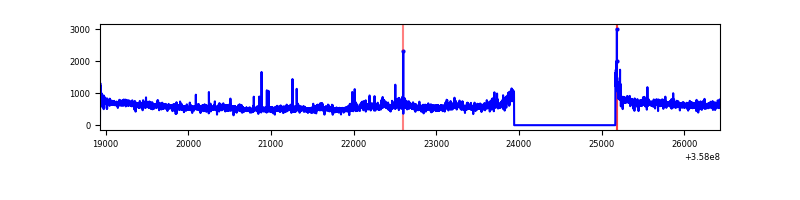 |
| D | 7501 | 6276 | 62 | 62 | 0.83% | 0.99% | 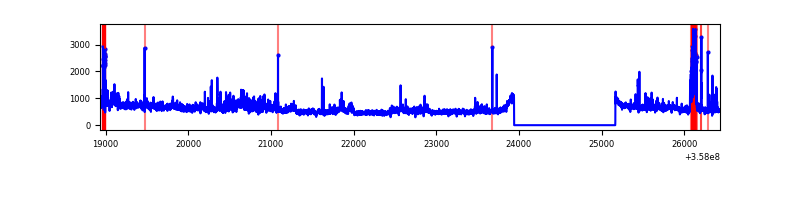 |
Top three noisy pixels from each quadrant. If the there are fewer than three noisy pixels in the level2.evt file, extra rows are filled as -1
| Pixel properties | Quadrant properties | ||||||
|---|---|---|---|---|---|---|---|
| Quadrant | DetID | PixID | Counts | Sigma | Mean | Median | Sigma |
| A | 8 | 192 | 26937 | 154.89 | 844 | 828 | 168.6 |
| A | 13 | 254 | 11930 | 65.86 | 844 | 828 | 168.6 |
| A | 3 | 137 | 8224 | 43.87 | 844 | 828 | 168.6 |
| B | 6 | 159 | 1680424 | 10722.68 | 831 | 812 | 156.6 |
| B | 6 | 36 | 298193 | 1898.49 | 831 | 812 | 156.6 |
| B | 12 | 111 | 18571 | 113.37 | 831 | 812 | 156.6 |
| C | 3 | 233 | 434673 | 2282.51 | 814 | 820 | 190.1 |
| C | 14 | 238 | 131867 | 689.44 | 814 | 820 | 190.1 |
| C | 2 | 114 | 15203 | 75.67 | 814 | 820 | 190.1 |
| D | 8 | 195 | 482063 | 2224.15 | 813 | 799 | 216.4 |
| D | 13 | 249 | 166636 | 766.41 | 813 | 799 | 216.4 |
| D | 1 | 52 | 106651 | 489.19 | 813 | 799 | 216.4 |
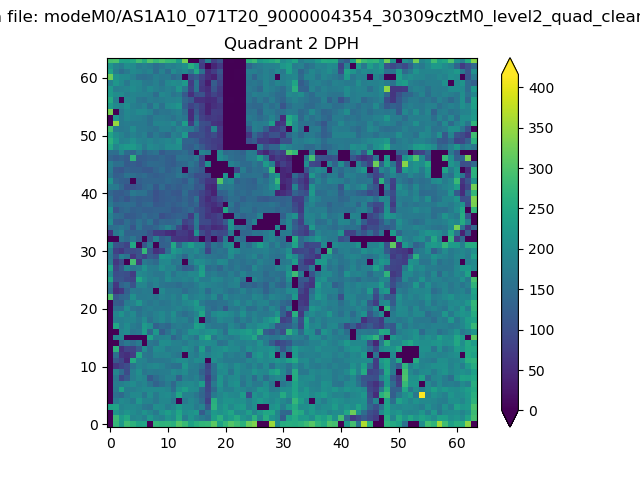
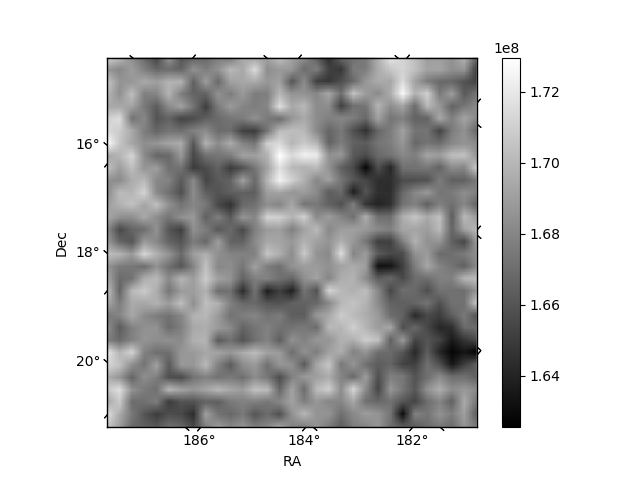
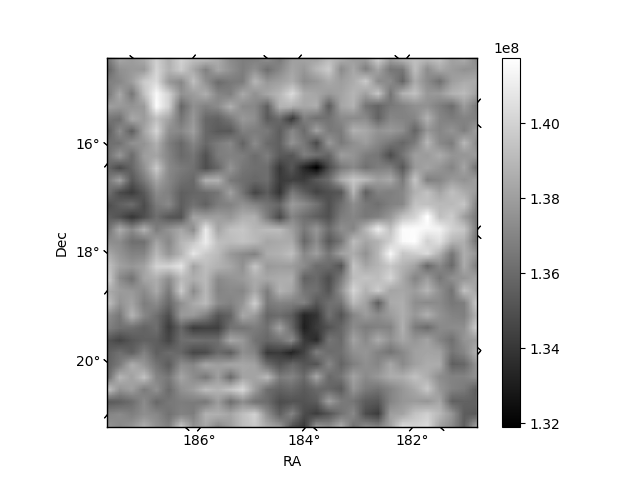
Histogram calculated using DETX and DETY for each event in the final _common_clean file
| Quadrant A | 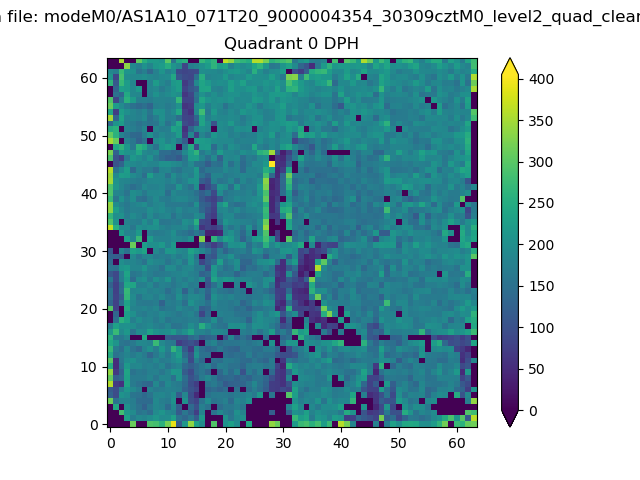 |
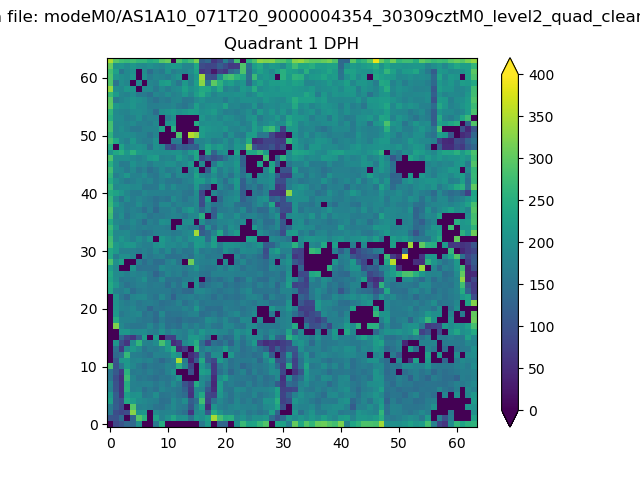 |
Quadrant B |
|---|---|---|---|
| Quadrant D | 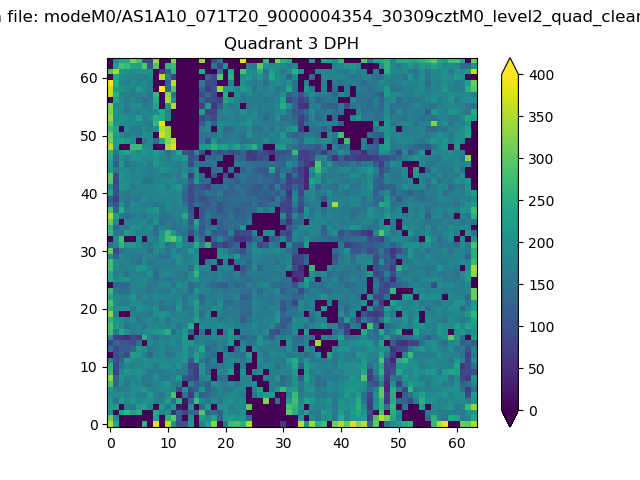 |
 |
Quadrant C |
| Plot type | Count rate plots | Images |
|---|---|---|
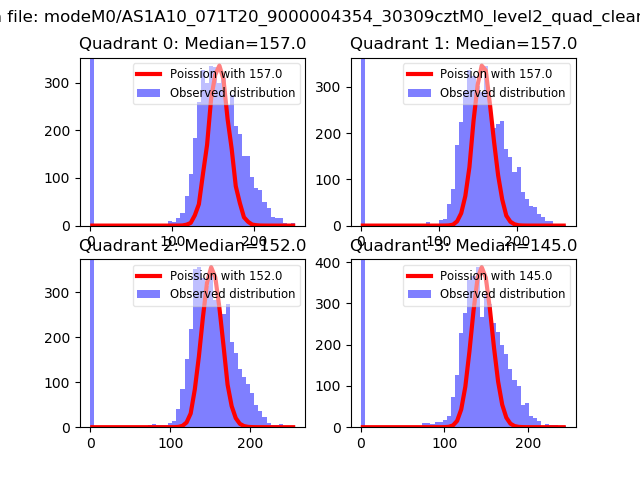
| Comparison with Poisson distribution Blue bars denote a histogram of data divided into 1 sec bins. Red curve is a Poisson curve with rate = median count rate of data. |
 |
 |
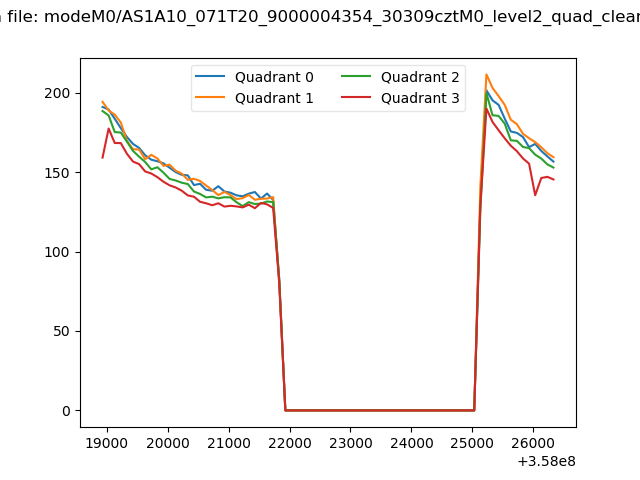
| Quadrant-wise count rates Data is divided into 100 sec bins |
 |
|
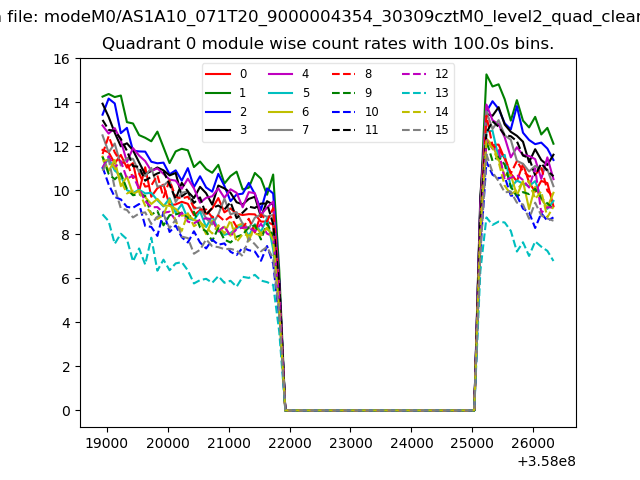
| Module-wise count rates for Quadrant A Data is divided into 100 sec bins |
 |
 |
| Module-wise count rates for Quadrant B Data is divided into 100 sec bins |
 |
 |
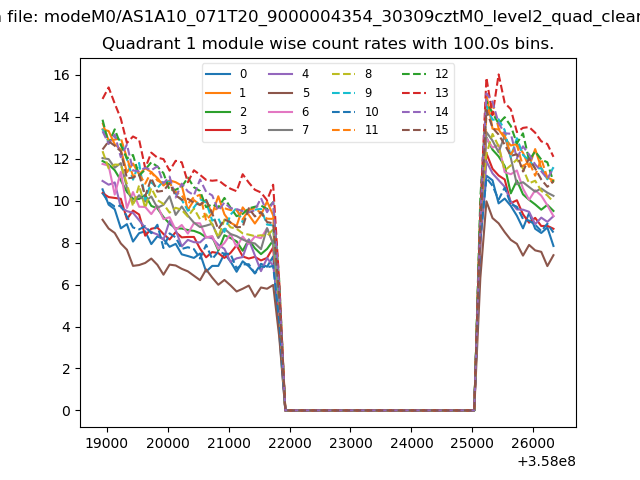
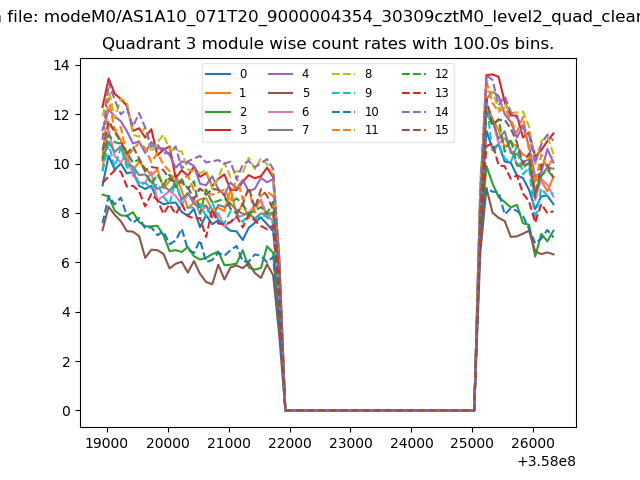
| Module-wise count rates for Quadrant C Data is divided into 100 sec bins |
 |
 |
| Module-wise count rates for Quadrant D Data is divided into 100 sec bins |
 |
 |
| Parameter | Plot |
|---|---|
| CZT HV Monitor | 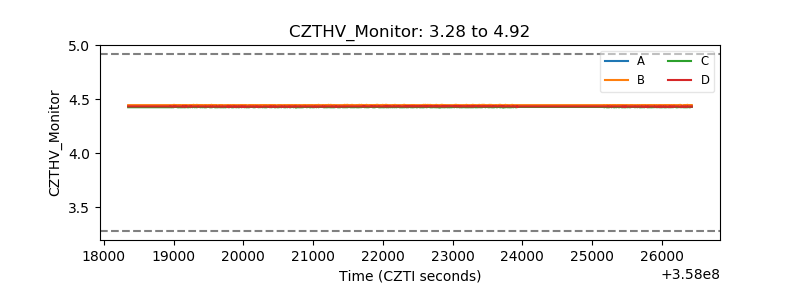 |
| D_VDD | 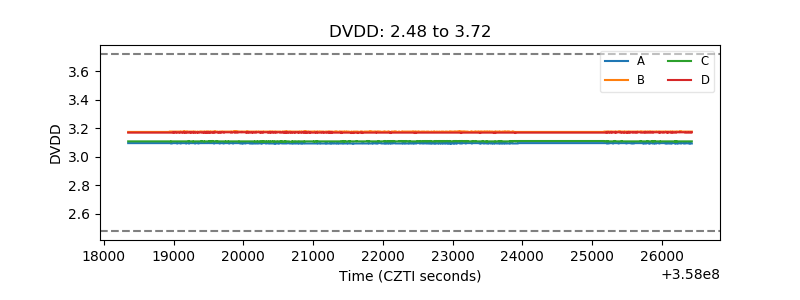 |
| Temperature 1 | 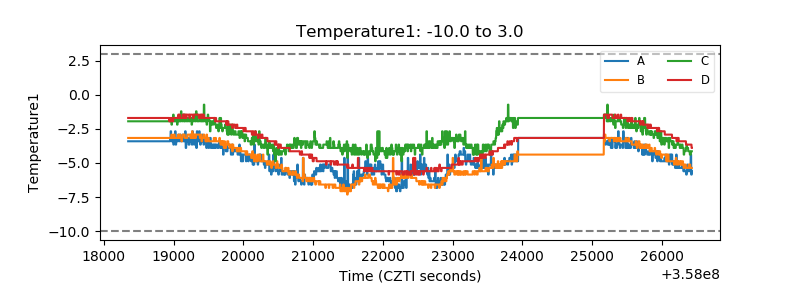 |
| Veto HV Monitor | 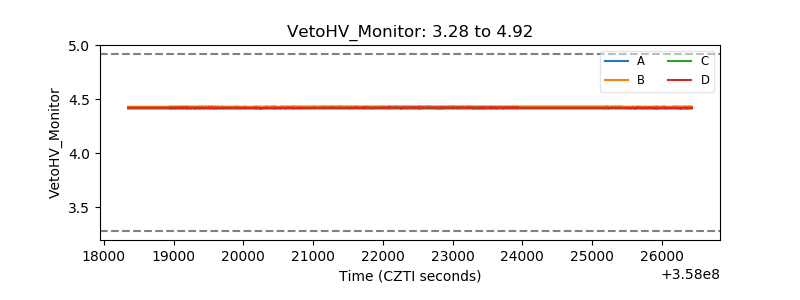 |
| Veto LLD | 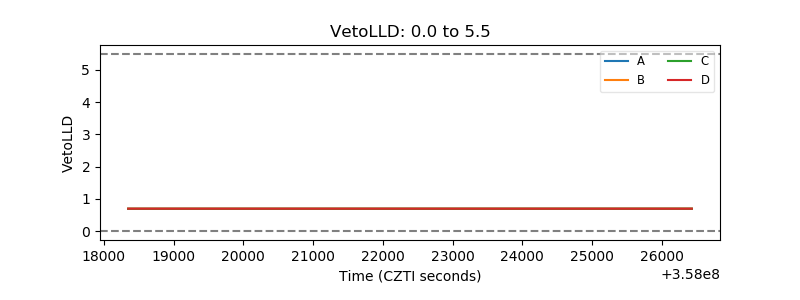 |
| Alpha Counter |  |
| _CPM_Rate |  |
| CZT Counter |  |
| +2.5 Volts monitor |  |
| +5 Volts monitor |  |
| _ROLL_ROT | 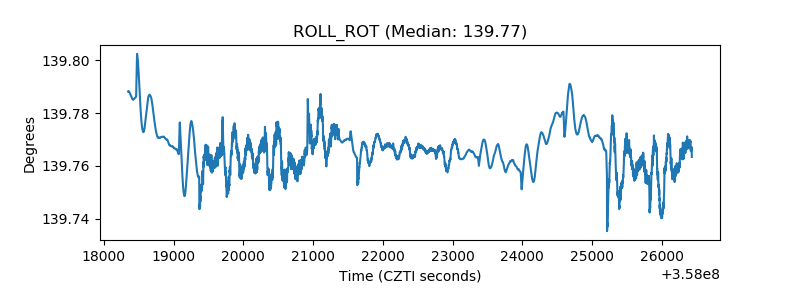 |
| _Roll_DEC |  |
| _Roll_RA | 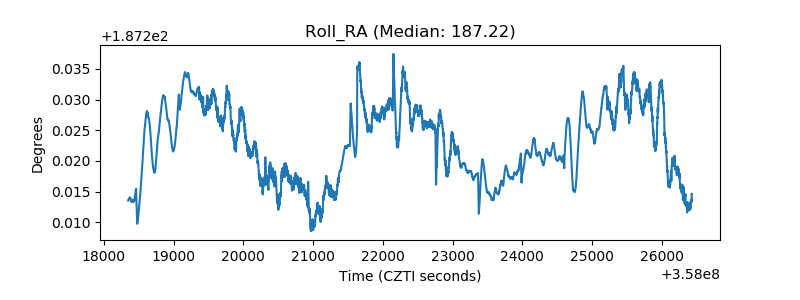 |
| Veto Counter | 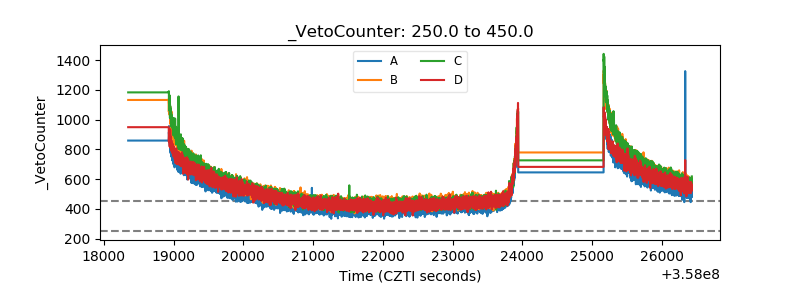 |