| Param | Original file | Final file |
|---|---|---|
| Filename | modeM0/AS1A10_071T20_9000004354_30311cztM0_level2.evt | modeM0/AS1A10_071T20_9000004354_30311cztM0_level2_quad_clean.evt |
| Size (bytes) | 536,664,960 | 93,983,040 |
| Size | 511.8 MB | 89.6 MB |
| Events in quadrant A | 3,212,143 | 623,288 |
| Events in quadrant B | 5,066,381 | 631,267 |
| Events in quadrant C | 3,838,545 | 594,611 |
| Events in quadrant D | 3,724,789 | 572,802 |
| Mode SS | |||
|---|---|---|---|
| Quadrant | BADHDUFLAG | Total packets | Discarded packets |
| A | 0 | 124 | 0 |
| B | 0 | 124 | 0 |
| C | 0 | 124 | 0 |
| D | 0 | 124 | 0 |
| Mode M0 | |||
|---|---|---|---|
| Quadrant | BADHDUFLAG | Total packets | Discarded packets |
| A | 0 | 13221 | 2 |
| B | 0 | 18887 | 5 |
| C | 0 | 15468 | 2 |
| D | 0 | 15152 | 2 |
| Mode M9 | |||
|---|---|---|---|
| Quadrant | BADHDUFLAG | Total packets | Discarded packets |
| A | 0 | 14 | 0 |
| B | 0 | 14 | 0 |
| C | 0 | 14 | 0 |
| D | 0 | 14 | 0 |
| Quadrant | Total seconds | Saturated seconds | Saturation percentage |
|---|---|---|---|
| A | 6071 | 70 | 1.153023% |
| B | 6071 | 111 | 1.828364% |
| C | 6071 | 161 | 2.651952% |
| D | 6071 | 145 | 2.388404% |
Noise dominated data is calculated using 1-second bins in cleaned event files. If a bin has >2000 counts, and if more than 50% of those come from <1% of pixels, then it is considered to be noise-dominated and hence unusable.
| Quadrant | # 1 sec bins | Bins with >0 counts | Bins with >2000 counts | High rate bins dominated by noise | Noise dominated (total time) | Noise dominated (detector-on time) | Marked lightcurve |
|---|---|---|---|---|---|---|---|
| A | 7456 | 6072 | 4 | 4 | 0.05% | 0.07% | 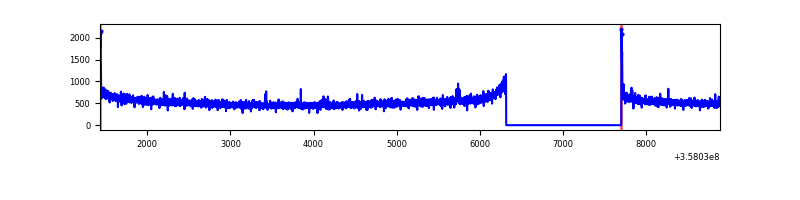 |
| B | 7456 | 6072 | 11 | 11 | 0.15% | 0.18% | 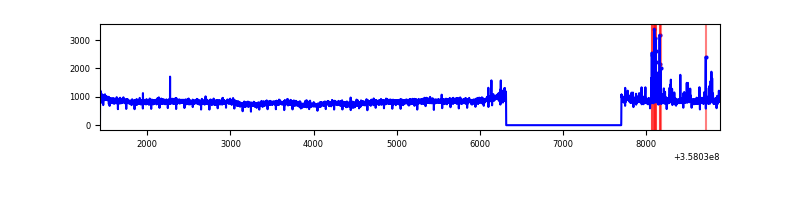 |
| C | 7456 | 6072 | 9 | 9 | 0.12% | 0.15% | 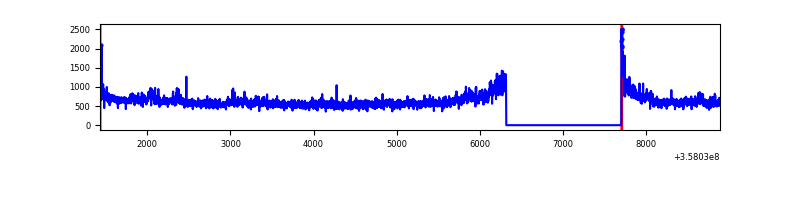 |
| D | 7456 | 6072 | 117 | 117 | 1.57% | 1.93% | 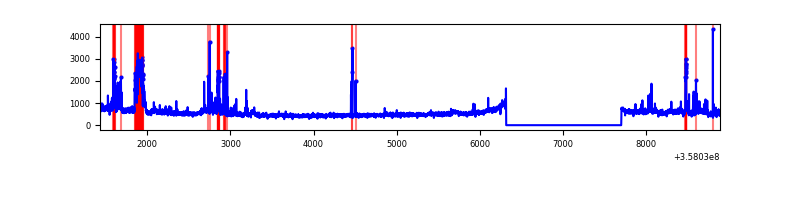 |
Top three noisy pixels from each quadrant. If the there are fewer than three noisy pixels in the level2.evt file, extra rows are filled as -1
| Pixel properties | Quadrant properties | ||||||
|---|---|---|---|---|---|---|---|
| Quadrant | DetID | PixID | Counts | Sigma | Mean | Median | Sigma |
| A | 14 | 239 | 29175 | 175.22 | 817 | 803 | 161.9 |
| A | 8 | 192 | 28153 | 168.91 | 817 | 803 | 161.9 |
| A | 13 | 254 | 10517 | 59.99 | 817 | 803 | 161.9 |
| B | 6 | 159 | 1761253 | 11344.71 | 813 | 794 | 155.2 |
| B | 6 | 36 | 82572 | 526.99 | 813 | 794 | 155.2 |
| B | 15 | 185 | 27885 | 174.58 | 813 | 794 | 155.2 |
| C | 3 | 233 | 628557 | 3465.62 | 782 | 787 | 181.1 |
| C | 14 | 238 | 128106 | 702.87 | 782 | 787 | 181.1 |
| C | 0 | 10 | 18919 | 100.1 | 782 | 787 | 181.1 |
| D | 13 | 249 | 341419 | 1731.28 | 773 | 758 | 196.8 |
| D | 13 | 104 | 169428 | 857.2 | 773 | 758 | 196.8 |
| D | 8 | 195 | 144003 | 727.99 | 773 | 758 | 196.8 |
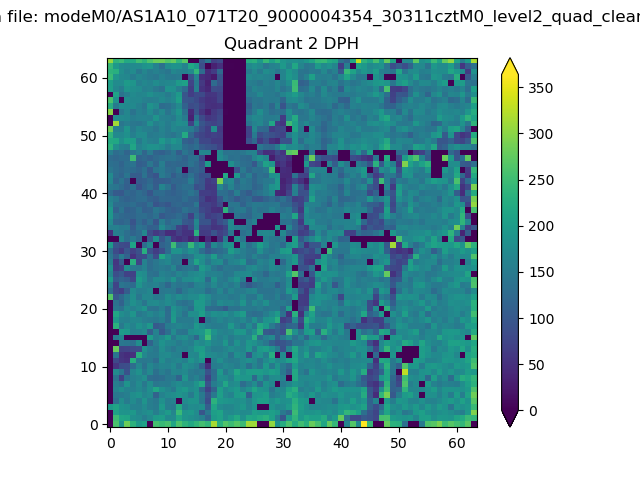
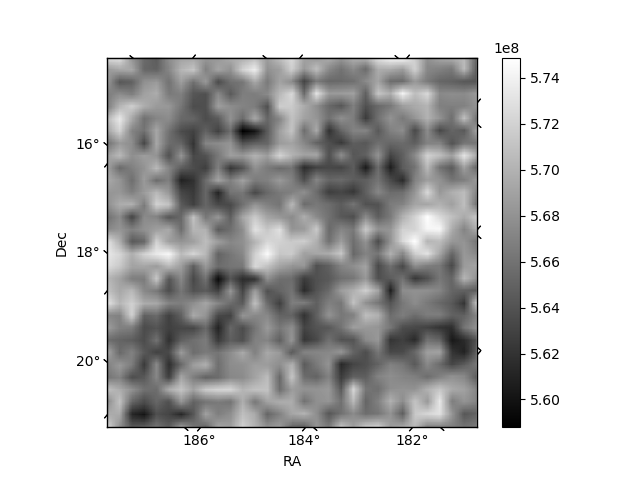
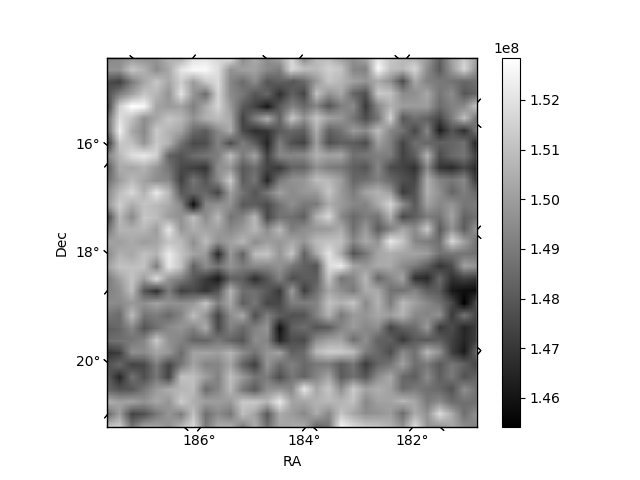
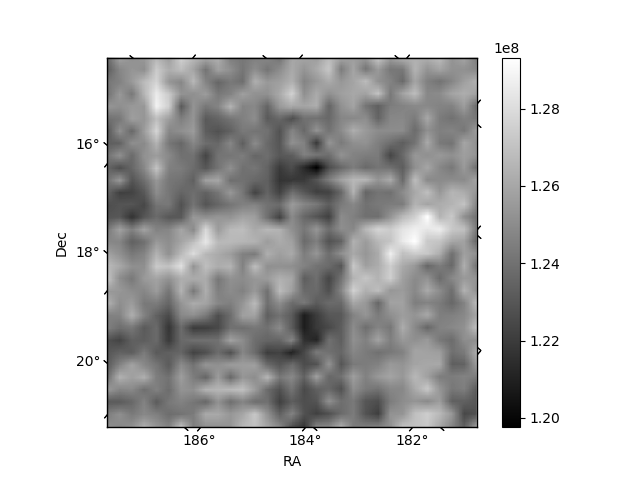
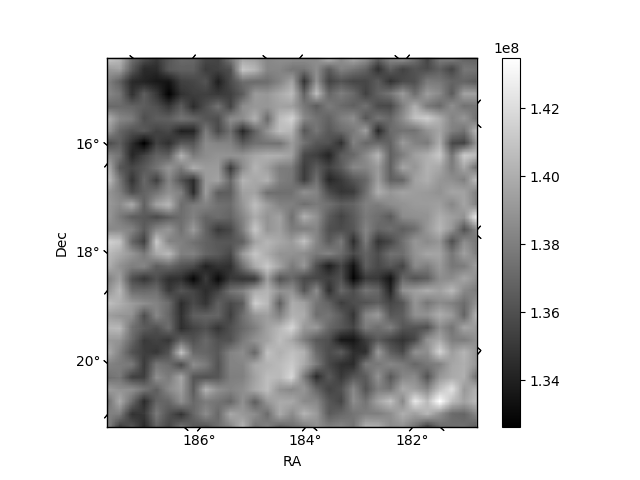
Histogram calculated using DETX and DETY for each event in the final _common_clean file
| Quadrant A | 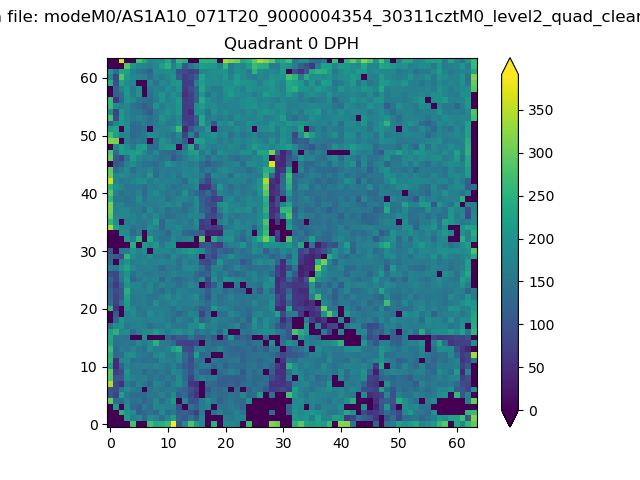 |
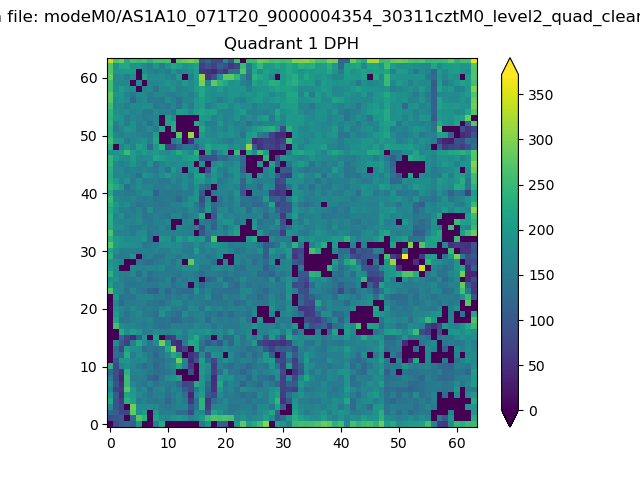 |
Quadrant B |
|---|---|---|---|
| Quadrant D | 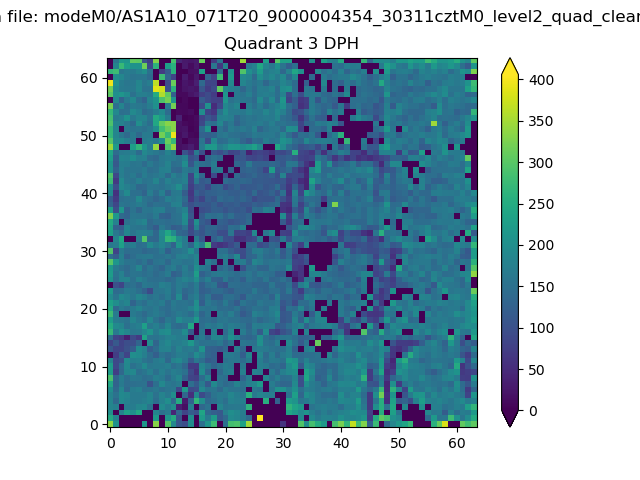 |
 |
Quadrant C |
| Plot type | Count rate plots | Images |
|---|---|---|
| Comparison with Poisson distribution Blue bars denote a histogram of data divided into 1 sec bins. Red curve is a Poisson curve with rate = median count rate of data. |
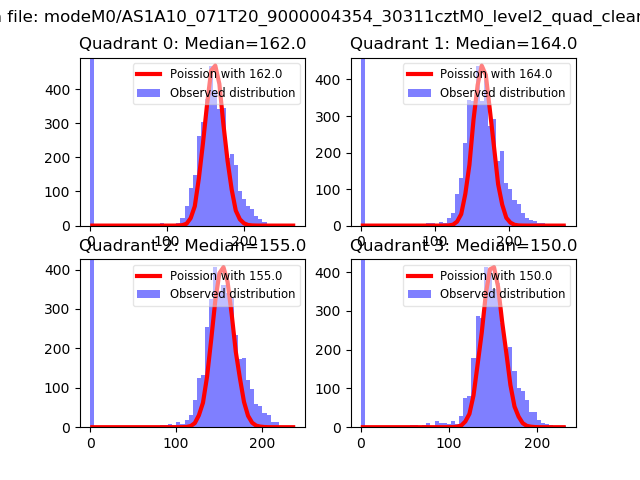 |
 |
| Quadrant-wise count rates Data is divided into 100 sec bins |
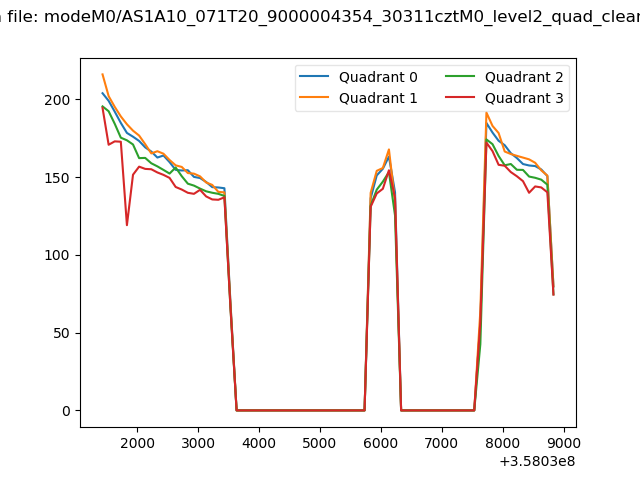 |
|
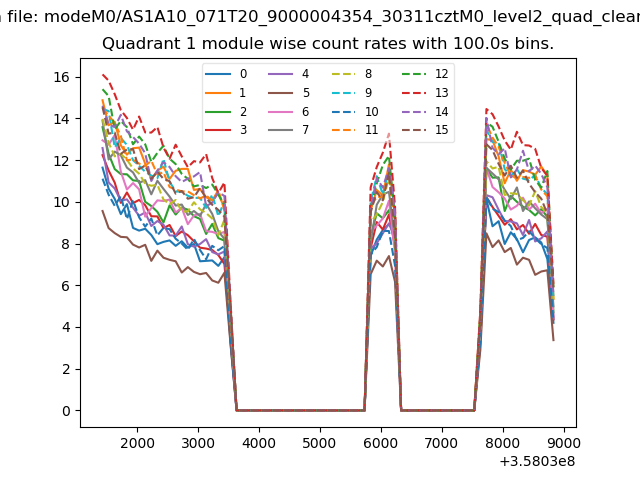
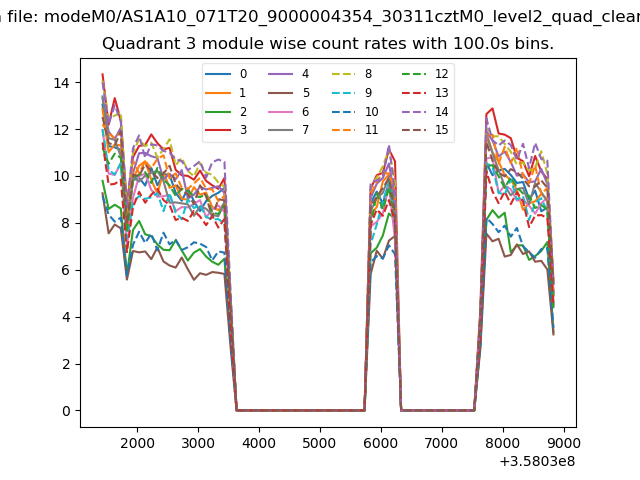
| Module-wise count rates for Quadrant A Data is divided into 100 sec bins |
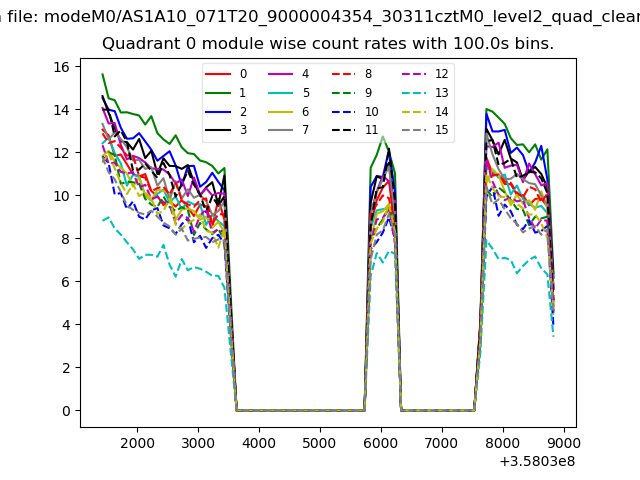 |
 |
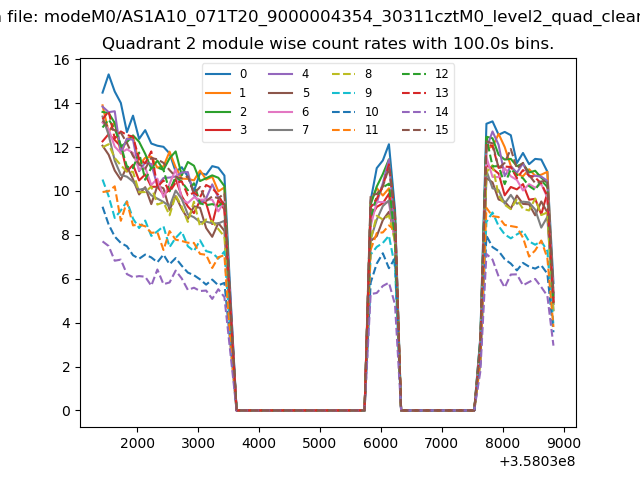
| Module-wise count rates for Quadrant B Data is divided into 100 sec bins |
 |
 |
| Module-wise count rates for Quadrant C Data is divided into 100 sec bins |
 |
 |
| Module-wise count rates for Quadrant D Data is divided into 100 sec bins |
 |
 |
| Parameter | Plot |
|---|---|
| CZT HV Monitor | 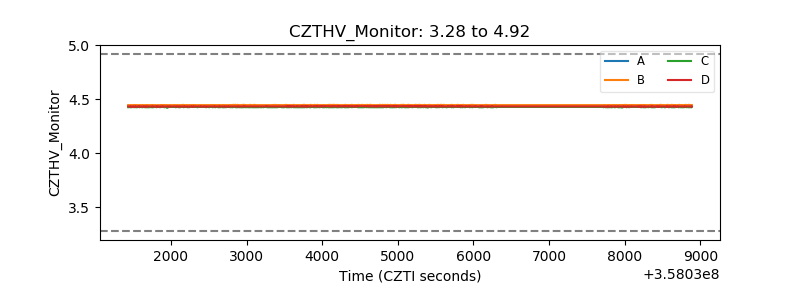 |
| D_VDD |  |
| Temperature 1 |  |
| Veto HV Monitor | 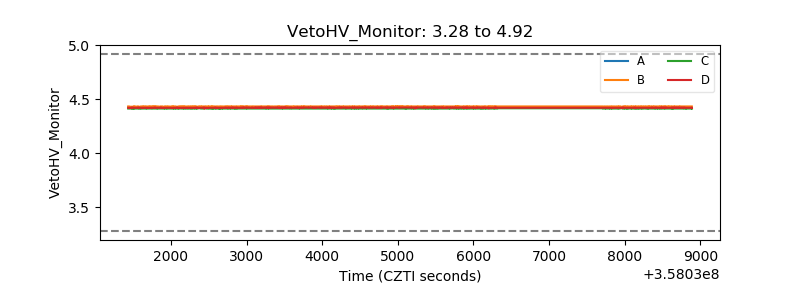 |
| Veto LLD | 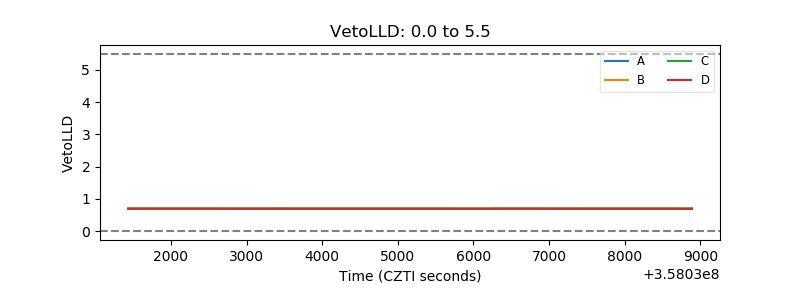 |
| Alpha Counter | 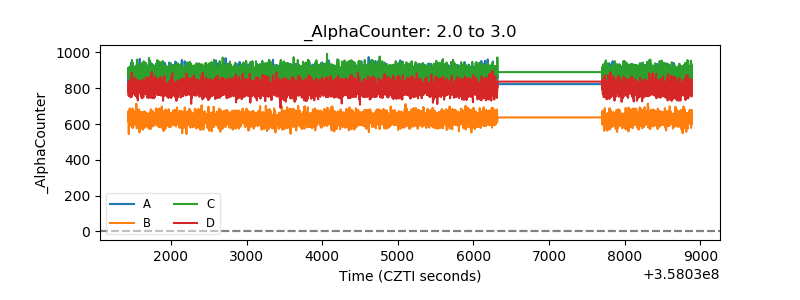 |
| _CPM_Rate | 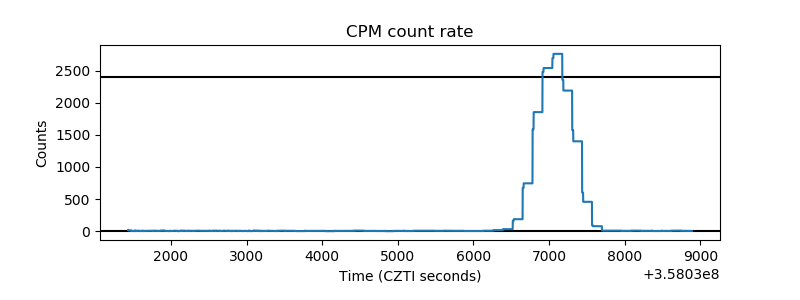 |
| CZT Counter | 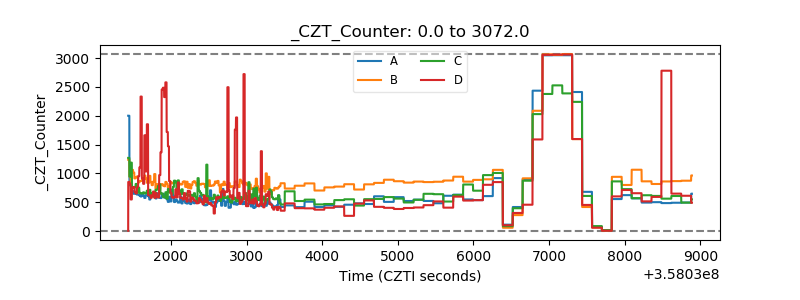 |
| +2.5 Volts monitor |  |
| +5 Volts monitor | 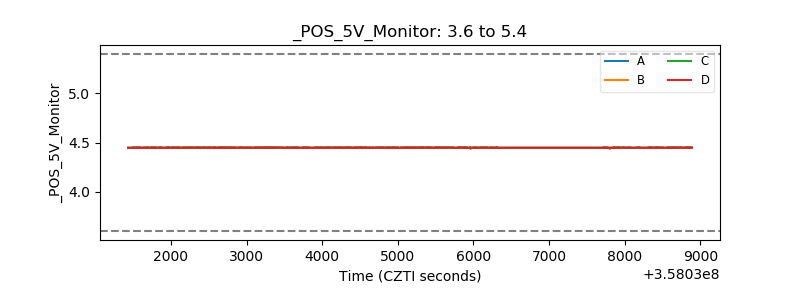 |
| _ROLL_ROT | 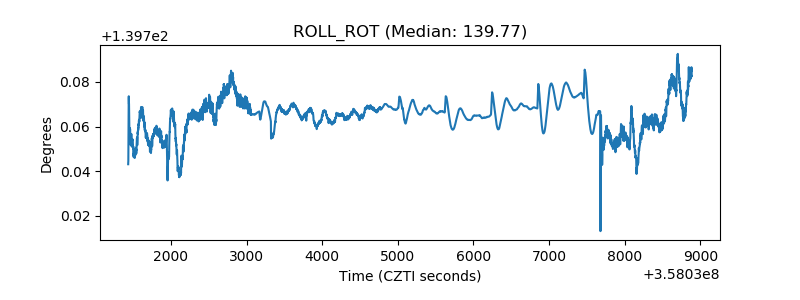 |
| _Roll_DEC | 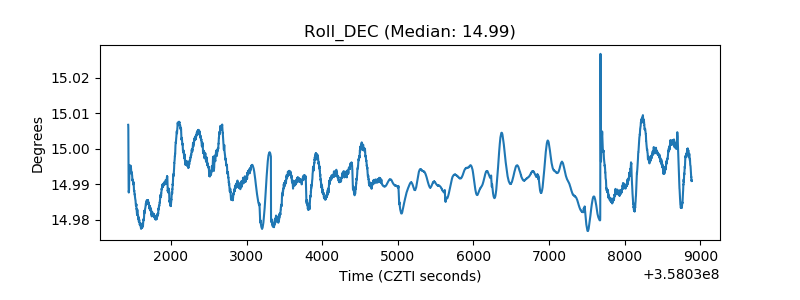 |
| _Roll_RA | 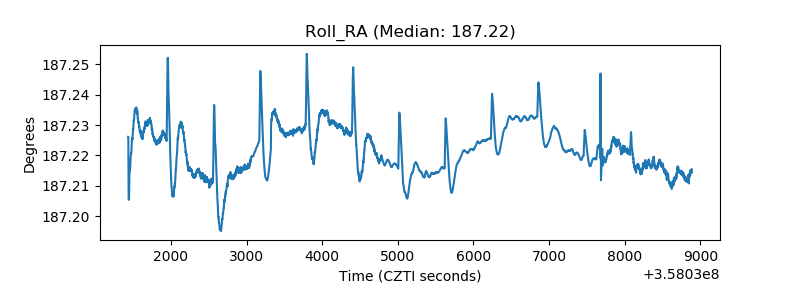 |
| Veto Counter | 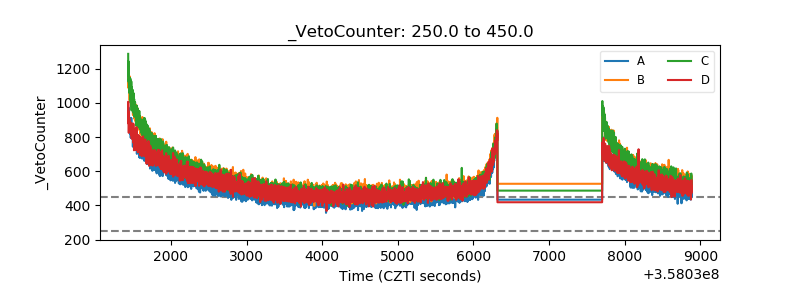 |