| Param | Original file | Final file |
|---|---|---|
| Filename | modeM0/AS1A10_071T20_9000004354_30312cztM0_level2.evt | modeM0/AS1A10_071T20_9000004354_30312cztM0_level2_quad_clean.evt |
| Size (bytes) | 556,945,920 | 92,859,840 |
| Size | 531.1 MB | 88.6 MB |
| Events in quadrant A | 3,286,107 | 608,836 |
| Events in quadrant B | 5,251,827 | 617,540 |
| Events in quadrant C | 4,487,056 | 576,828 |
| Events in quadrant D | 3,417,063 | 570,399 |
| Mode SS | |||
|---|---|---|---|
| Quadrant | BADHDUFLAG | Total packets | Discarded packets |
| A | 0 | 128 | 0 |
| B | 0 | 128 | 0 |
| C | 0 | 128 | 0 |
| D | 0 | 128 | 0 |
| Mode M0 | |||
|---|---|---|---|
| Quadrant | BADHDUFLAG | Total packets | Discarded packets |
| A | 0 | 13575 | 2 |
| B | 0 | 19651 | 2 |
| C | 0 | 17530 | 2 |
| D | 0 | 14230 | 2 |
| Mode M9 | |||
|---|---|---|---|
| Quadrant | BADHDUFLAG | Total packets | Discarded packets |
| A | 0 | 24 | 0 |
| B | 0 | 25 | 0 |
| C | 0 | 25 | 0 |
| D | 0 | 25 | 0 |
| Quadrant | Total seconds | Saturated seconds | Saturation percentage |
|---|---|---|---|
| A | 6282 | 32 | 0.509392% |
| B | 6282 | 74 | 1.177969% |
| C | 6282 | 204 | 3.247373% |
| D | 6282 | 31 | 0.493473% |
Noise dominated data is calculated using 1-second bins in cleaned event files. If a bin has >2000 counts, and if more than 50% of those come from <1% of pixels, then it is considered to be noise-dominated and hence unusable.
| Quadrant | # 1 sec bins | Bins with >0 counts | Bins with >2000 counts | High rate bins dominated by noise | Noise dominated (total time) | Noise dominated (detector-on time) | Marked lightcurve |
|---|---|---|---|---|---|---|---|
| A | 7612 | 6283 | 3 | 3 | 0.04% | 0.05% | 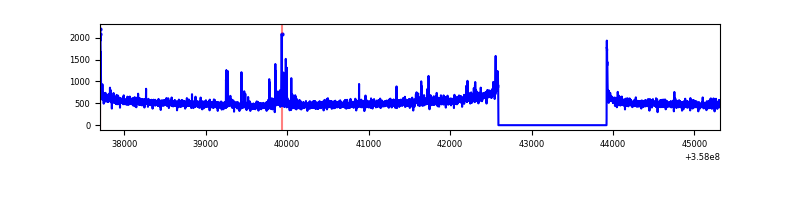 |
| B | 7612 | 6283 | 15 | 15 | 0.20% | 0.24% | 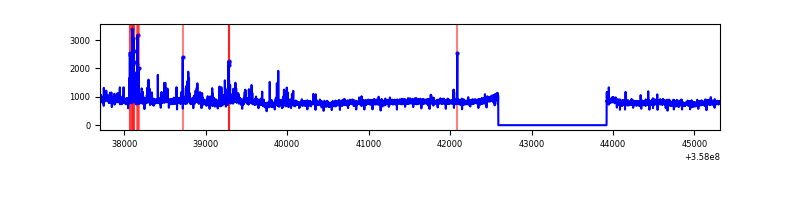 |
| C | 7612 | 6283 | 11 | 11 | 0.14% | 0.18% | 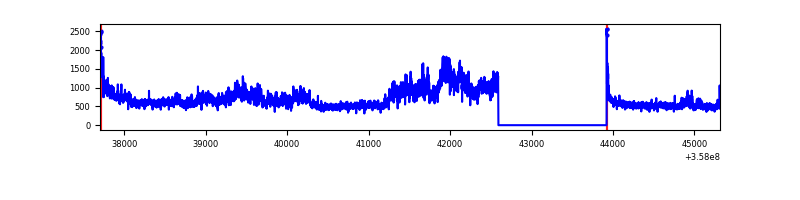 |
| D | 7612 | 6283 | 17 | 17 | 0.22% | 0.27% | 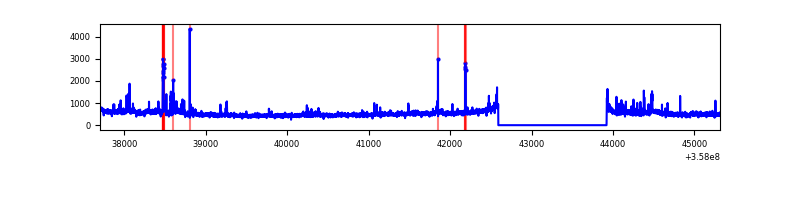 |
Top three noisy pixels from each quadrant. If the there are fewer than three noisy pixels in the level2.evt file, extra rows are filled as -1
| Pixel properties | Quadrant properties | ||||||
|---|---|---|---|---|---|---|---|
| Quadrant | DetID | PixID | Counts | Sigma | Mean | Median | Sigma |
| A | 14 | 239 | 116783 | 715.96 | 814 | 800 | 162.0 |
| A | 8 | 192 | 25510 | 152.53 | 814 | 800 | 162.0 |
| A | 13 | 254 | 11294 | 64.78 | 814 | 800 | 162.0 |
| B | 6 | 159 | 1808553 | 11761.87 | 809 | 790 | 153.7 |
| B | 6 | 36 | 228981 | 1484.68 | 809 | 790 | 153.7 |
| B | 15 | 185 | 27871 | 176.2 | 809 | 790 | 153.7 |
| C | 3 | 233 | 1298701 | 7153.48 | 776 | 783 | 181.4 |
| C | 14 | 238 | 128189 | 702.2 | 776 | 783 | 181.4 |
| C | 0 | 10 | 23821 | 126.97 | 776 | 783 | 181.4 |
| D | 8 | 195 | 185434 | 915.73 | 771 | 757 | 201.7 |
| D | 13 | 104 | 86011 | 422.74 | 771 | 757 | 201.7 |
| D | 5 | 222 | 80747 | 396.63 | 771 | 757 | 201.7 |
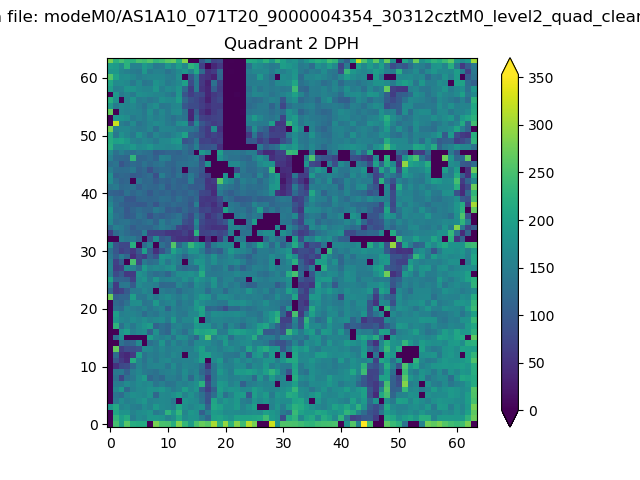
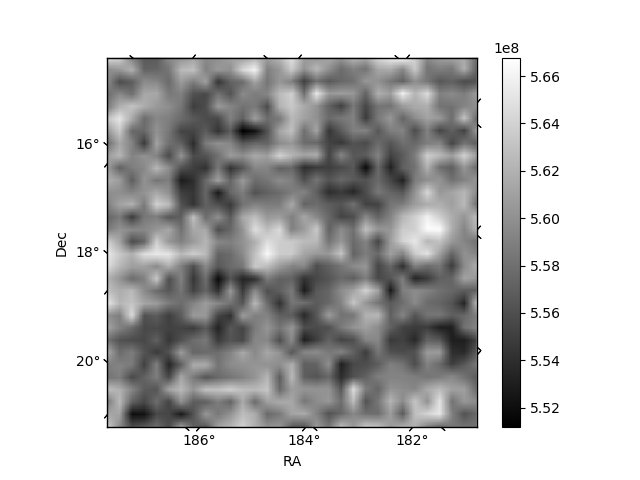
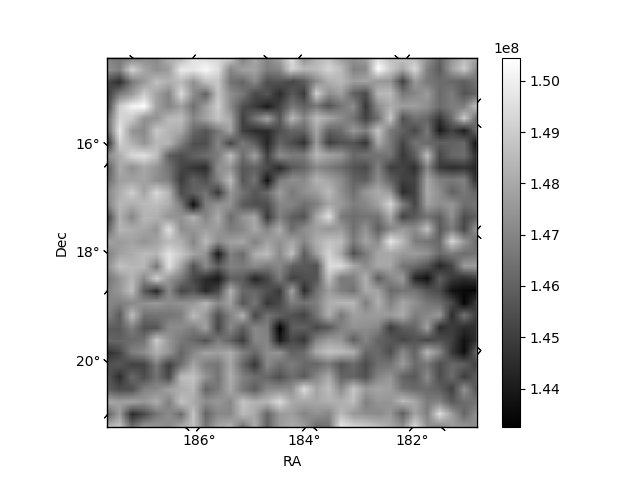
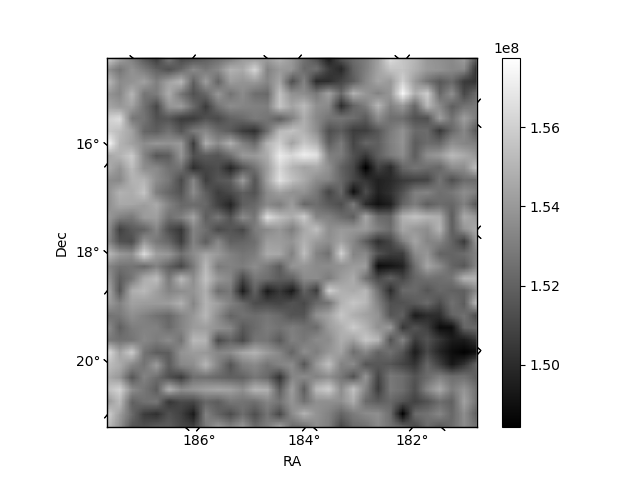
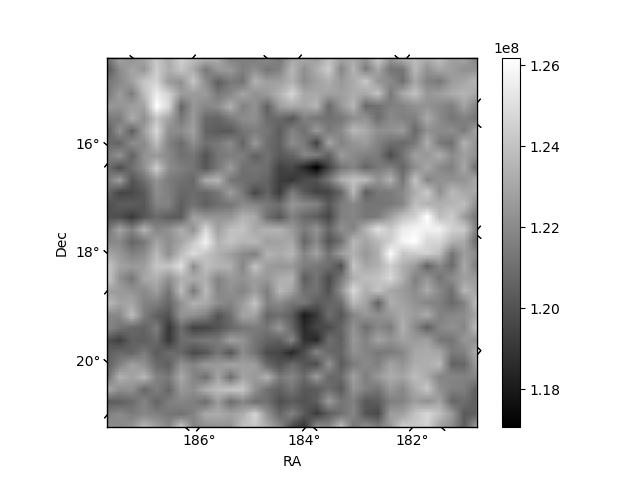
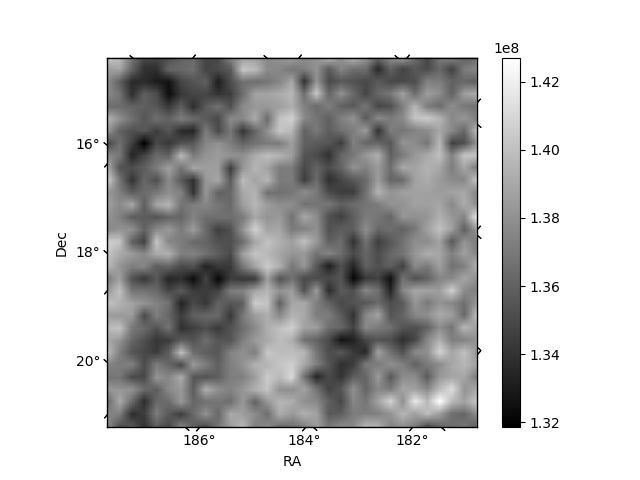
Histogram calculated using DETX and DETY for each event in the final _common_clean file
| Quadrant A | 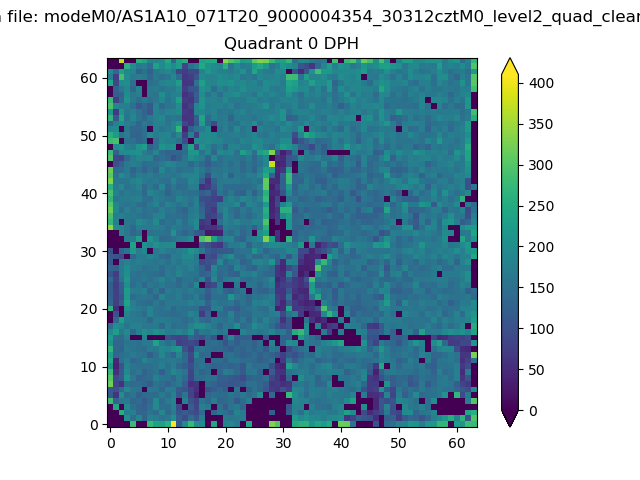 |
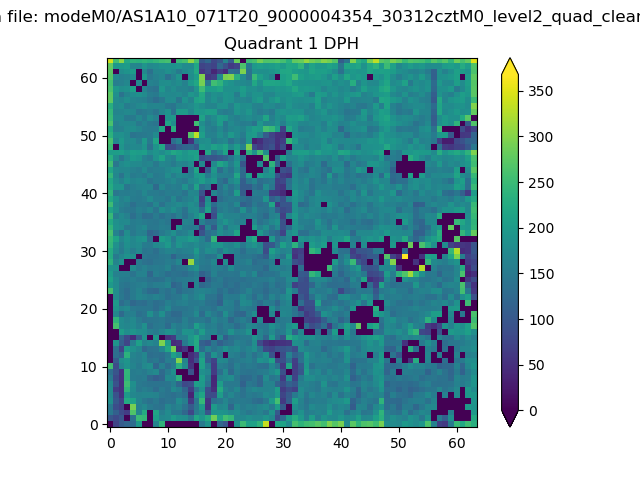 |
Quadrant B |
|---|---|---|---|
| Quadrant D | 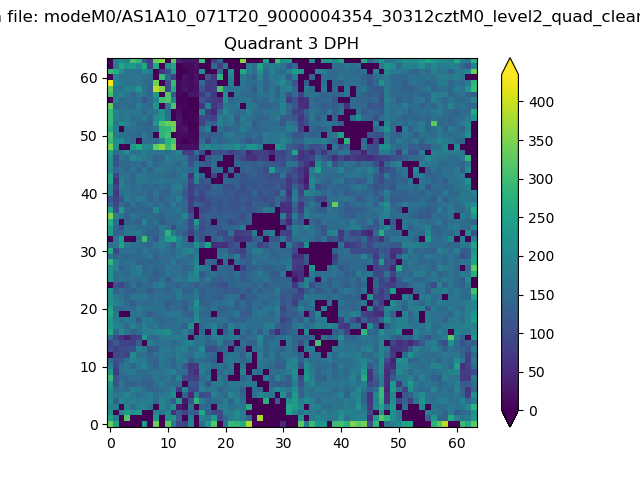 |
 |
Quadrant C |
| Plot type | Count rate plots | Images |
|---|---|---|
| Comparison with Poisson distribution Blue bars denote a histogram of data divided into 1 sec bins. Red curve is a Poisson curve with rate = median count rate of data. |
 |
 |
| Quadrant-wise count rates Data is divided into 100 sec bins |
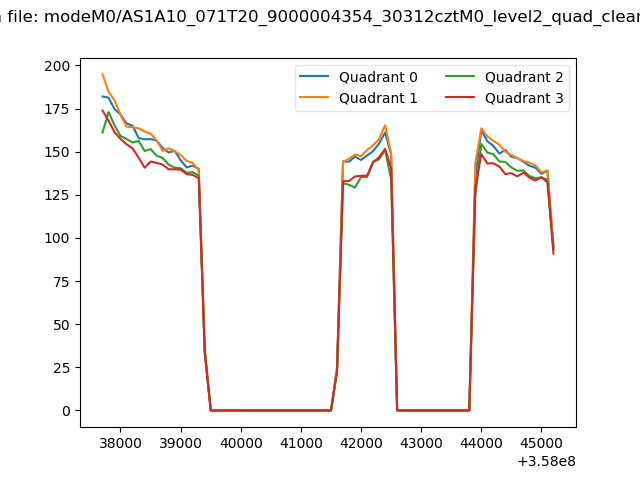 |
|
| Module-wise count rates for Quadrant A Data is divided into 100 sec bins |
 |
 |
| Module-wise count rates for Quadrant B Data is divided into 100 sec bins |
 |
 |
| Module-wise count rates for Quadrant C Data is divided into 100 sec bins |
 |
 |
| Module-wise count rates for Quadrant D Data is divided into 100 sec bins |
 |
 |
| Parameter | Plot |
|---|---|
| CZT HV Monitor |  |
| D_VDD | 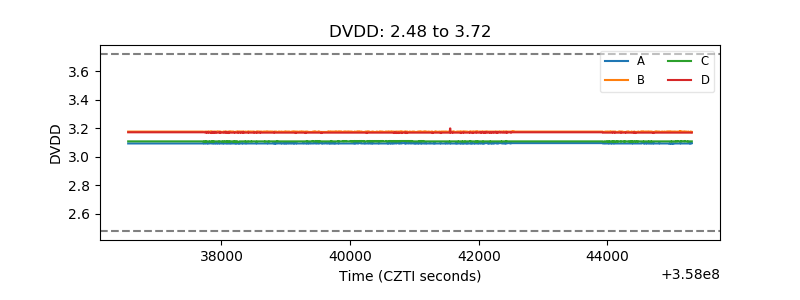 |
| Temperature 1 | 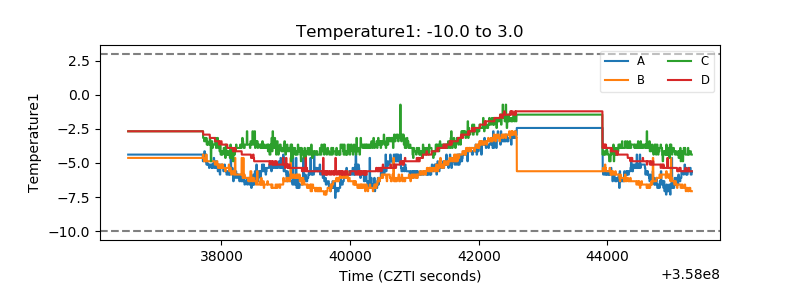 |
| Veto HV Monitor | 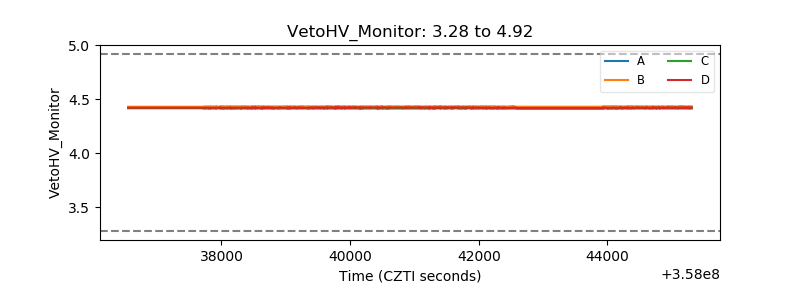 |
| Veto LLD | 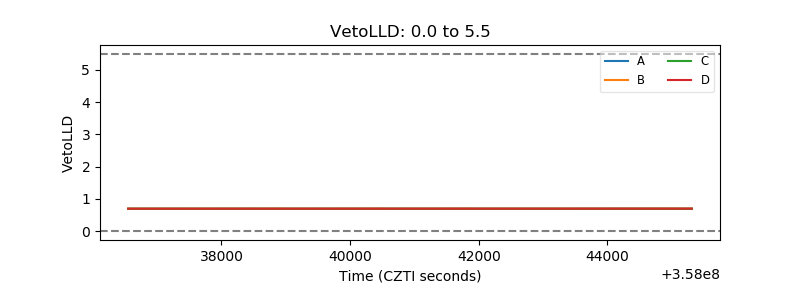 |
| Alpha Counter | 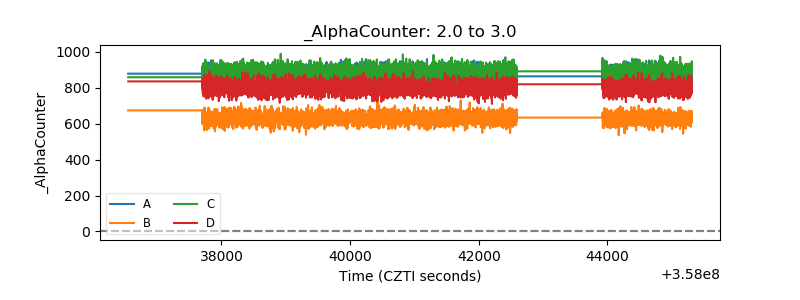 |
| _CPM_Rate | 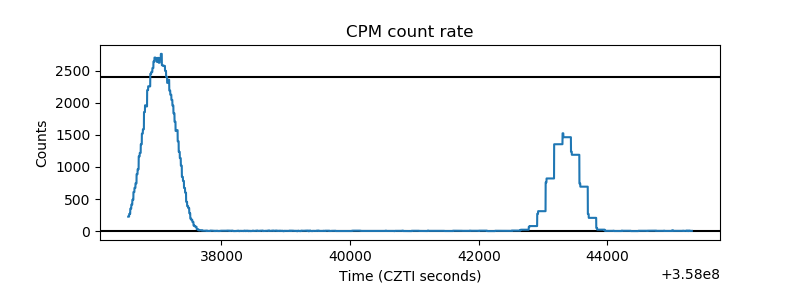 |
| CZT Counter | 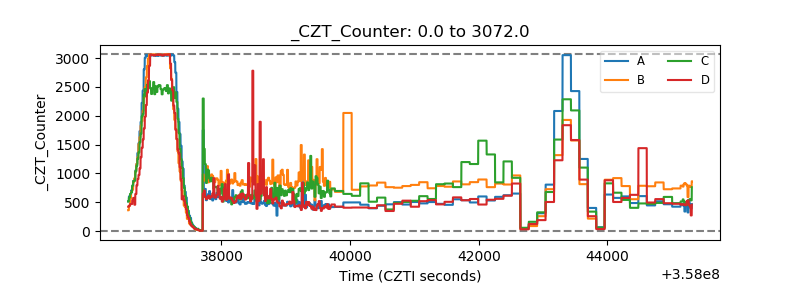 |
| +2.5 Volts monitor |  |
| +5 Volts monitor |  |
| _ROLL_ROT |  |
| _Roll_DEC |  |
| _Roll_RA | 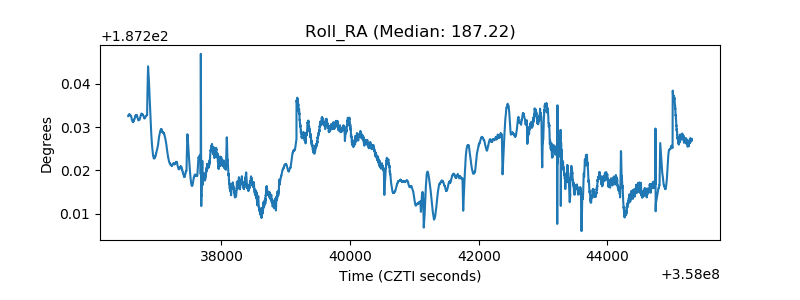 |
| Veto Counter |  |