| Param | Original file | Final file |
|---|---|---|
| Filename | modeM0/AS1A10_071T20_9000004354_30313cztM0_level2.evt | modeM0/AS1A10_071T20_9000004354_30313cztM0_level2_quad_clean.evt |
| Size (bytes) | 555,252,480 | 90,406,080 |
| Size | 529.5 MB | 86.2 MB |
| Events in quadrant A | 3,361,212 | 580,642 |
| Events in quadrant B | 5,690,851 | 583,176 |
| Events in quadrant C | 3,776,874 | 556,339 |
| Events in quadrant D | 3,530,701 | 547,885 |
| Mode SS | |||
|---|---|---|---|
| Quadrant | BADHDUFLAG | Total packets | Discarded packets |
| A | 0 | 138 | 0 |
| B | 0 | 138 | 0 |
| C | 0 | 138 | 0 |
| D | 0 | 138 | 0 |
| Mode M0 | |||
|---|---|---|---|
| Quadrant | BADHDUFLAG | Total packets | Discarded packets |
| A | 0 | 14183 | 2 |
| B | 0 | 21603 | 2 |
| C | 0 | 15262 | 2 |
| D | 0 | 14923 | 2 |
| Mode M9 | |||
|---|---|---|---|
| Quadrant | BADHDUFLAG | Total packets | Discarded packets |
| A | 0 | 24 | 0 |
| B | 0 | 24 | 0 |
| C | 0 | 24 | 0 |
| D | 0 | 24 | 0 |
| Quadrant | Total seconds | Saturated seconds | Saturation percentage |
|---|---|---|---|
| A | 6739 | 61 | 0.905179% |
| B | 6740 | 215 | 3.189911% |
| C | 6740 | 171 | 2.537092% |
| D | 6740 | 61 | 0.905045% |
Noise dominated data is calculated using 1-second bins in cleaned event files. If a bin has >2000 counts, and if more than 50% of those come from <1% of pixels, then it is considered to be noise-dominated and hence unusable.
| Quadrant | # 1 sec bins | Bins with >0 counts | Bins with >2000 counts | High rate bins dominated by noise | Noise dominated (total time) | Noise dominated (detector-on time) | Marked lightcurve |
|---|---|---|---|---|---|---|---|
| A | 9079 | 6741 | 0 | 0 | 0.00% | 0.00% | 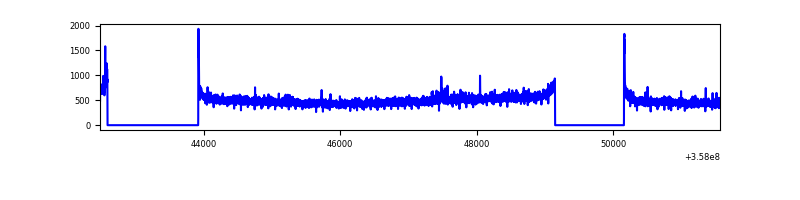 |
| B | 9080 | 6742 | 48 | 48 | 0.53% | 0.71% | 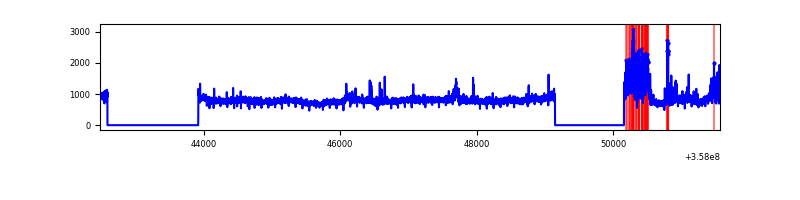 |
| C | 9080 | 6742 | 8 | 8 | 0.09% | 0.12% | 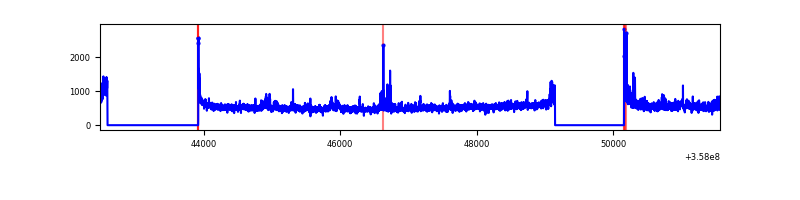 |
| D | 9080 | 6742 | 34 | 34 | 0.37% | 0.50% | 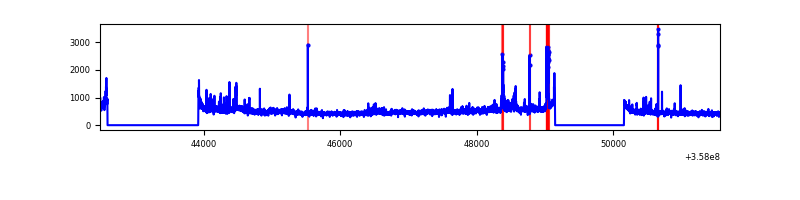 |
Top three noisy pixels from each quadrant. If the there are fewer than three noisy pixels in the level2.evt file, extra rows are filled as -1
| Pixel properties | Quadrant properties | ||||||
|---|---|---|---|---|---|---|---|
| Quadrant | DetID | PixID | Counts | Sigma | Mean | Median | Sigma |
| A | 14 | 239 | 44340 | 254.37 | 854 | 837 | 171.0 |
| A | 8 | 192 | 22358 | 125.84 | 854 | 837 | 171.0 |
| A | 13 | 254 | 11356 | 61.51 | 854 | 837 | 171.0 |
| B | 6 | 159 | 1876227 | 11521.13 | 847 | 825 | 162.8 |
| B | 6 | 36 | 476699 | 2923.43 | 847 | 825 | 162.8 |
| B | 12 | 111 | 20369 | 120.06 | 847 | 825 | 162.8 |
| C | 3 | 233 | 421454 | 2197.8 | 817 | 823 | 191.4 |
| C | 14 | 238 | 136772 | 710.33 | 817 | 823 | 191.4 |
| C | 0 | 10 | 16520 | 82.02 | 817 | 823 | 191.4 |
| D | 8 | 195 | 142301 | 675.73 | 813 | 796 | 209.4 |
| D | 13 | 249 | 82225 | 388.85 | 813 | 796 | 209.4 |
| D | 5 | 222 | 64104 | 302.31 | 813 | 796 | 209.4 |
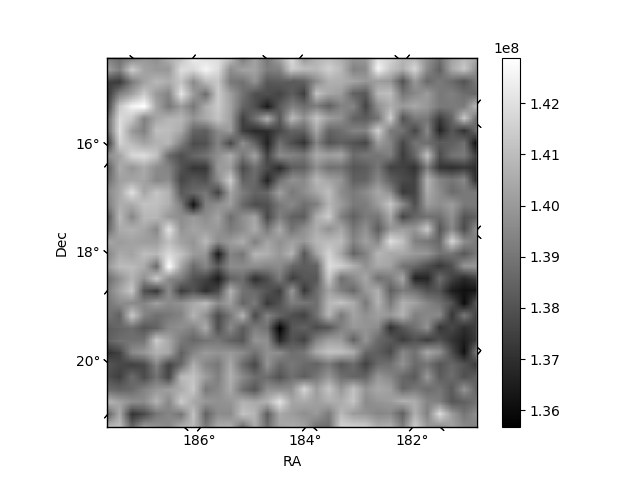
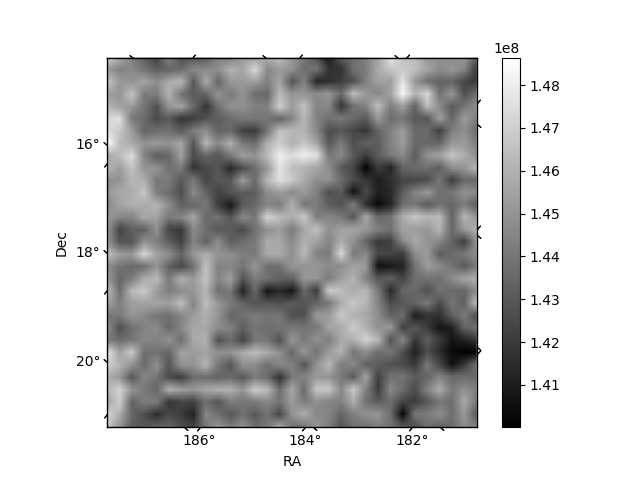
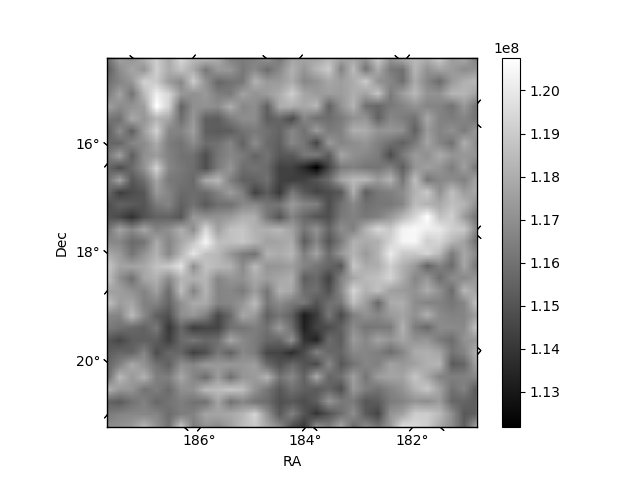
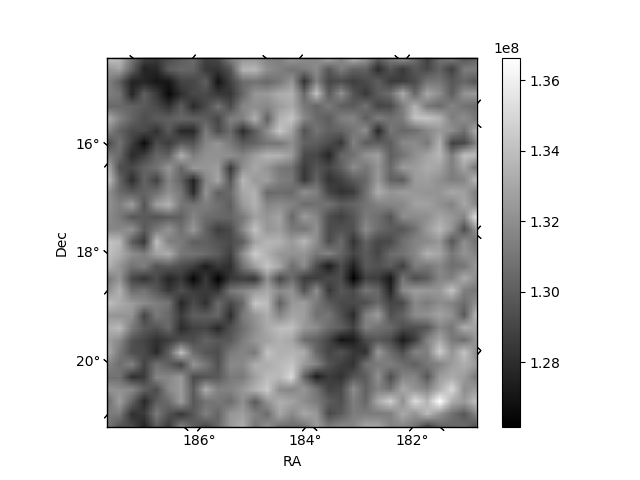
Histogram calculated using DETX and DETY for each event in the final _common_clean file
| Quadrant A | 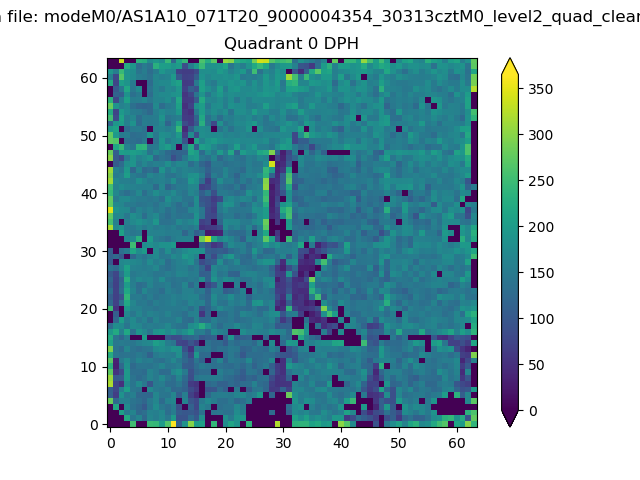 |
 |
Quadrant B |
|---|---|---|---|
| Quadrant D | 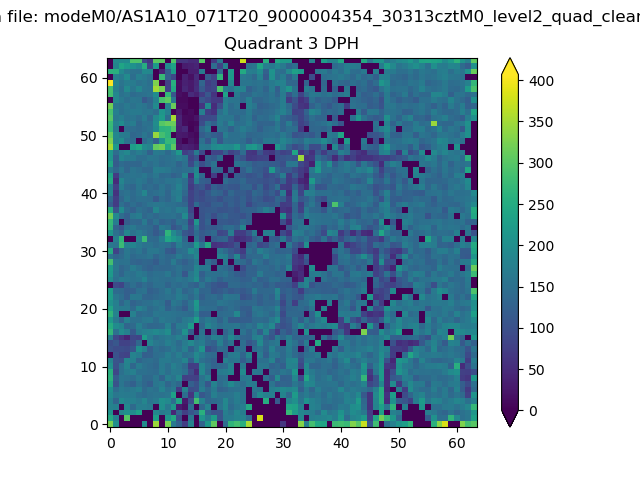 |
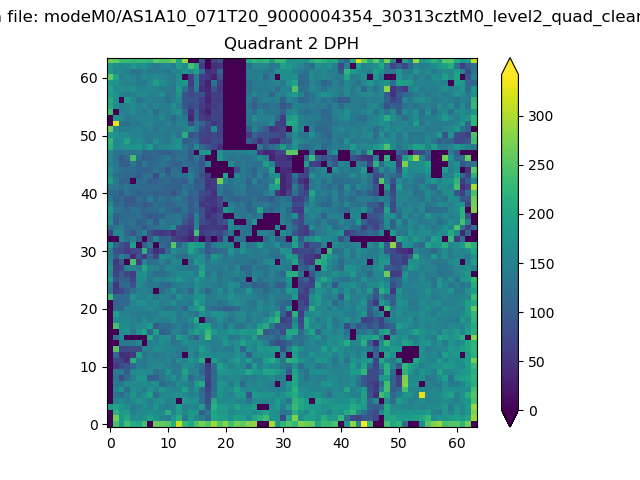 |
Quadrant C |
| Plot type | Count rate plots | Images |
|---|---|---|
| Comparison with Poisson distribution Blue bars denote a histogram of data divided into 1 sec bins. Red curve is a Poisson curve with rate = median count rate of data. |
 |
 |
| Quadrant-wise count rates Data is divided into 100 sec bins |
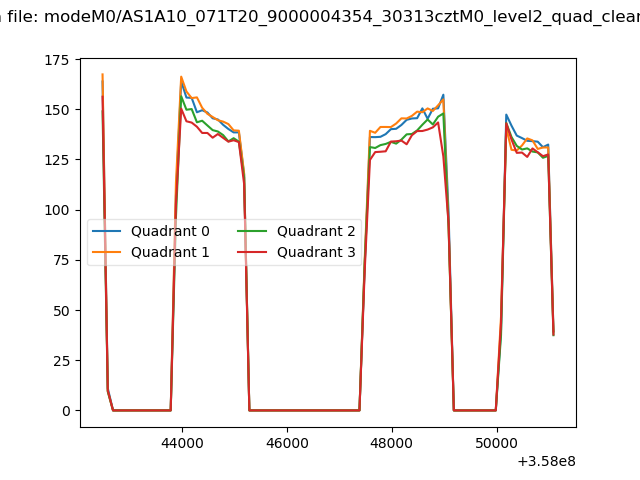 |
|
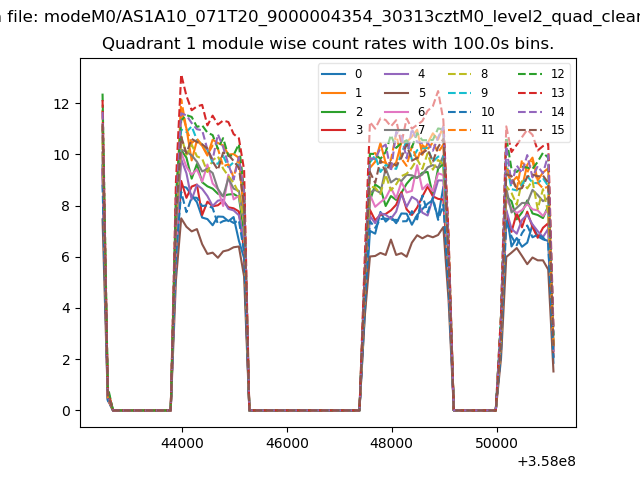
| Module-wise count rates for Quadrant A Data is divided into 100 sec bins |
 |
 |
| Module-wise count rates for Quadrant B Data is divided into 100 sec bins |
 |
 |
| Module-wise count rates for Quadrant C Data is divided into 100 sec bins |
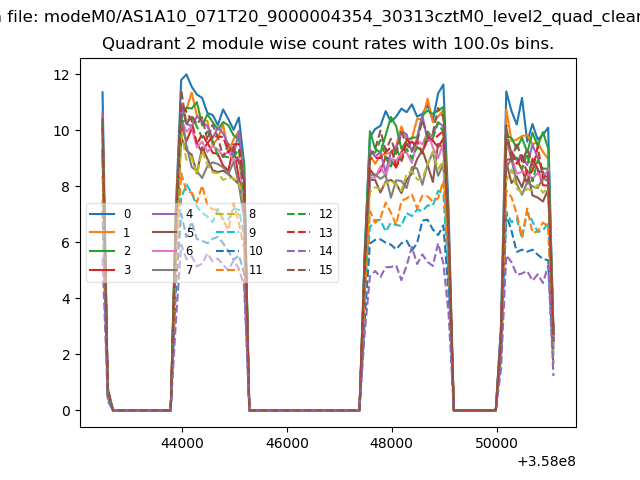 |
 |
| Module-wise count rates for Quadrant D Data is divided into 100 sec bins |
 |
 |
| Parameter | Plot |
|---|---|
| CZT HV Monitor | 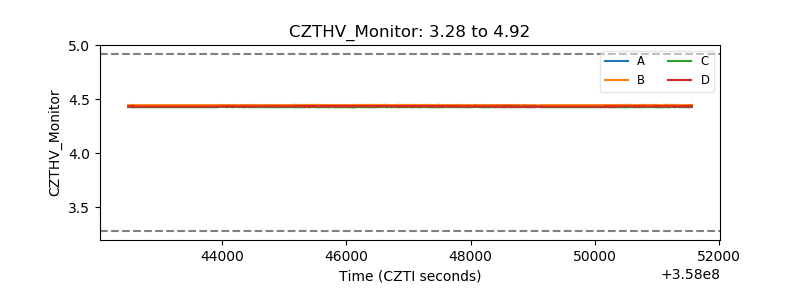 |
| D_VDD | 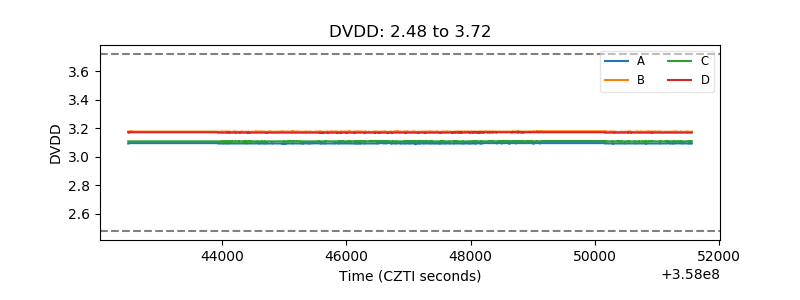 |
| Temperature 1 |  |
| Veto HV Monitor | 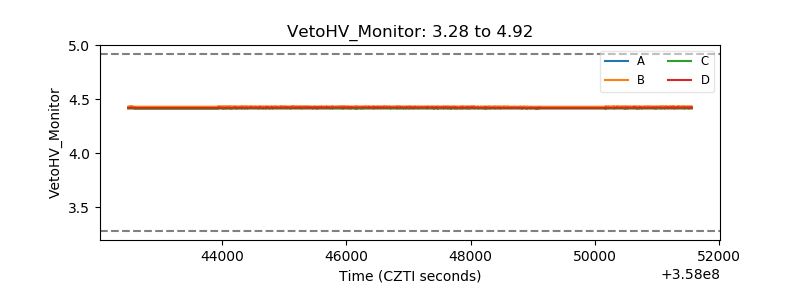 |
| Veto LLD |  |
| Alpha Counter | 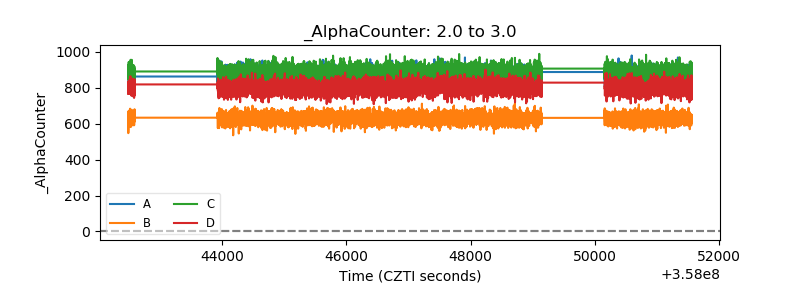 |
| _CPM_Rate | 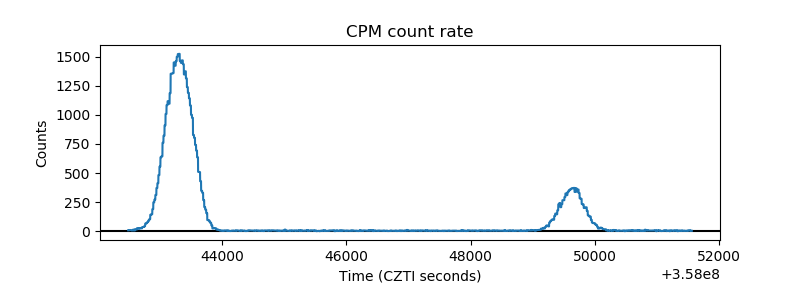 |
| CZT Counter | 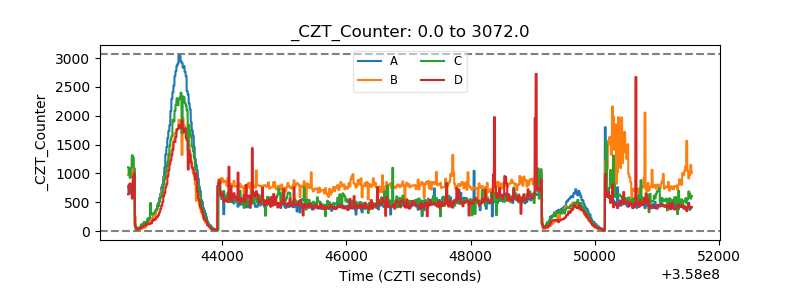 |
| +2.5 Volts monitor |  |
| +5 Volts monitor |  |
| _ROLL_ROT | 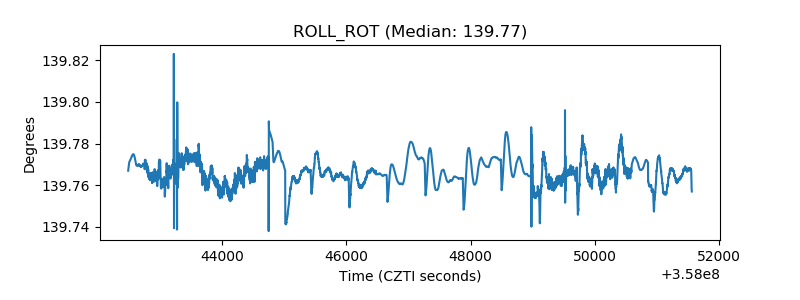 |
| _Roll_DEC | 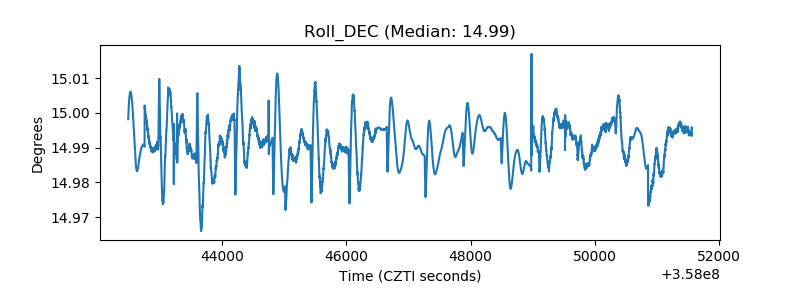 |
| _Roll_RA | 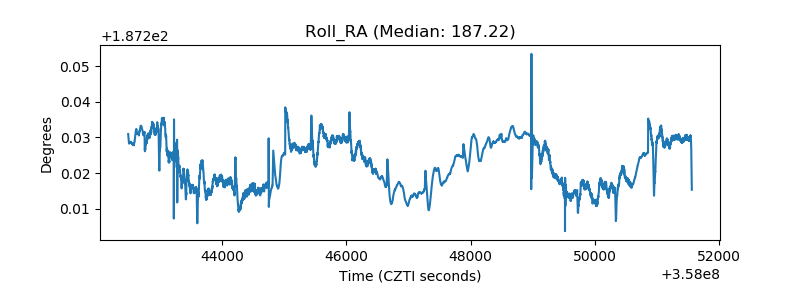 |
| Veto Counter | 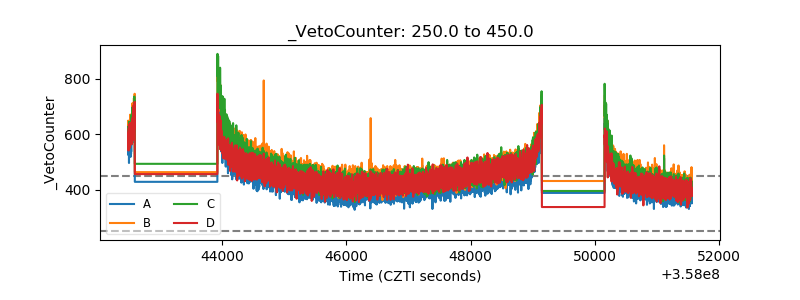 |