| Param | Original file | Final file |
|---|---|---|
| Filename | modeM0/AS1A10_071T23_9000004356cztM0_level2.fits | modeM0/AS1A10_071T23_9000004356cztM0_level2_quad_clean.evt |
| Size (bytes) | 349,954,560 | 352,330,560 |
| Size | 333.7 MB | 336.0 MB |
| Events in quadrant A | 2,128,010 | 2,146,042 |
| Events in quadrant B | 2,014,304 | 2,117,394 |
| Events in quadrant C | 2,080,246 | 2,005,593 |
| Events in quadrant D | 1,867,086 | 1,893,639 |
| Mode M0 | |||
|---|---|---|---|
| Quadrant | BADHDUFLAG | Total packets | Discarded packets |
| A | 0 | 88086 | 0 |
| B | 0 | 118152 | 0 |
| C | 0 | 88406 | 0 |
| D | 0 | 79519 | 0 |
| Mode SS | |||
|---|---|---|---|
| Quadrant | BADHDUFLAG | Total packets | Discarded packets |
| A | 0 | 744 | 0 |
| B | 0 | 744 | 0 |
| C | 0 | 744 | 0 |
| D | 0 | 744 | 0 |
| Mode M9 | |||
|---|---|---|---|
| Quadrant | BADHDUFLAG | Total packets | Discarded packets |
| A | 0 | 42 | 0 |
| B | 0 | 42 | 0 |
| C | 0 | 42 | 0 |
| D | 0 | 42 | 0 |
| Quadrant | Total seconds | Saturated seconds | Saturation percentage |
|---|---|---|---|
| A | 36507 | 1713 | 4.692251% |
| B | 36507 | 1386 | 3.796532% |
| C | 36507 | 1430 | 3.917057% |
| D | 36507 | 506 | 1.386036% |
Noise dominated data is calculated using 1-second bins in cleaned event files. If a bin has >2000 counts, and if more than 50% of those come from <1% of pixels, then it is considered to be noise-dominated and hence unusable.
| Quadrant | # 1 sec bins | Bins with >0 counts | Bins with >2000 counts | High rate bins dominated by noise | Noise dominated (total time) | Noise dominated (detector-on time) | Marked lightcurve |
|---|---|---|---|---|---|---|---|
| A | 40627 | 36502 | 0 | 0 | 0.00% | 0.00% |  |
| B | 40627 | 36501 | 0 | 0 | 0.00% | 0.00% |  |
| C | 40627 | 36501 | 0 | 0 | 0.00% | 0.00% |  |
| D | 40627 | 36502 | 0 | 0 | 0.00% | 0.00% |  |
Top three noisy pixels from each quadrant. If the there are fewer than three noisy pixels in the level2.evt file, extra rows are filled as -1
| Pixel properties | Quadrant properties | ||||||
|---|---|---|---|---|---|---|---|
| Quadrant | DetID | PixID | Counts | Sigma | Mean | Median | Sigma |
| A | 0 | 29 | 2078 | 11.12 | 553 | 515 | 140.5 |
| A | 7 | 110 | 1653 | 8.1 | 553 | 515 | 140.5 |
| A | 15 | 236 | 1598 | 7.71 | 553 | 515 | 140.5 |
| B | 2 | 9 | 1602 | 10.08 | 531 | 504 | 109.0 |
| B | 5 | 232 | 1367 | 7.92 | 531 | 504 | 109.0 |
| B | 3 | 17 | 1358 | 7.84 | 531 | 504 | 109.0 |
| C | 1 | 80 | 1663 | 8.19 | 548 | 511 | 140.7 |
| C | 1 | 81 | 1641 | 8.03 | 548 | 511 | 140.7 |
| C | 7 | 111 | 1415 | 6.42 | 548 | 511 | 140.7 |
| D | 15 | 46 | 1447 | 6.71 | 532 | 481 | 144.0 |
| D | 3 | 14 | 1311 | 5.76 | 532 | 481 | 144.0 |
| D | 7 | 3 | 1298 | 5.67 | 532 | 481 | 144.0 |
Histogram calculated using DETX and DETY for each event in the final _common_clean file
| Quadrant A |  |
 |
Quadrant B |
|---|---|---|---|
| Quadrant D |  |
 |
Quadrant C |
| Plot type | Count rate plots | Images |
|---|---|---|
| Comparison with Poisson distribution Blue bars denote a histogram of data divided into 1 sec bins. Red curve is a Poisson curve with rate = median count rate of data. |
 |
 |
| Quadrant-wise count rates Data is divided into 100 sec bins |
 |
|
| Module-wise count rates for Quadrant A Data is divided into 100 sec bins |
 |
 |
| Module-wise count rates for Quadrant B Data is divided into 100 sec bins |
 |
 |
| Module-wise count rates for Quadrant C Data is divided into 100 sec bins |
 |
 |
| Module-wise count rates for Quadrant D Data is divided into 100 sec bins |
 |
 |
| Parameter | Plot |
|---|---|
| CZT HV Monitor |  |
| D_VDD |  |
| Temperature 1 |  |
| Veto HV Monitor |  |
| Veto LLD |  |
| Alpha Counter |  |
| _CPM_Rate |  |
| CZT Counter |  |
| +2.5 Volts monitor |  |
| +5 Volts monitor |  |
| _ROLL_ROT |  |
| _Roll_DEC |  |
| _Roll_RA |  |
| Veto Counter | 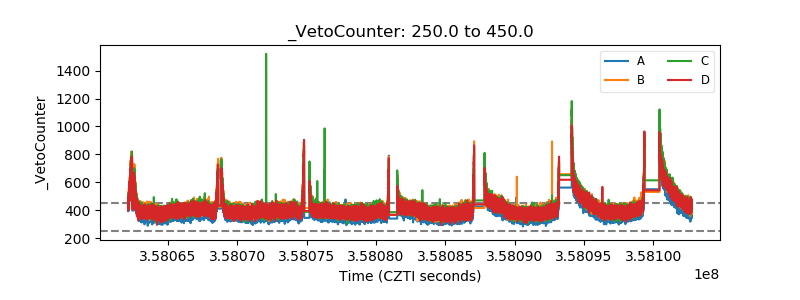 |