| Param | Original file | Final file |
|---|---|---|
| Filename | modeM0/AS1A10_071T23_9000004356_30319cztM0_level2.evt | modeM0/AS1A10_071T23_9000004356_30319cztM0_level2_quad_clean.evt |
| Size (bytes) | 1,522,163,520 | 232,032,960 |
| Size | 1.4 GB | 221.3 MB |
| Events in quadrant A | 8,878,424 | 1,470,613 |
| Events in quadrant B | 15,985,410 | 1,459,924 |
| Events in quadrant C | 10,766,455 | 1,411,755 |
| Events in quadrant D | 9,211,033 | 1,400,046 |
| Mode M0 | |||
|---|---|---|---|
| Quadrant | BADHDUFLAG | Total packets | Discarded packets |
| A | 0 | 38270 | 4 |
| B | 0 | 60263 | 4 |
| C | 0 | 43598 | 4 |
| D | 0 | 39220 | 4 |
| Mode SS | |||
|---|---|---|---|
| Quadrant | BADHDUFLAG | Total packets | Discarded packets |
| A | 0 | 380 | 0 |
| B | 0 | 380 | 0 |
| C | 0 | 380 | 0 |
| D | 0 | 380 | 0 |
| Mode M9 | |||
|---|---|---|---|
| Quadrant | BADHDUFLAG | Total packets | Discarded packets |
| A | 0 | 17 | 0 |
| B | 0 | 17 | 0 |
| C | 0 | 17 | 0 |
| D | 0 | 17 | 0 |
| Quadrant | Total seconds | Saturated seconds | Saturation percentage |
|---|---|---|---|
| A | 18652 | 247 | 1.324255% |
| B | 18652 | 591 | 3.168561% |
| C | 18652 | 504 | 2.702123% |
| D | 18651 | 200 | 1.072329% |
Noise dominated data is calculated using 1-second bins in cleaned event files. If a bin has >2000 counts, and if more than 50% of those come from <1% of pixels, then it is considered to be noise-dominated and hence unusable.
| Quadrant | # 1 sec bins | Bins with >0 counts | Bins with >2000 counts | High rate bins dominated by noise | Noise dominated (total time) | Noise dominated (detector-on time) | Marked lightcurve |
|---|---|---|---|---|---|---|---|
| A | 20402 | 18652 | 1 | 1 | 0.00% | 0.01% | 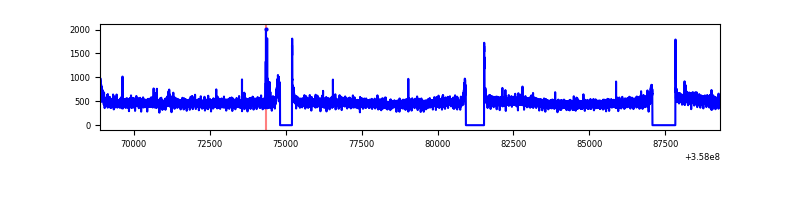 |
| B | 20402 | 18652 | 79 | 79 | 0.39% | 0.42% | 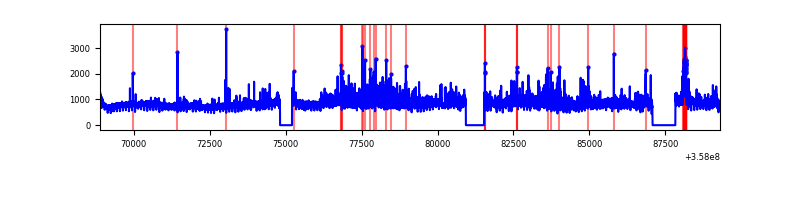 |
| C | 20402 | 18652 | 19 | 19 | 0.09% | 0.10% | 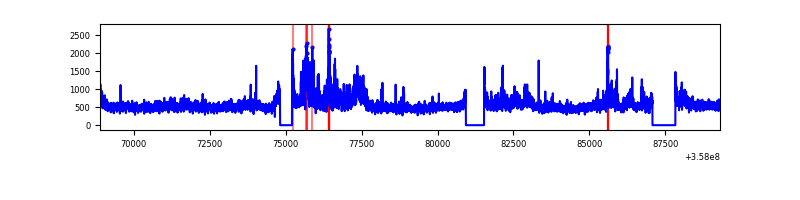 |
| D | 20401 | 18652 | 47 | 47 | 0.23% | 0.25% | 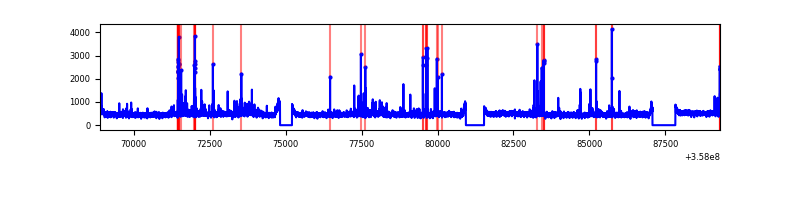 |
Top three noisy pixels from each quadrant. If the there are fewer than three noisy pixels in the level2.evt file, extra rows are filled as -1
| Pixel properties | Quadrant properties | ||||||
|---|---|---|---|---|---|---|---|
| Quadrant | DetID | PixID | Counts | Sigma | Mean | Median | Sigma |
| A | 14 | 239 | 54563 | 114.28 | 2279 | 2231 | 457.9 |
| A | 8 | 192 | 35463 | 72.57 | 2279 | 2231 | 457.9 |
| A | 13 | 254 | 31515 | 63.95 | 2279 | 2231 | 457.9 |
| B | 6 | 159 | 5143038 | 11817.72 | 2236 | 2172 | 435.0 |
| B | 6 | 36 | 1871970 | 4298.25 | 2236 | 2172 | 435.0 |
| B | 0 | 183 | 124447 | 281.08 | 2236 | 2172 | 435.0 |
| C | 3 | 233 | 1841365 | 3582.97 | 2178 | 2189 | 513.3 |
| C | 14 | 238 | 367724 | 712.11 | 2178 | 2189 | 513.3 |
| C | 2 | 114 | 43082 | 79.67 | 2178 | 2189 | 513.3 |
| D | 8 | 195 | 351302 | 601.47 | 2187 | 2147 | 580.5 |
| D | 13 | 104 | 198487 | 338.22 | 2187 | 2147 | 580.5 |
| D | 2 | 250 | 187935 | 320.04 | 2187 | 2147 | 580.5 |
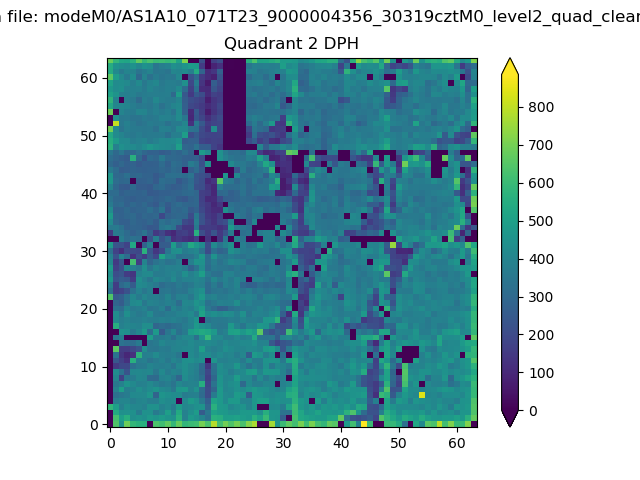
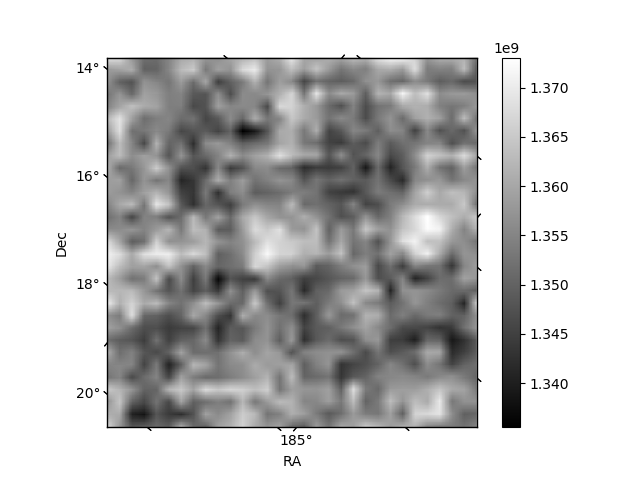
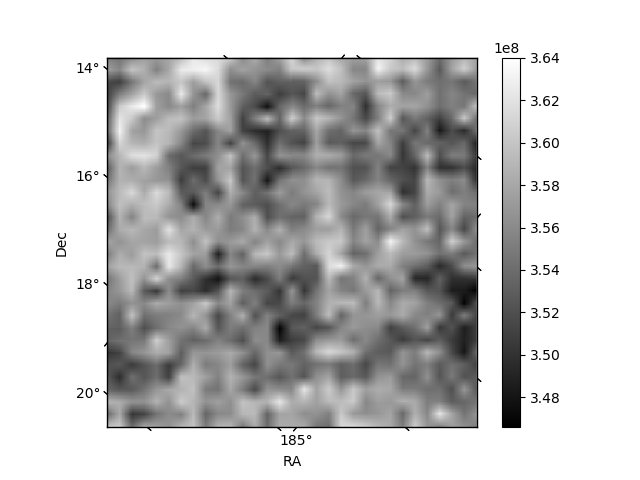
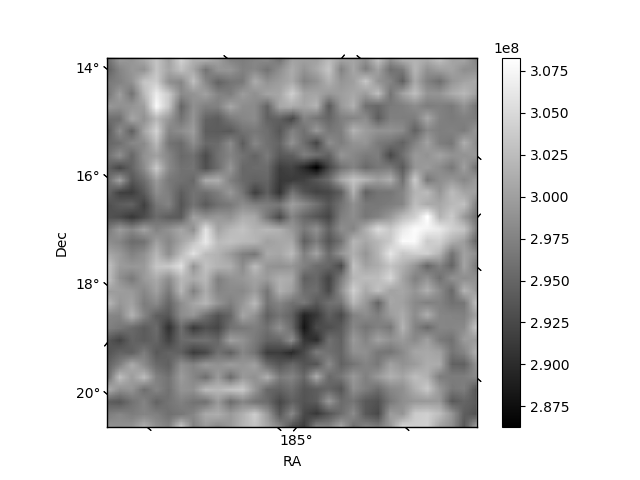
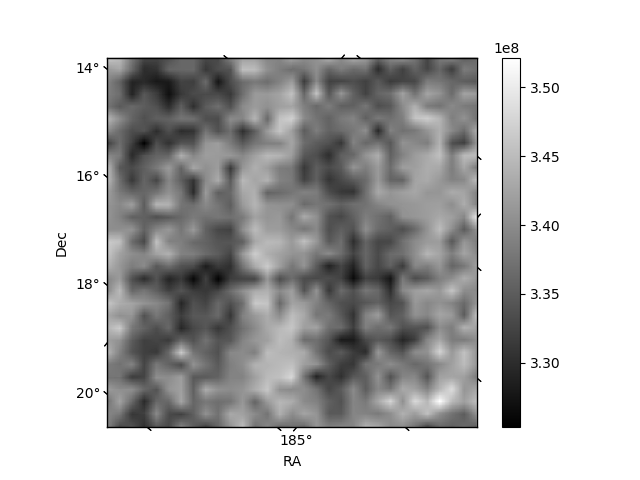
Histogram calculated using DETX and DETY for each event in the final _common_clean file
| Quadrant A | 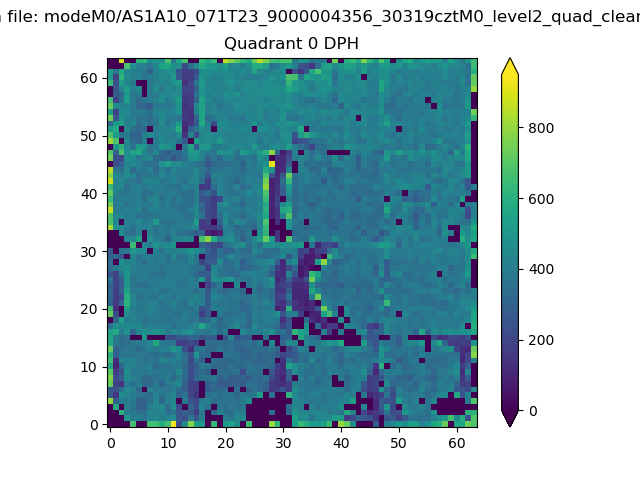 |
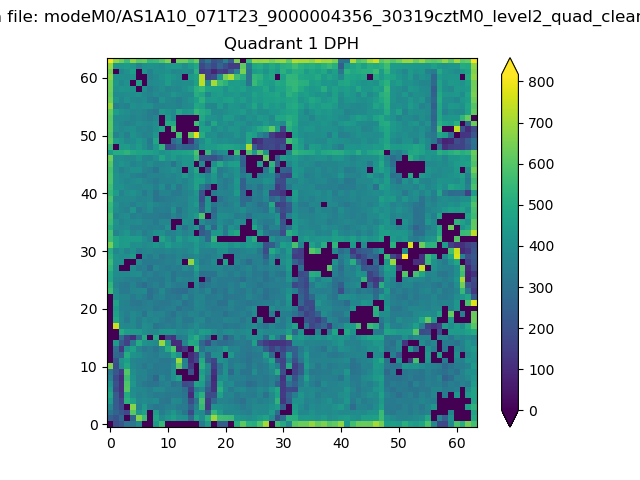 |
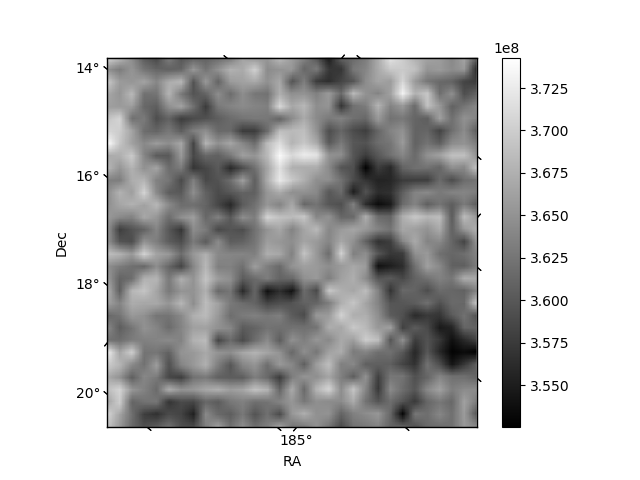
Quadrant B |
|---|---|---|---|
| Quadrant D | 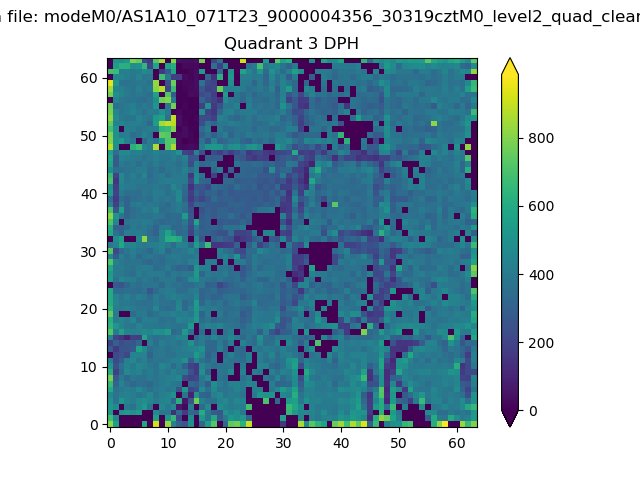 |
 |
Quadrant C |
| Plot type | Count rate plots | Images |
|---|---|---|
| Comparison with Poisson distribution Blue bars denote a histogram of data divided into 1 sec bins. Red curve is a Poisson curve with rate = median count rate of data. |
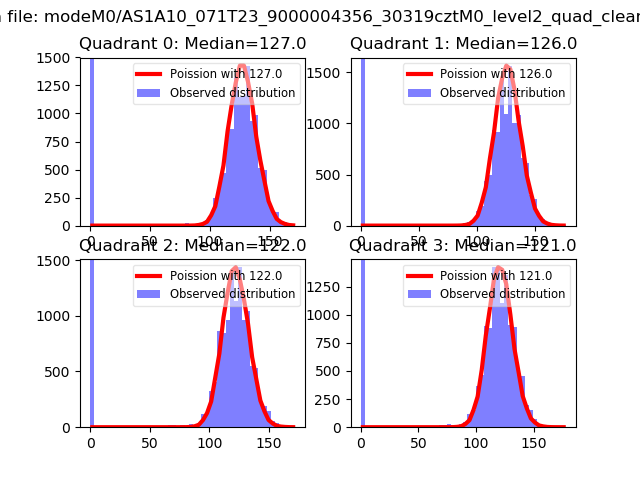 |
 |
| Quadrant-wise count rates Data is divided into 100 sec bins |
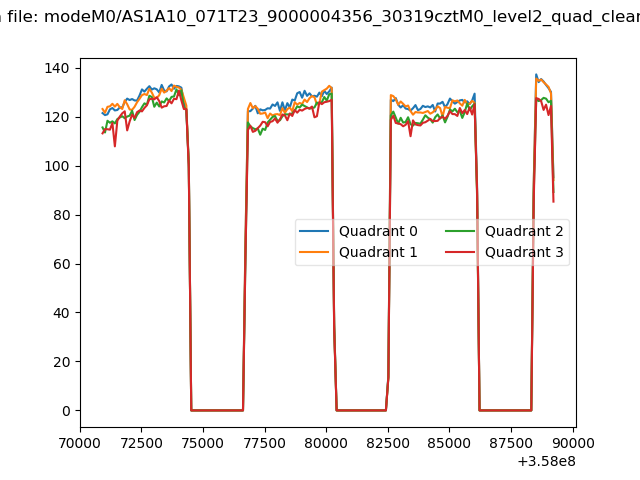 |
|
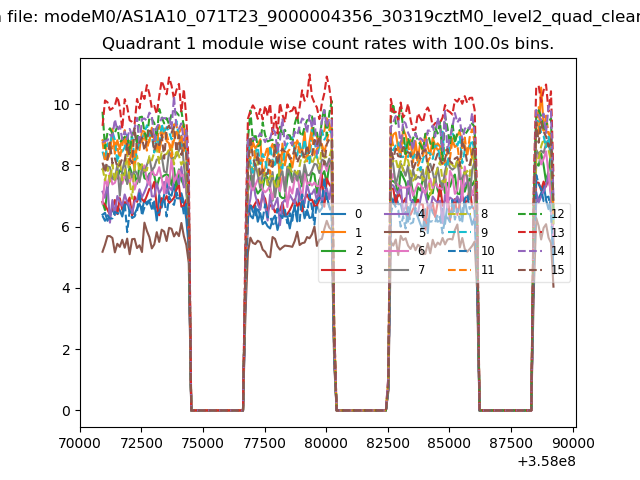
| Module-wise count rates for Quadrant A Data is divided into 100 sec bins |
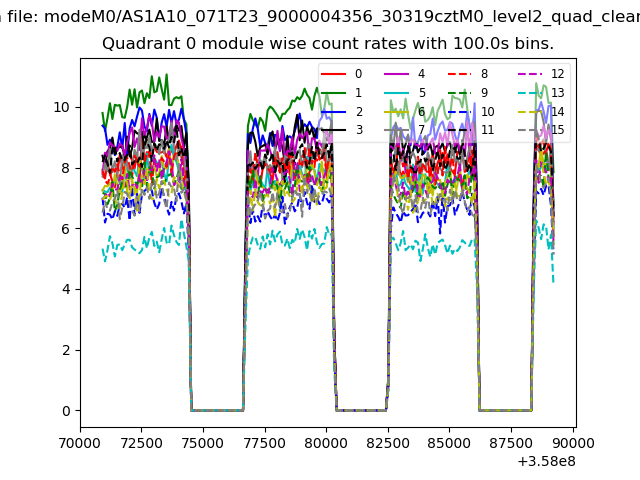 |
 |
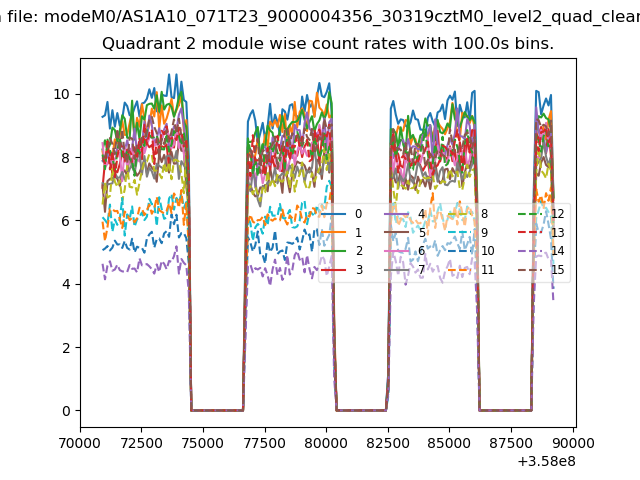
| Module-wise count rates for Quadrant B Data is divided into 100 sec bins |
 |
 |
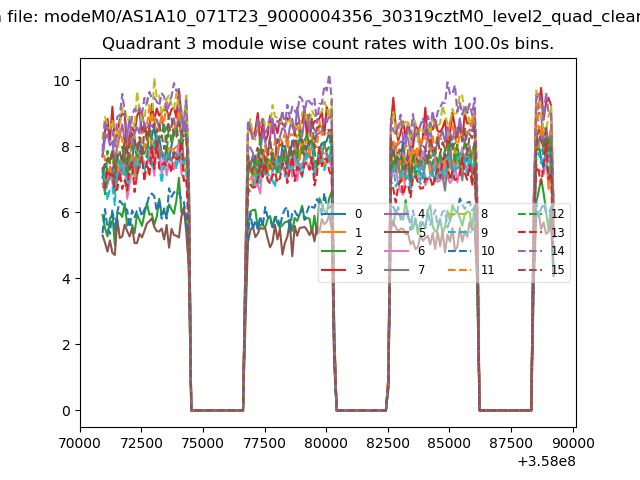
| Module-wise count rates for Quadrant C Data is divided into 100 sec bins |
 |
 |
| Module-wise count rates for Quadrant D Data is divided into 100 sec bins |
 |
 |
| Parameter | Plot |
|---|---|
| CZT HV Monitor | 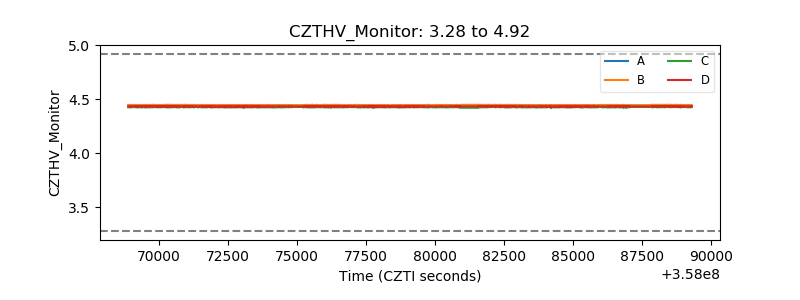 |
| D_VDD |  |
| Temperature 1 | 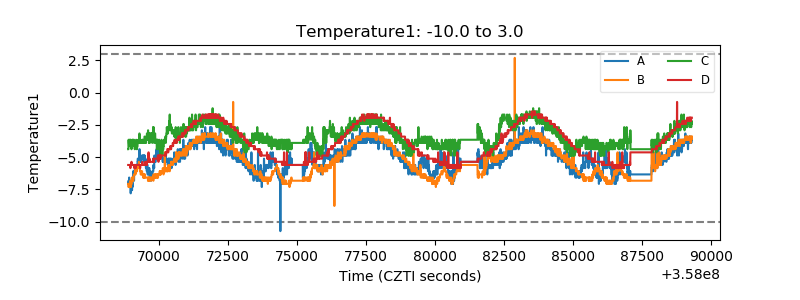 |
| Veto HV Monitor | 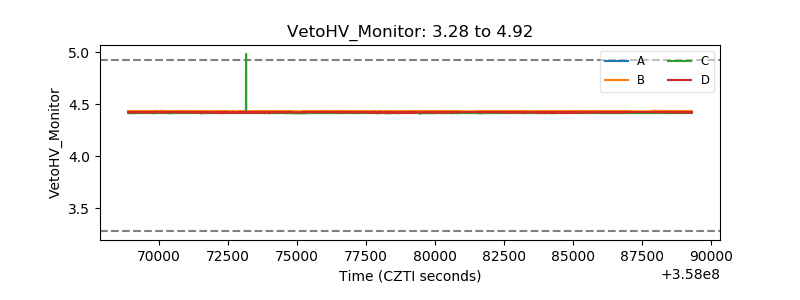 |
| Veto LLD | 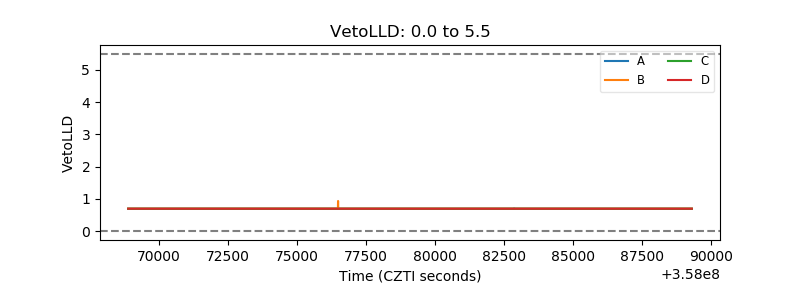 |
| Alpha Counter | 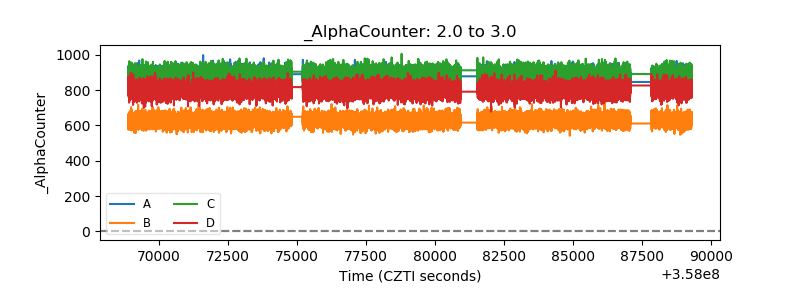 |
| _CPM_Rate | 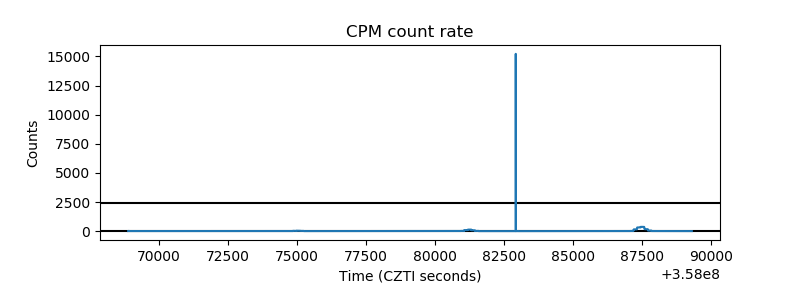 |
| CZT Counter | 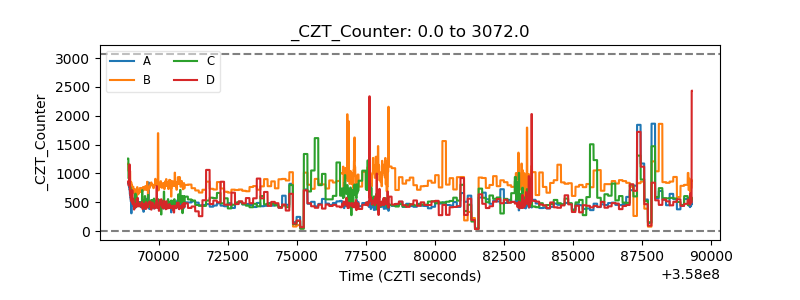 |
| +2.5 Volts monitor |  |
| +5 Volts monitor |  |
| _ROLL_ROT | 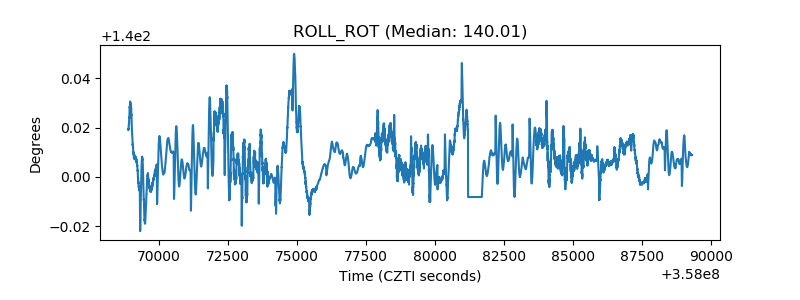 |
| _Roll_DEC | 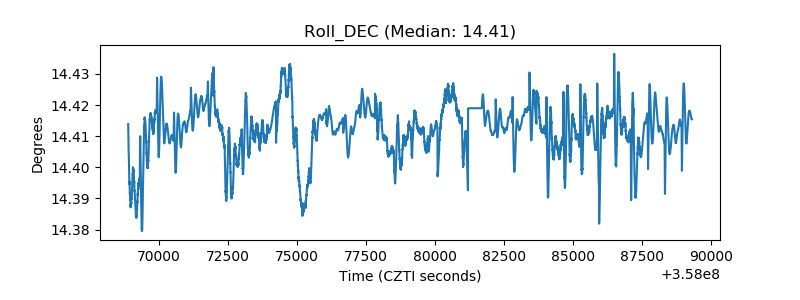 |
| _Roll_RA |  |
| Veto Counter | 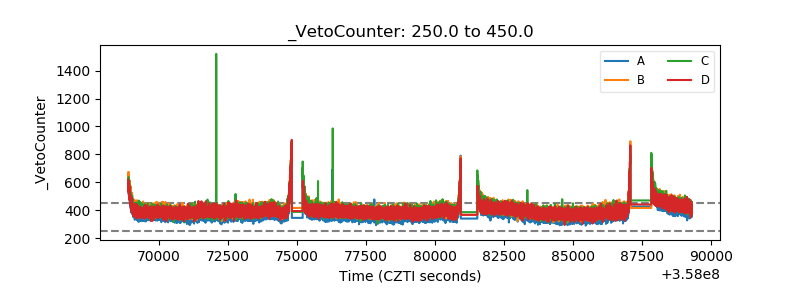 |