| Param | Original file | Final file |
|---|---|---|
| Filename | modeM0/AS1A10_071T23_9000004356_30320cztM0_level2.evt | modeM0/AS1A10_071T23_9000004356_30320cztM0_level2_quad_clean.evt |
| Size (bytes) | 668,805,120 | 96,998,400 |
| Size | 637.8 MB | 92.5 MB |
| Events in quadrant A | 4,636,870 | 626,801 |
| Events in quadrant B | 6,065,753 | 634,351 |
| Events in quadrant C | 5,559,215 | 596,024 |
| Events in quadrant D | 3,532,183 | 604,707 |
| Mode M0 | |||
|---|---|---|---|
| Quadrant | BADHDUFLAG | Total packets | Discarded packets |
| A | 0 | 18238 | 2 |
| B | 0 | 22684 | 2 |
| C | 0 | 21170 | 2 |
| D | 0 | 14696 | 2 |
| Mode SS | |||
|---|---|---|---|
| Quadrant | BADHDUFLAG | Total packets | Discarded packets |
| A | 0 | 140 | 0 |
| B | 0 | 140 | 0 |
| C | 0 | 140 | 0 |
| D | 0 | 140 | 0 |
| Mode M9 | |||
|---|---|---|---|
| Quadrant | BADHDUFLAG | Total packets | Discarded packets |
| A | 0 | 12 | 0 |
| B | 0 | 13 | 0 |
| C | 0 | 13 | 0 |
| D | 0 | 13 | 0 |
| Quadrant | Total seconds | Saturated seconds | Saturation percentage |
|---|---|---|---|
| A | 6818 | 328 | 4.810795% |
| B | 6817 | 298 | 4.371424% |
| C | 6817 | 501 | 7.349274% |
| D | 6817 | 62 | 0.909491% |
Noise dominated data is calculated using 1-second bins in cleaned event files. If a bin has >2000 counts, and if more than 50% of those come from <1% of pixels, then it is considered to be noise-dominated and hence unusable.
| Quadrant | # 1 sec bins | Bins with >0 counts | Bins with >2000 counts | High rate bins dominated by noise | Noise dominated (total time) | Noise dominated (detector-on time) | Marked lightcurve |
|---|---|---|---|---|---|---|---|
| A | 7733 | 6818 | 153 | 153 | 1.98% | 2.24% | 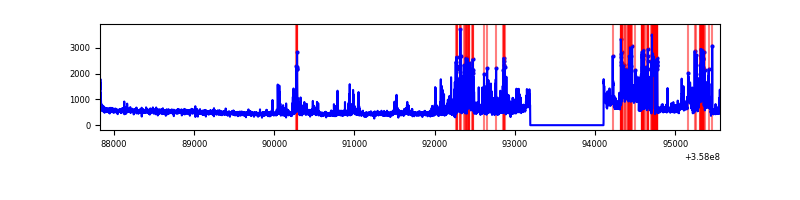 |
| B | 7732 | 6817 | 65 | 65 | 0.84% | 0.95% | 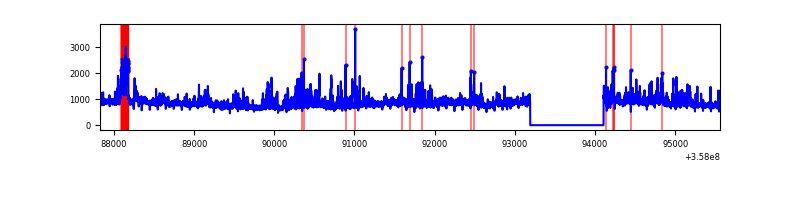 |
| C | 7732 | 6817 | 244 | 244 | 3.16% | 3.58% | 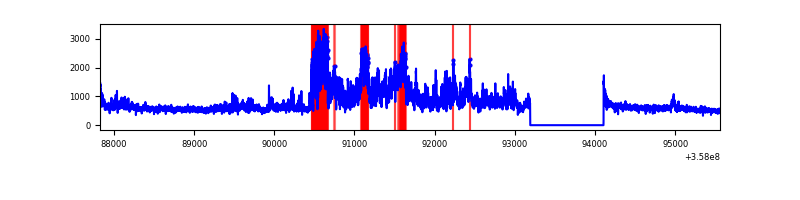 |
| D | 7732 | 6817 | 9 | 9 | 0.12% | 0.13% | 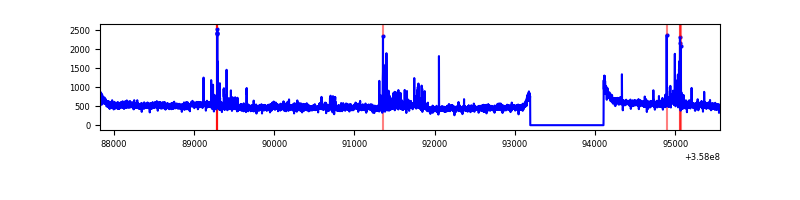 |
Top three noisy pixels from each quadrant. If the there are fewer than three noisy pixels in the level2.evt file, extra rows are filled as -1
| Pixel properties | Quadrant properties | ||||||
|---|---|---|---|---|---|---|---|
| Quadrant | DetID | PixID | Counts | Sigma | Mean | Median | Sigma |
| A | 14 | 239 | 1315776 | 7591.55 | 853 | 833 | 173.2 |
| A | 8 | 192 | 19656 | 108.67 | 853 | 833 | 173.2 |
| A | 13 | 254 | 11764 | 63.11 | 853 | 833 | 173.2 |
| B | 6 | 159 | 1861197 | 11416.48 | 839 | 818 | 163.0 |
| B | 6 | 36 | 836836 | 5130.34 | 839 | 818 | 163.0 |
| B | 0 | 190 | 38566 | 231.65 | 839 | 818 | 163.0 |
| C | 3 | 233 | 2203791 | 11488.27 | 814 | 817 | 191.8 |
| C | 14 | 238 | 143343 | 743.26 | 814 | 817 | 191.8 |
| C | 14 | 254 | 20519 | 102.74 | 814 | 817 | 191.8 |
| D | 8 | 195 | 126816 | 638.67 | 838 | 815 | 197.3 |
| D | 13 | 104 | 110039 | 553.63 | 838 | 815 | 197.3 |
| D | 2 | 250 | 57546 | 287.56 | 838 | 815 | 197.3 |
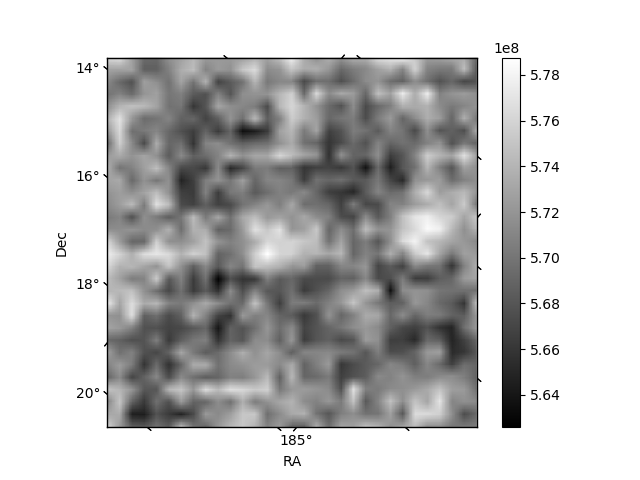
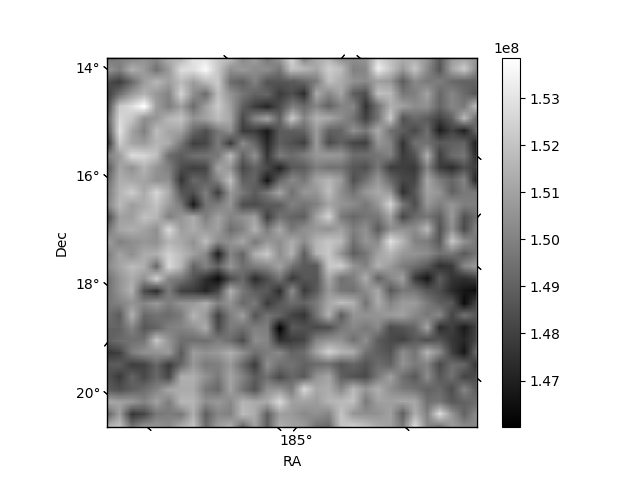
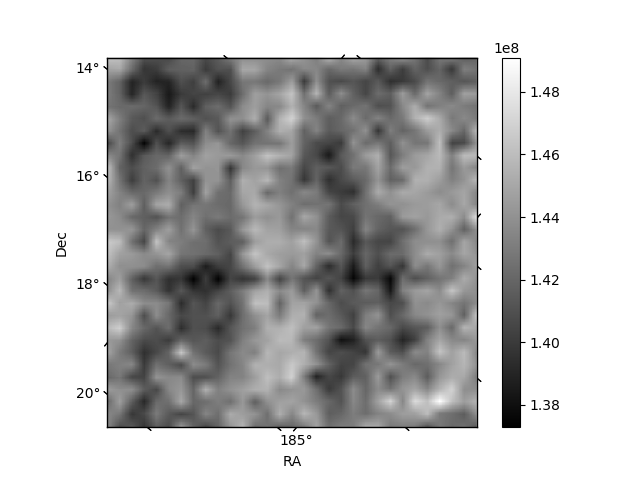
Histogram calculated using DETX and DETY for each event in the final _common_clean file
| Quadrant A | 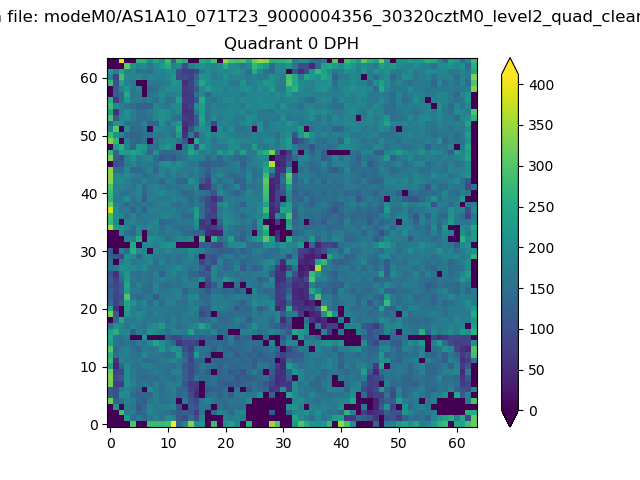 |
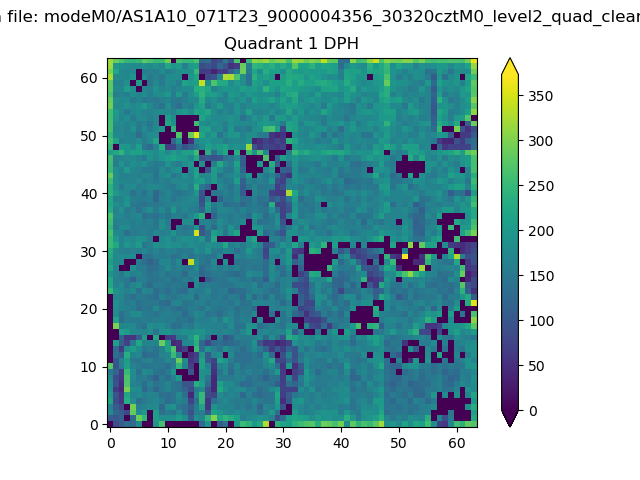 |
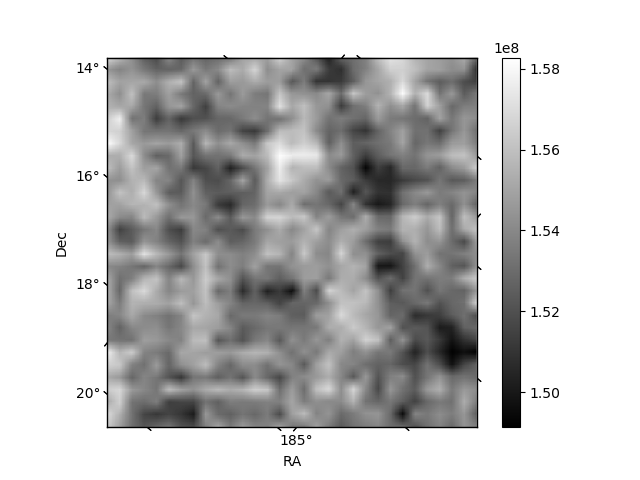
Quadrant B |
|---|---|---|---|
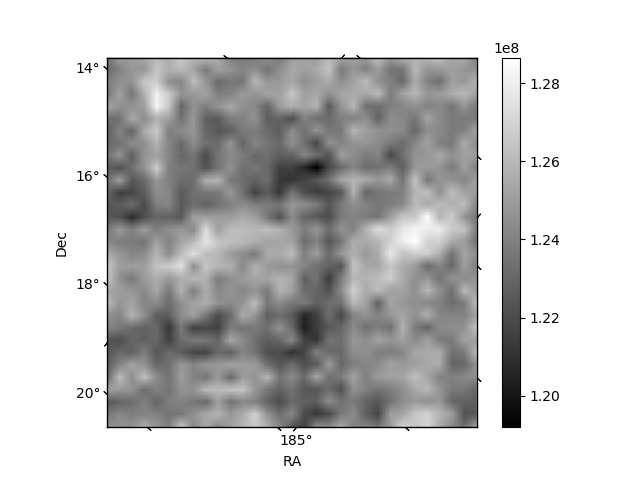
| Quadrant D | 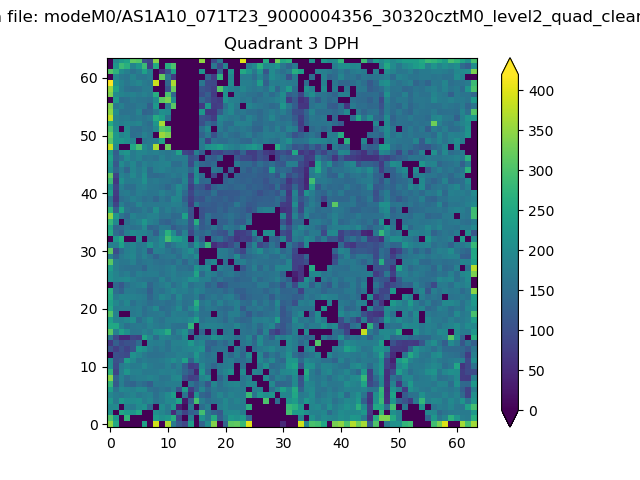 |
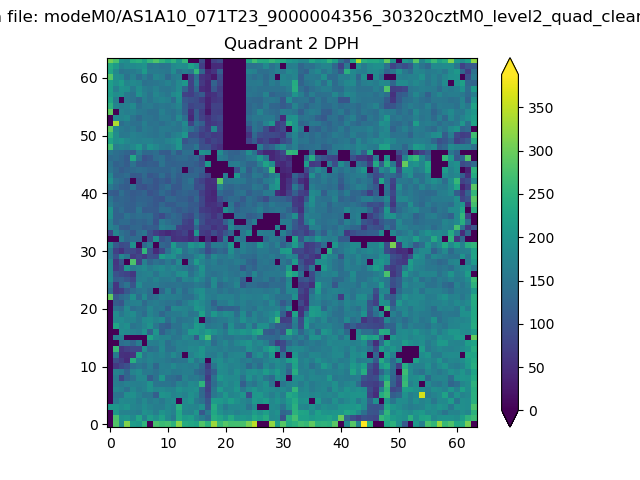 |
Quadrant C |
| Plot type | Count rate plots | Images |
|---|---|---|
| Comparison with Poisson distribution Blue bars denote a histogram of data divided into 1 sec bins. Red curve is a Poisson curve with rate = median count rate of data. |
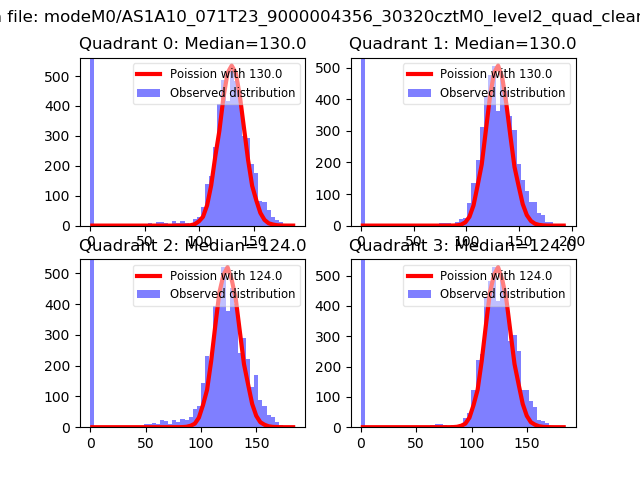 |
 |
| Quadrant-wise count rates Data is divided into 100 sec bins |
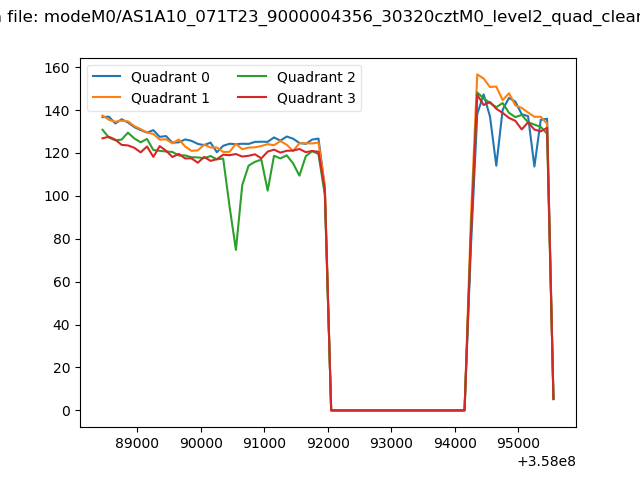 |
|
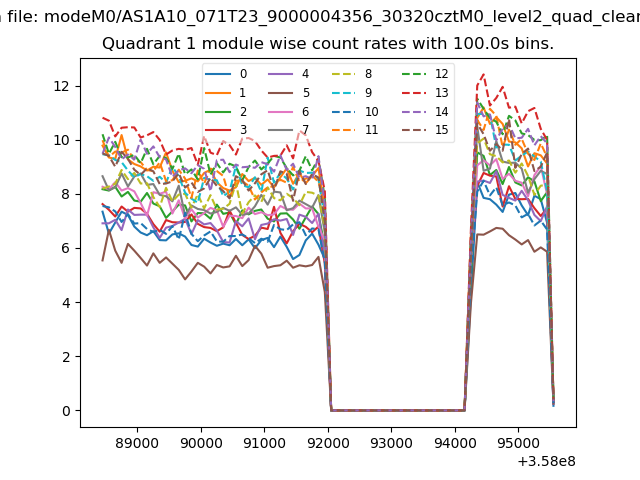
| Module-wise count rates for Quadrant A Data is divided into 100 sec bins |
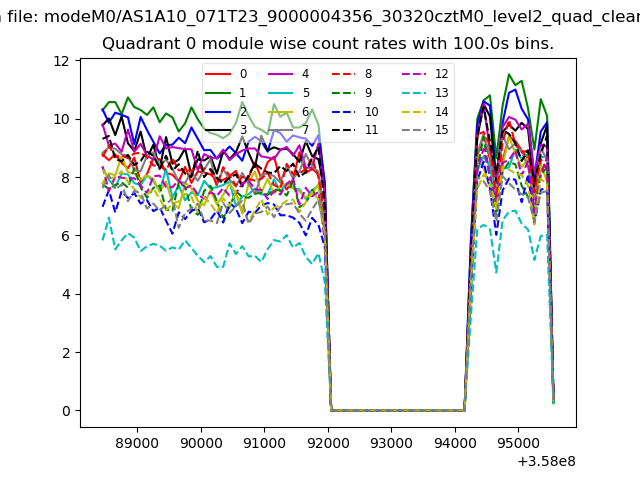 |
 |
| Module-wise count rates for Quadrant B Data is divided into 100 sec bins |
 |
 |
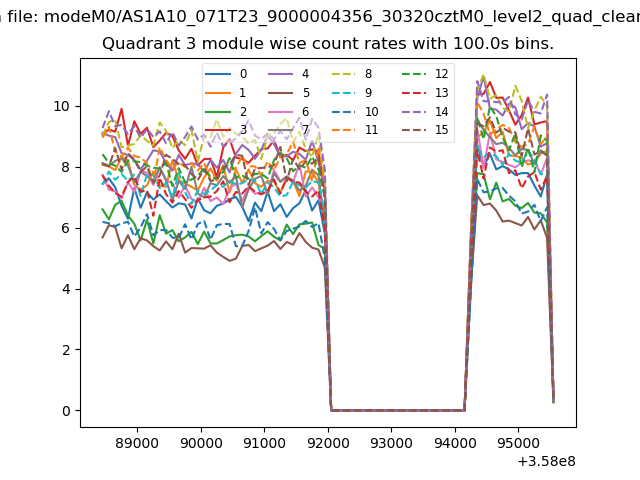
| Module-wise count rates for Quadrant C Data is divided into 100 sec bins |
 |
 |
| Module-wise count rates for Quadrant D Data is divided into 100 sec bins |
 |
 |
| Parameter | Plot |
|---|---|
| CZT HV Monitor | 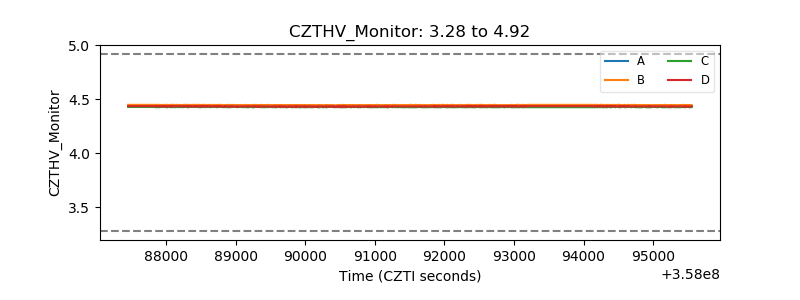 |
| D_VDD | 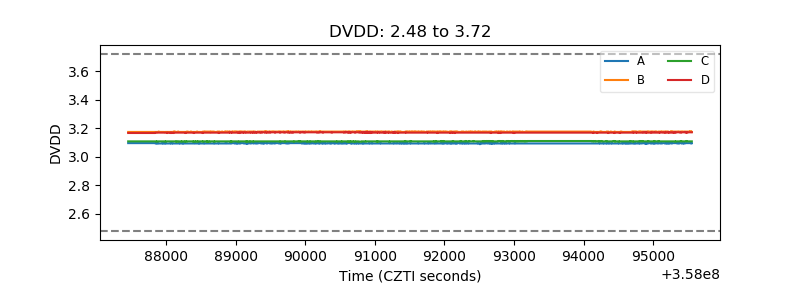 |
| Temperature 1 | 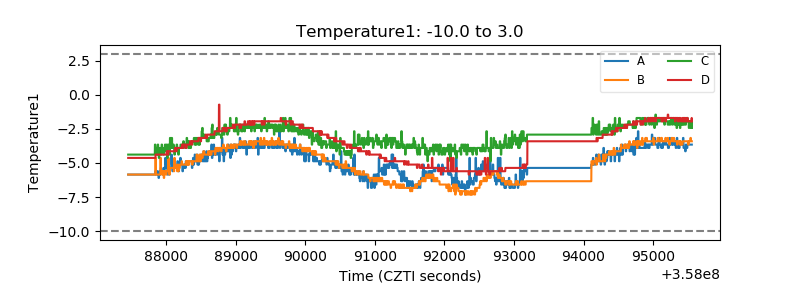 |
| Veto HV Monitor | 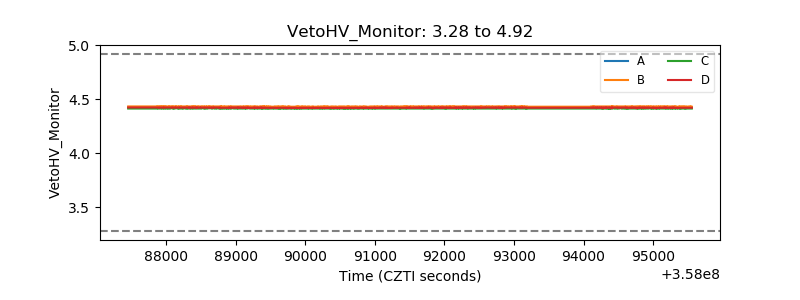 |
| Veto LLD | 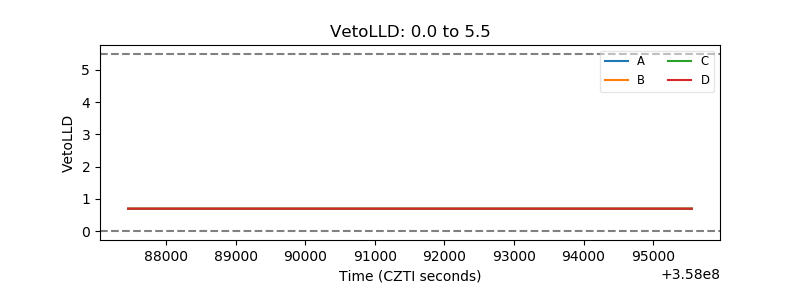 |
| Alpha Counter | 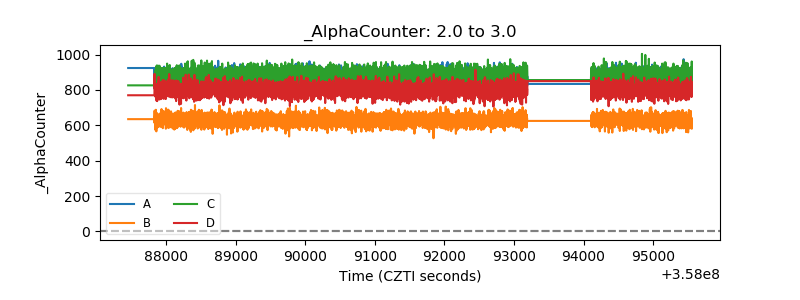 |
| _CPM_Rate | 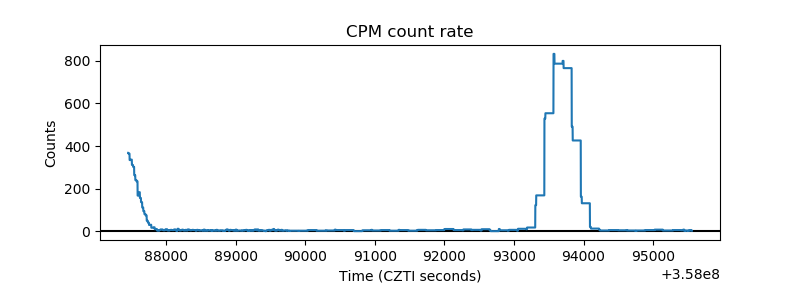 |
| CZT Counter | 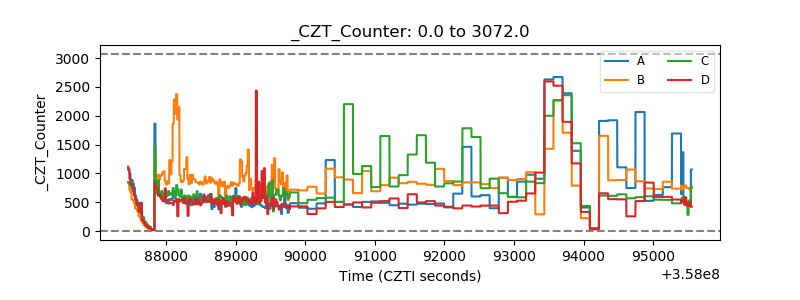 |
| +2.5 Volts monitor |  |
| +5 Volts monitor |  |
| _ROLL_ROT | 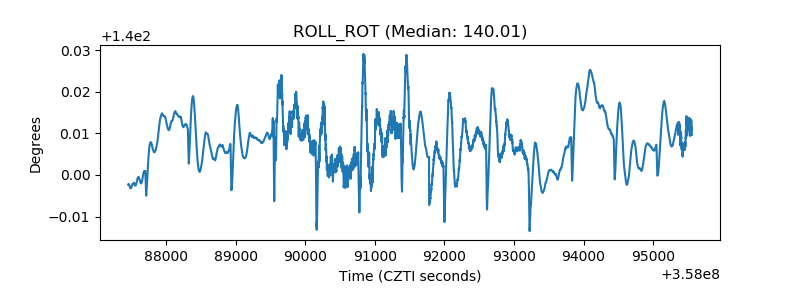 |
| _Roll_DEC | 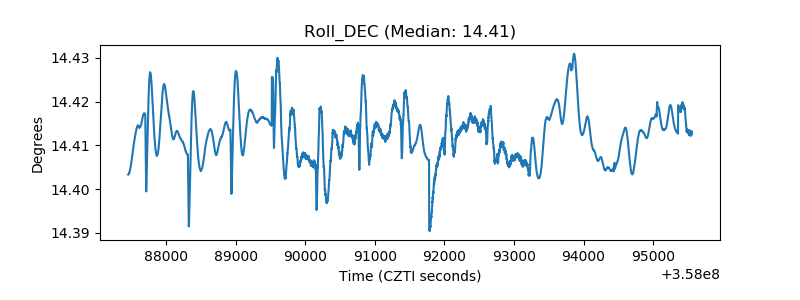 |
| _Roll_RA | 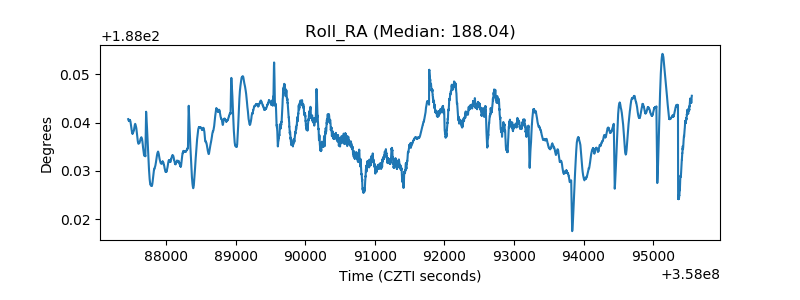 |
| Veto Counter | 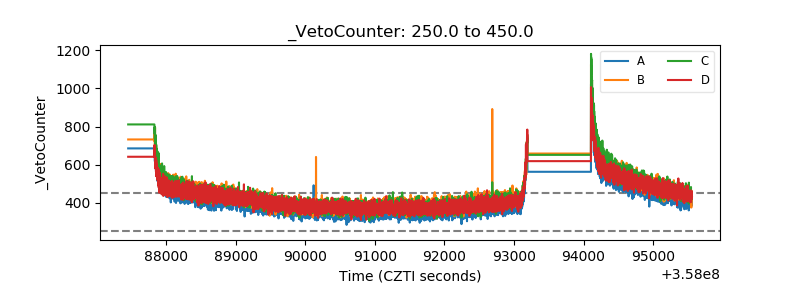 |