| Param | Original file | Final file |
|---|---|---|
| Filename | modeM0/AS1A10_071T23_9000004356_30322cztM0_level2.evt | modeM0/AS1A10_071T23_9000004356_30322cztM0_level2_quad_clean.evt |
| Size (bytes) | 645,920,640 | 103,406,400 |
| Size | 616.0 MB | 98.6 MB |
| Events in quadrant A | 6,528,667 | 671,212 |
| Events in quadrant B | 5,862,715 | 688,106 |
| Events in quadrant C | 3,324,450 | 669,383 |
| Events in quadrant D | 3,415,851 | 658,818 |
| Mode M0 | |||
|---|---|---|---|
| Quadrant | BADHDUFLAG | Total packets | Discarded packets |
| A | 0 | 23702 | 1 |
| B | 0 | 21814 | 1 |
| C | 0 | 14000 | 1 |
| D | 0 | 14368 | 1 |
| Mode SS | |||
|---|---|---|---|
| Quadrant | BADHDUFLAG | Total packets | Discarded packets |
| A | 0 | 130 | 0 |
| B | 0 | 130 | 0 |
| C | 0 | 130 | 0 |
| D | 0 | 130 | 0 |
| Mode M9 | |||
|---|---|---|---|
| Quadrant | BADHDUFLAG | Total packets | Discarded packets |
| A | 0 | 11 | 0 |
| B | 0 | 11 | 0 |
| C | 0 | 11 | 0 |
| D | 0 | 11 | 0 |
| Quadrant | Total seconds | Saturated seconds | Saturation percentage |
|---|---|---|---|
| A | 6362 | 1076 | 16.912920% |
| B | 6362 | 242 | 3.803835% |
| C | 6362 | 124 | 1.949073% |
| D | 6362 | 58 | 0.911663% |
Noise dominated data is calculated using 1-second bins in cleaned event files. If a bin has >2000 counts, and if more than 50% of those come from <1% of pixels, then it is considered to be noise-dominated and hence unusable.
| Quadrant | # 1 sec bins | Bins with >0 counts | Bins with >2000 counts | High rate bins dominated by noise | Noise dominated (total time) | Noise dominated (detector-on time) | Marked lightcurve |
|---|---|---|---|---|---|---|---|
| A | 7452 | 6362 | 787 | 787 | 10.56% | 12.37% | 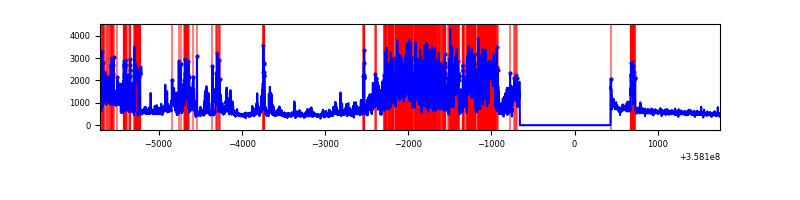 |
| B | 7452 | 6362 | 55 | 55 | 0.74% | 0.86% | 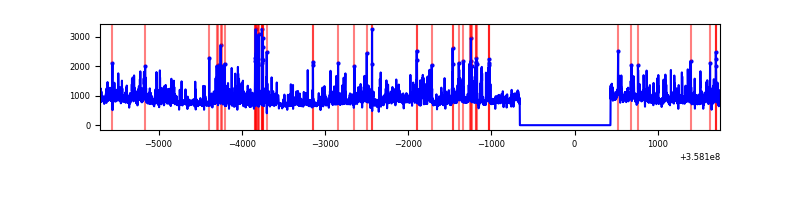 |
| C | 7452 | 6362 | 0 | 0 | 0.00% | 0.00% | 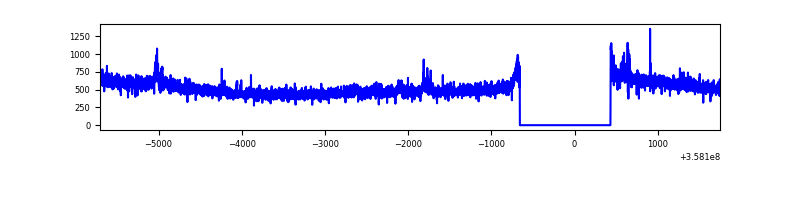 |
| D | 7452 | 6362 | 21 | 21 | 0.28% | 0.33% | 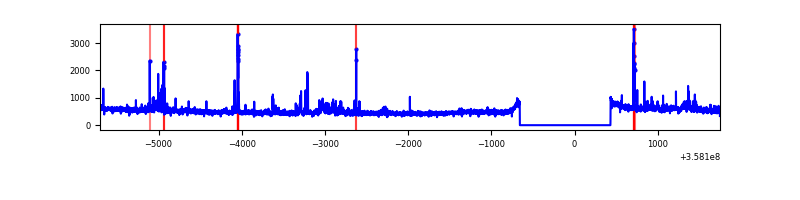 |
Top three noisy pixels from each quadrant. If the there are fewer than three noisy pixels in the level2.evt file, extra rows are filled as -1
| Pixel properties | Quadrant properties | ||||||
|---|---|---|---|---|---|---|---|
| Quadrant | DetID | PixID | Counts | Sigma | Mean | Median | Sigma |
| A | 14 | 239 | 3508410 | 22516.72 | 774 | 759 | 155.8 |
| A | 5 | 203 | 20042 | 123.78 | 774 | 759 | 155.8 |
| A | 13 | 254 | 11109 | 66.44 | 774 | 759 | 155.8 |
| B | 6 | 159 | 1667281 | 10909.63 | 795 | 774 | 152.8 |
| B | 6 | 36 | 1000186 | 6542.55 | 795 | 774 | 152.8 |
| B | 0 | 190 | 37026 | 237.32 | 795 | 774 | 152.8 |
| C | 14 | 238 | 135734 | 737.39 | 781 | 786 | 183.0 |
| C | 3 | 233 | 118447 | 642.93 | 781 | 786 | 183.0 |
| C | 2 | 114 | 15029 | 77.83 | 781 | 786 | 183.0 |
| D | 13 | 104 | 139649 | 738.46 | 794 | 775 | 188.1 |
| D | 8 | 195 | 114309 | 603.71 | 794 | 775 | 188.1 |
| D | 2 | 250 | 80259 | 422.65 | 794 | 775 | 188.1 |
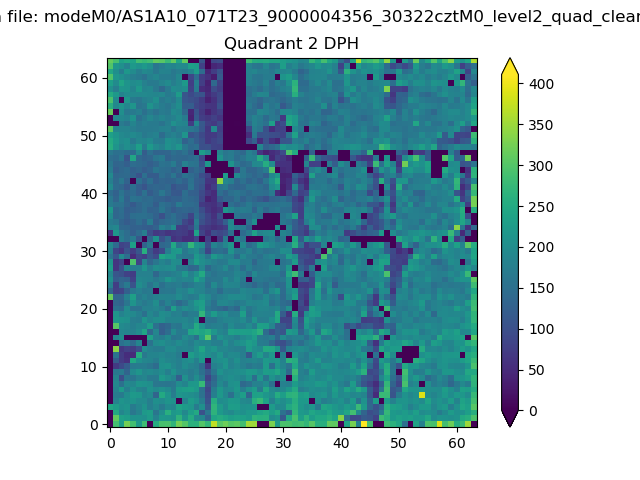
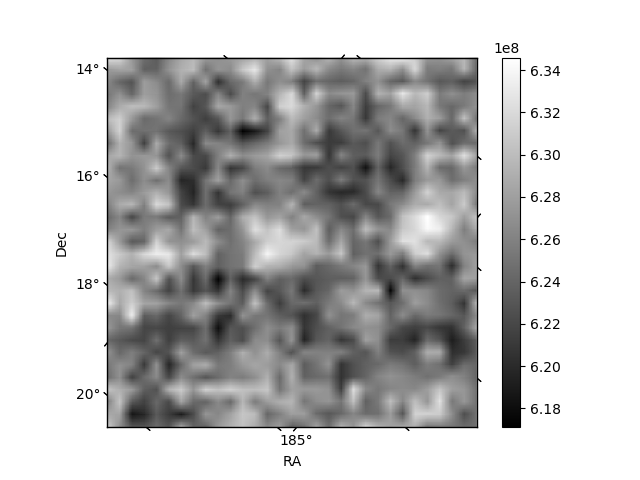
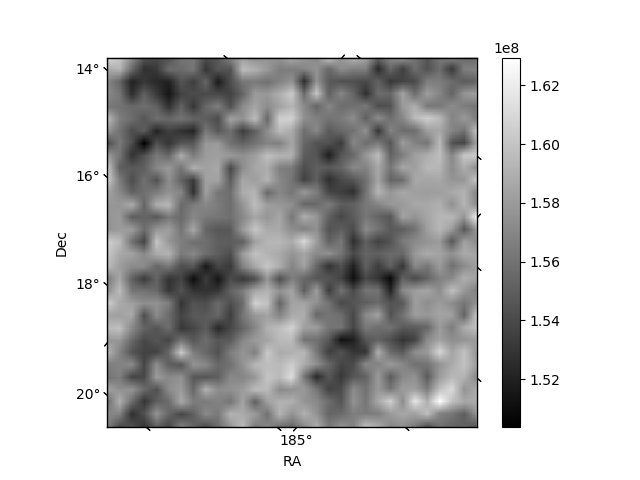
Histogram calculated using DETX and DETY for each event in the final _common_clean file
| Quadrant A | 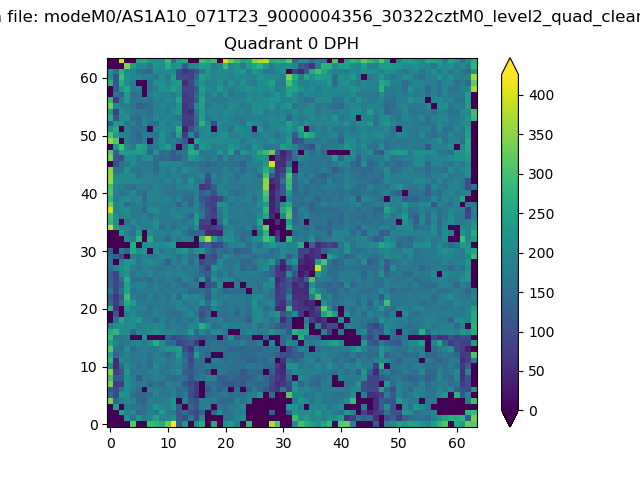 |
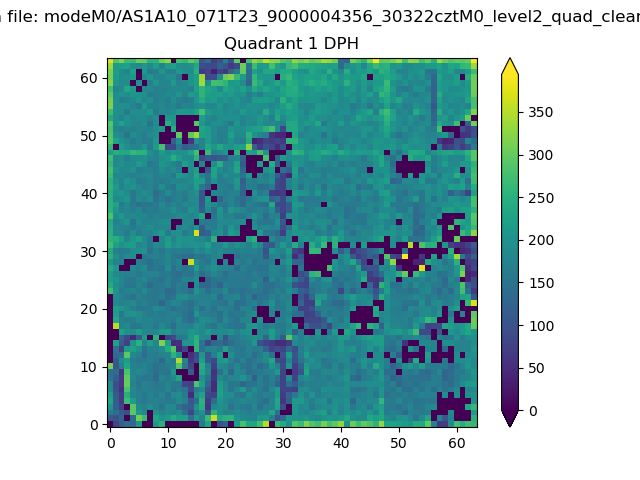 |
Quadrant B |
|---|---|---|---|
| Quadrant D | 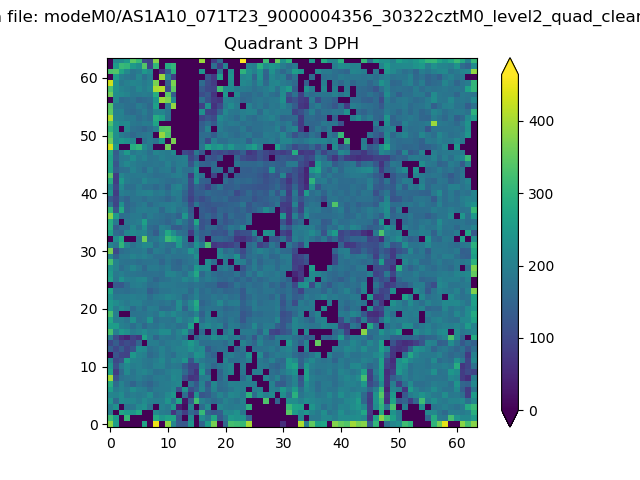 |
 |
Quadrant C |
| Plot type | Count rate plots | Images |
|---|---|---|
| Comparison with Poisson distribution Blue bars denote a histogram of data divided into 1 sec bins. Red curve is a Poisson curve with rate = median count rate of data. |
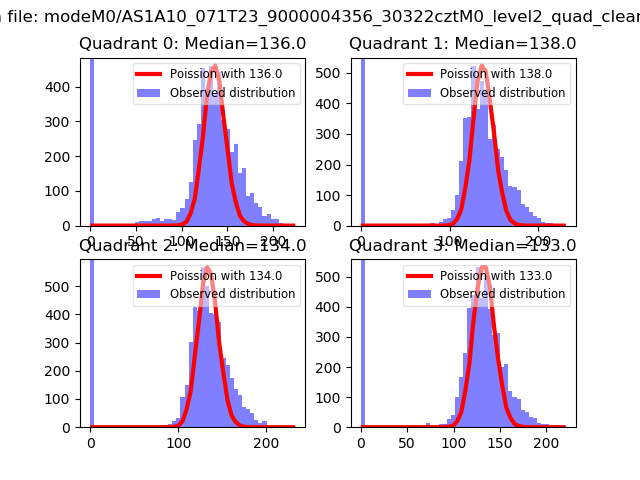 |
 |
| Quadrant-wise count rates Data is divided into 100 sec bins |
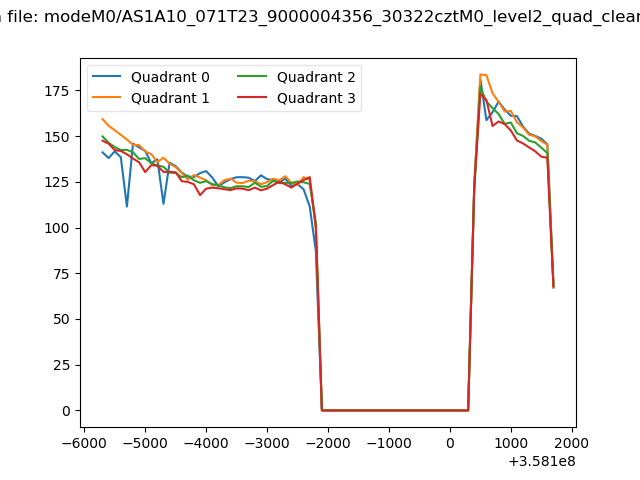 |
|
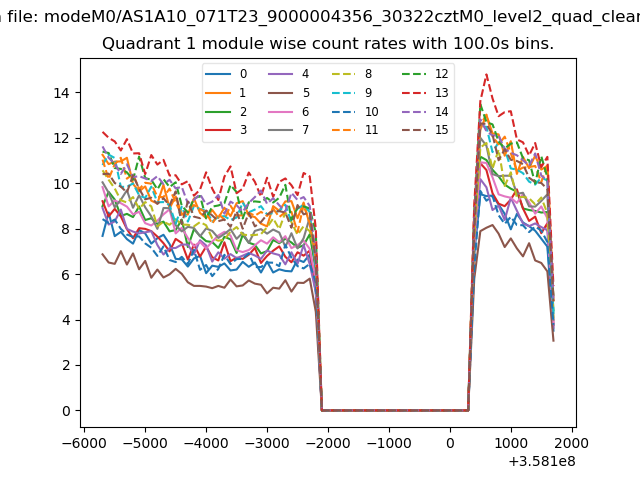
| Module-wise count rates for Quadrant A Data is divided into 100 sec bins |
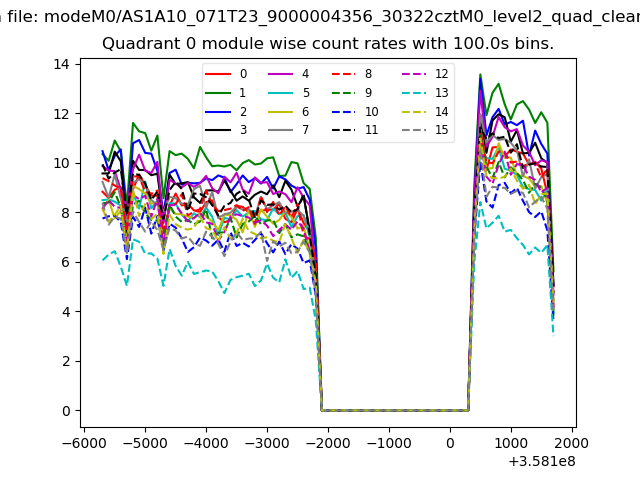 |
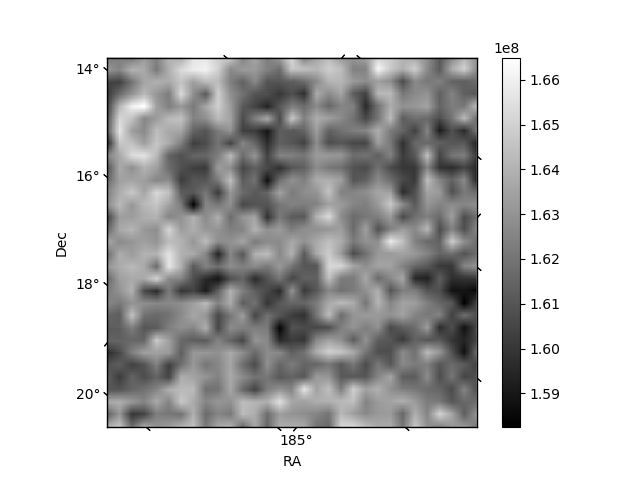 |
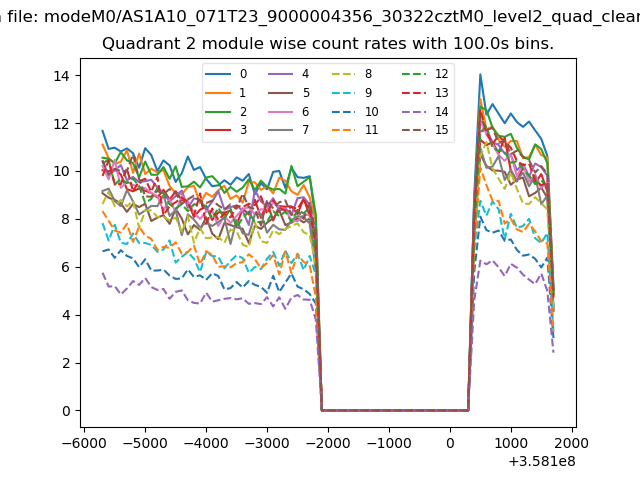
| Module-wise count rates for Quadrant B Data is divided into 100 sec bins |
 |
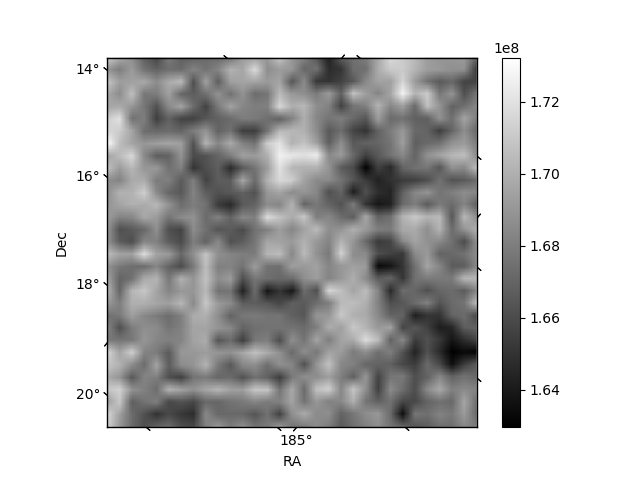 |
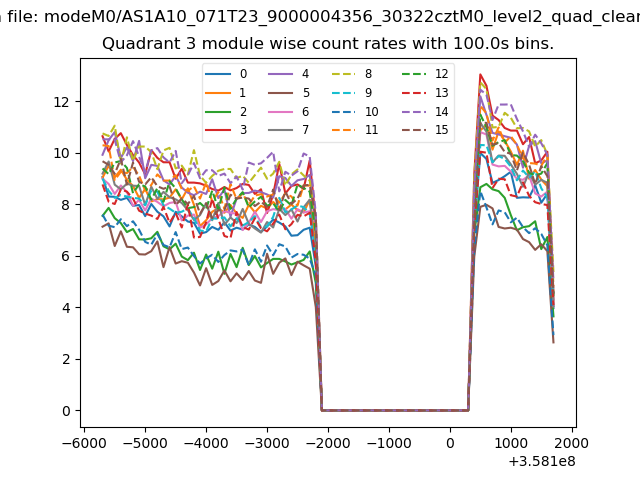
| Module-wise count rates for Quadrant C Data is divided into 100 sec bins |
 |
 |
| Module-wise count rates for Quadrant D Data is divided into 100 sec bins |
 |
 |
| Parameter | Plot |
|---|---|
| CZT HV Monitor | 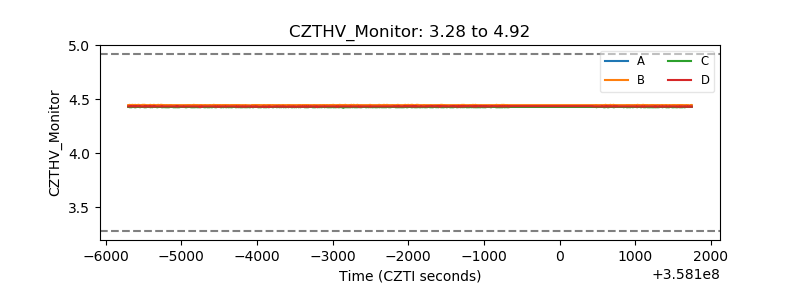 |
| D_VDD | 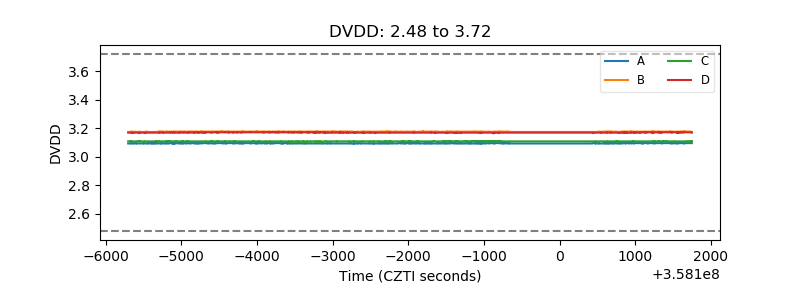 |
| Temperature 1 |  |
| Veto HV Monitor | 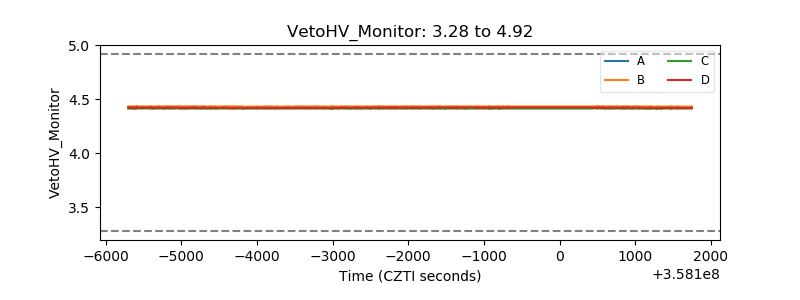 |
| Veto LLD | 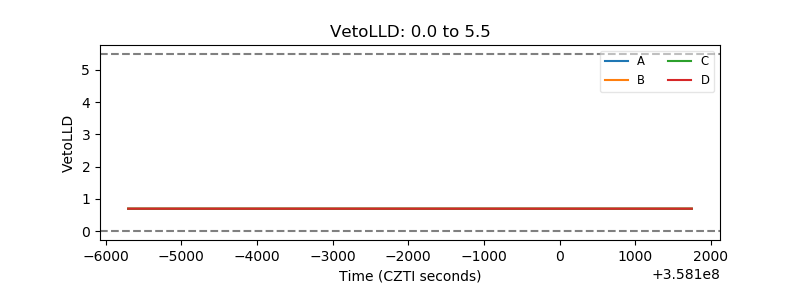 |
| Alpha Counter | 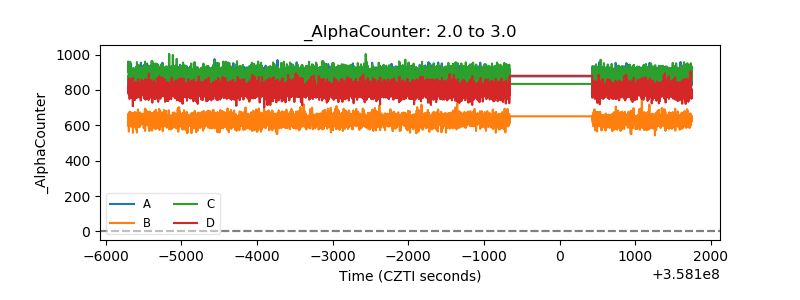 |
| _CPM_Rate | 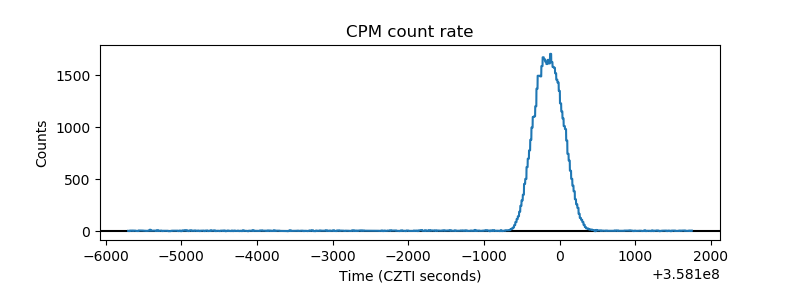 |
| CZT Counter | 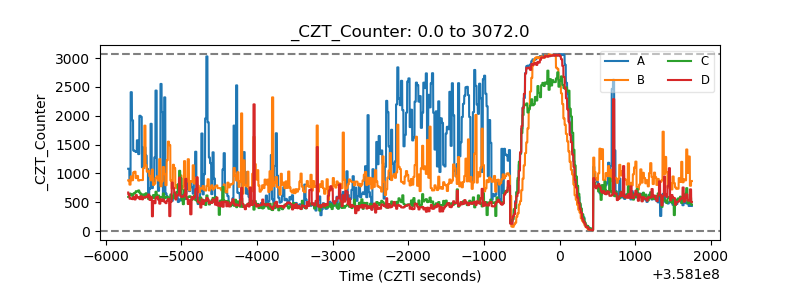 |
| +2.5 Volts monitor |  |
| +5 Volts monitor | 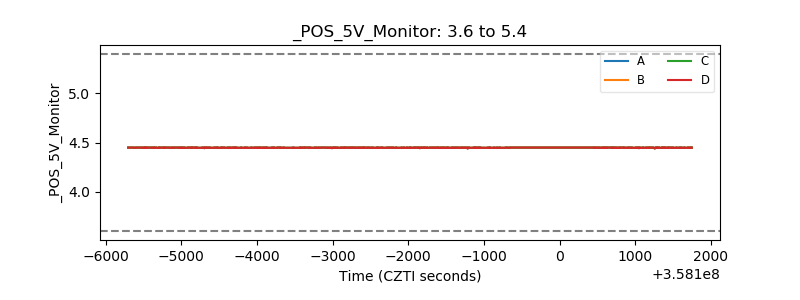 |
| _ROLL_ROT | 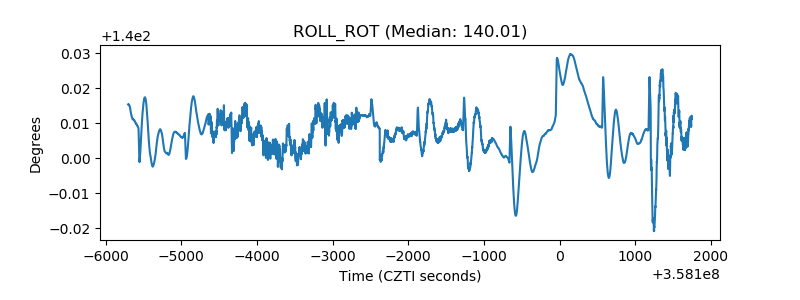 |
| _Roll_DEC | 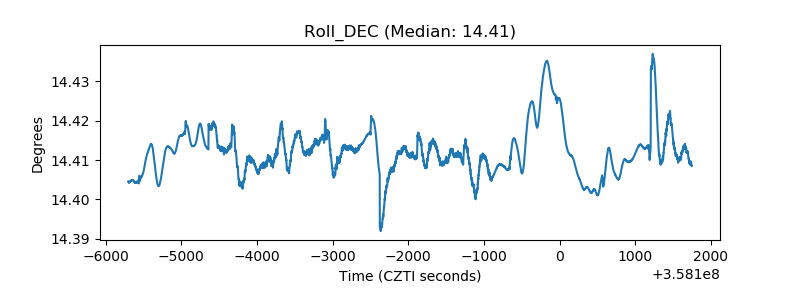 |
| _Roll_RA | 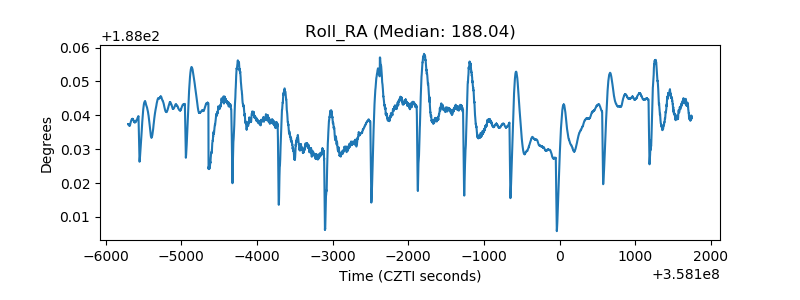 |
| Veto Counter | 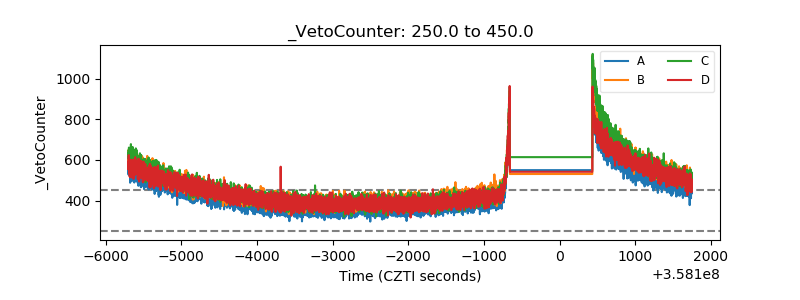 |