| Param | Original file | Final file |
|---|---|---|
| Filename | modeM0/AS1A10_071T23_9000004356_30323cztM0_level2.evt | modeM0/AS1A10_071T23_9000004356_30323cztM0_level2_quad_clean.evt |
| Size (bytes) | 200,980,800 | 49,412,160 |
| Size | 191.7 MB | 47.1 MB |
| Events in quadrant A | 1,282,852 | 338,913 |
| Events in quadrant B | 1,997,187 | 340,799 |
| Events in quadrant C | 1,238,329 | 328,918 |
| Events in quadrant D | 1,411,986 | 323,477 |
| Mode M0 | |||
|---|---|---|---|
| Quadrant | BADHDUFLAG | Total packets | Discarded packets |
| A | 0 | 5291 | 0 |
| B | 0 | 7584 | 0 |
| C | 0 | 5192 | 0 |
| D | 0 | 5773 | 0 |
| Mode SS | |||
|---|---|---|---|
| Quadrant | BADHDUFLAG | Total packets | Discarded packets |
| A | 0 | 46 | 0 |
| B | 0 | 46 | 0 |
| C | 0 | 46 | 0 |
| D | 0 | 46 | 0 |
| Quadrant | Total seconds | Saturated seconds | Saturation percentage |
|---|---|---|---|
| A | 2272 | 43 | 1.892606% |
| B | 2272 | 44 | 1.936620% |
| C | 2273 | 47 | 2.067752% |
| D | 2273 | 12 | 0.527937% |
Noise dominated data is calculated using 1-second bins in cleaned event files. If a bin has >2000 counts, and if more than 50% of those come from <1% of pixels, then it is considered to be noise-dominated and hence unusable.
| Quadrant | # 1 sec bins | Bins with >0 counts | Bins with >2000 counts | High rate bins dominated by noise | Noise dominated (total time) | Noise dominated (detector-on time) | Marked lightcurve |
|---|---|---|---|---|---|---|---|
| A | 2272 | 2272 | 28 | 28 | 1.23% | 1.23% | 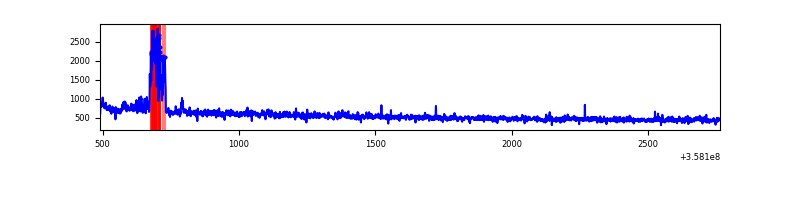 |
| B | 2272 | 2272 | 9 | 9 | 0.40% | 0.40% | 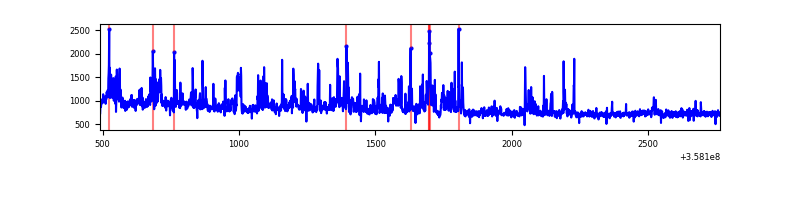 |
| C | 2273 | 2273 | 0 | 0 | 0.00% | 0.00% | 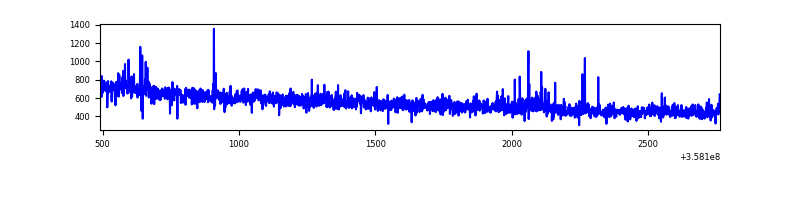 |
| D | 2273 | 2273 | 7 | 7 | 0.31% | 0.31% | 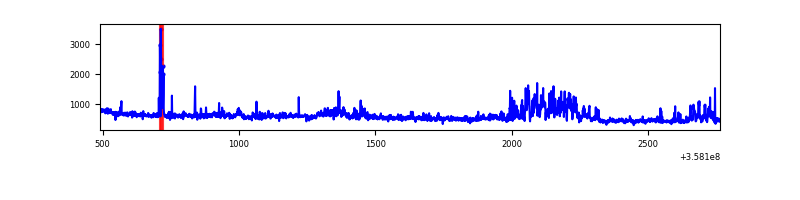 |
Top three noisy pixels from each quadrant. If the there are fewer than three noisy pixels in the level2.evt file, extra rows are filled as -1
| Pixel properties | Quadrant properties | ||||||
|---|---|---|---|---|---|---|---|
| Quadrant | DetID | PixID | Counts | Sigma | Mean | Median | Sigma |
| A | 14 | 239 | 109175 | 1750.11 | 301 | 295 | 62.2 |
| A | 5 | 203 | 9699 | 151.16 | 301 | 295 | 62.2 |
| A | 13 | 254 | 4497 | 67.54 | 301 | 295 | 62.2 |
| B | 6 | 159 | 558906 | 9757.8 | 294 | 287 | 57.2 |
| B | 6 | 36 | 244898 | 4272.8 | 294 | 287 | 57.2 |
| B | 0 | 190 | 21083 | 363.26 | 294 | 287 | 57.2 |
| C | 14 | 238 | 59302 | 851.35 | 291 | 293 | 69.3 |
| C | 3 | 233 | 23801 | 339.16 | 291 | 293 | 69.3 |
| C | 14 | 254 | 16096 | 228.0 | 291 | 293 | 69.3 |
| D | 13 | 104 | 188791 | 2636.76 | 298 | 291 | 71.5 |
| D | 8 | 195 | 43292 | 601.5 | 298 | 291 | 71.5 |
| D | 13 | 249 | 28119 | 389.26 | 298 | 291 | 71.5 |
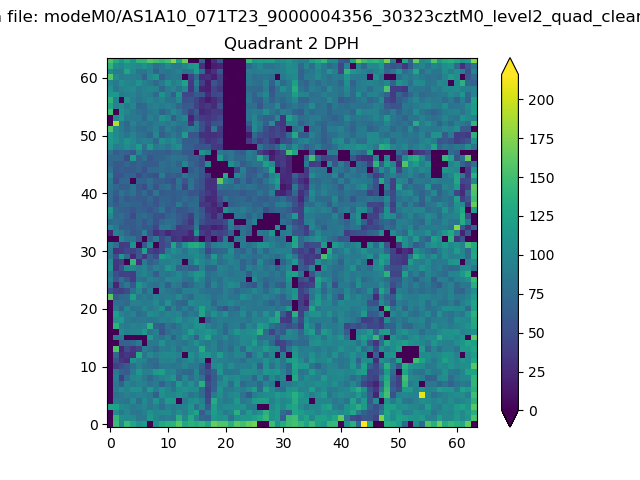
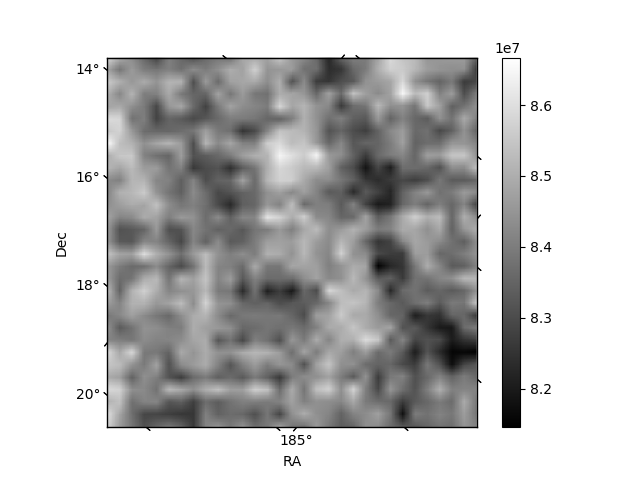
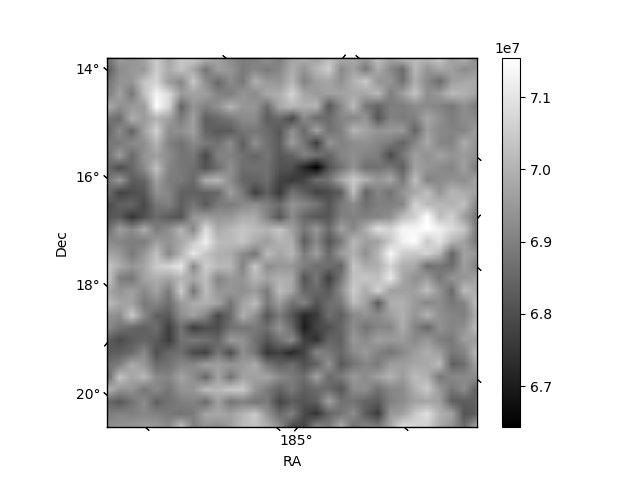
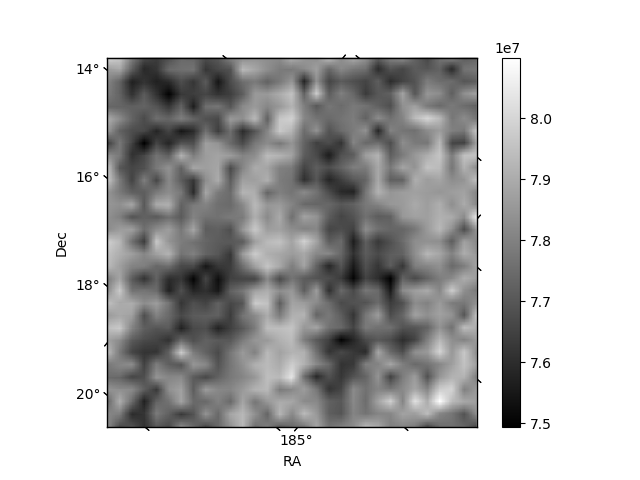
Histogram calculated using DETX and DETY for each event in the final _common_clean file
| Quadrant A | 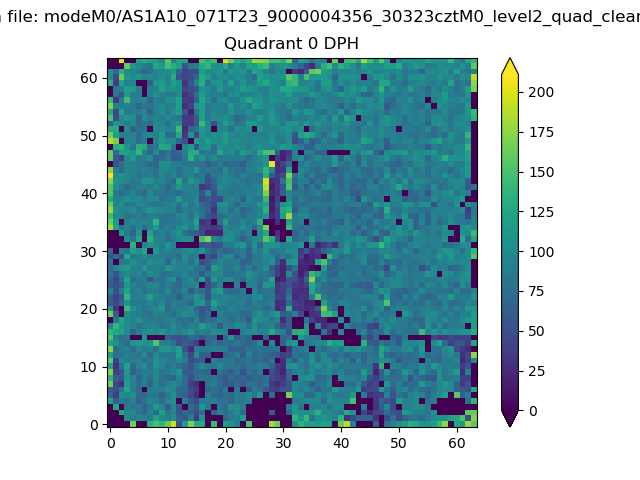 |
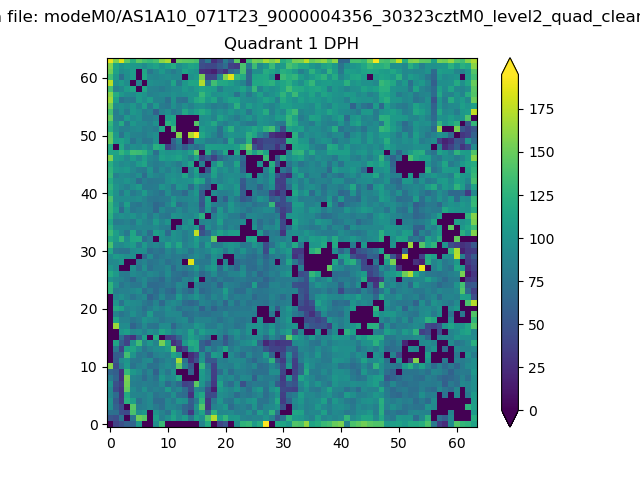 |
Quadrant B |
|---|---|---|---|
| Quadrant D | 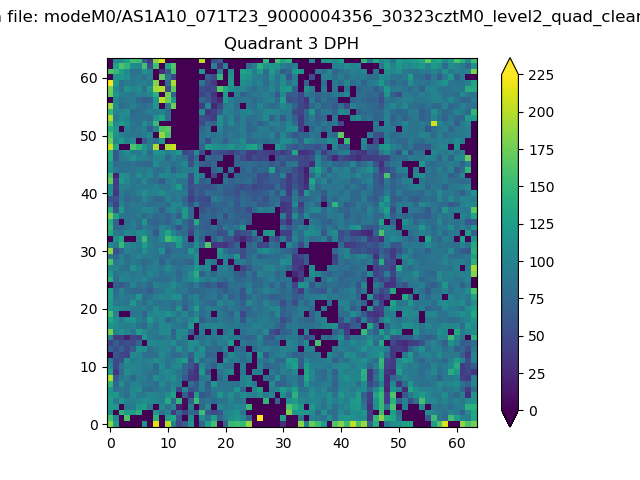 |
 |
Quadrant C |
| Plot type | Count rate plots | Images |
|---|---|---|
| Comparison with Poisson distribution Blue bars denote a histogram of data divided into 1 sec bins. Red curve is a Poisson curve with rate = median count rate of data. |
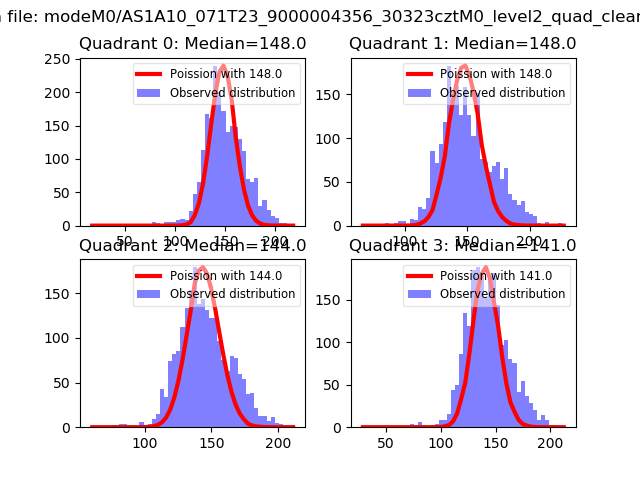 |
 |
| Quadrant-wise count rates Data is divided into 100 sec bins |
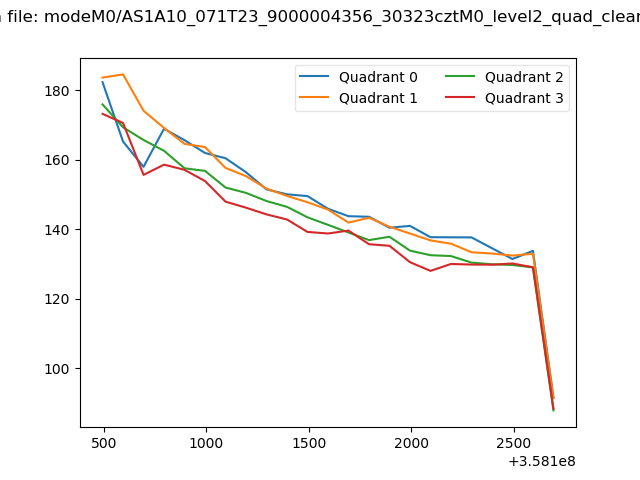 |
|
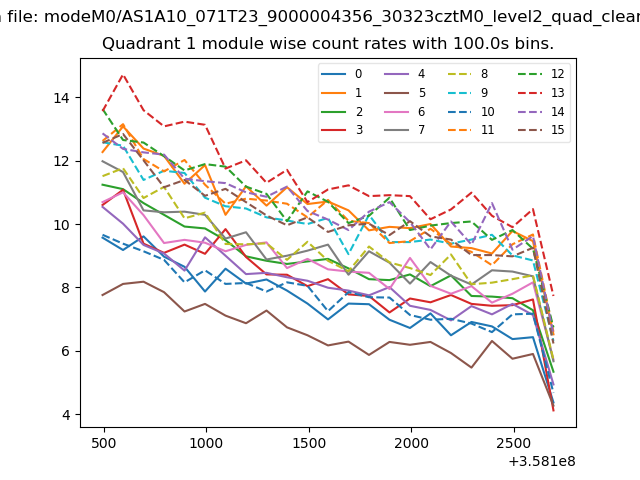
| Module-wise count rates for Quadrant A Data is divided into 100 sec bins |
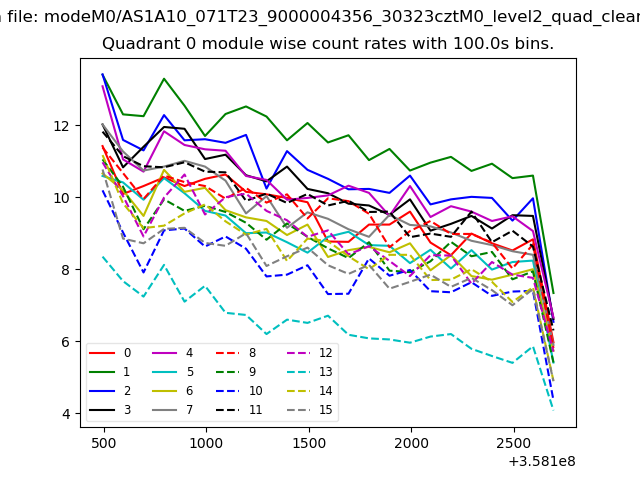 |
 |
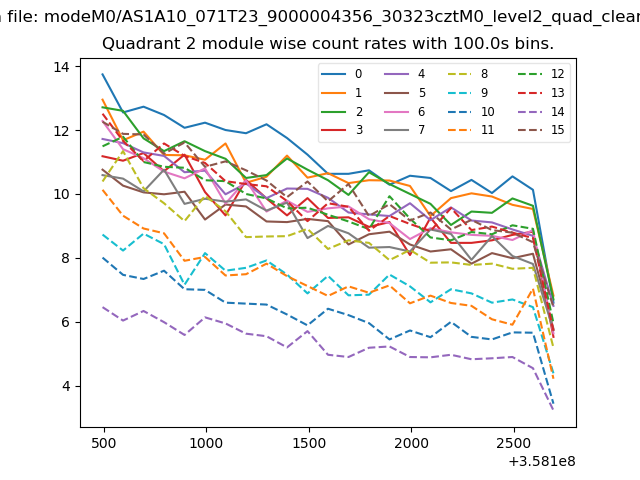
| Module-wise count rates for Quadrant B Data is divided into 100 sec bins |
 |
 |
| Module-wise count rates for Quadrant C Data is divided into 100 sec bins |
 |
 |
| Module-wise count rates for Quadrant D Data is divided into 100 sec bins |
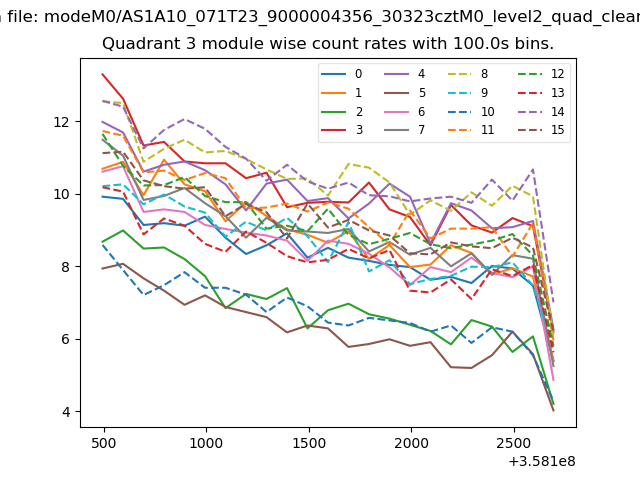 |
 |
| Parameter | Plot |
|---|---|
| CZT HV Monitor | 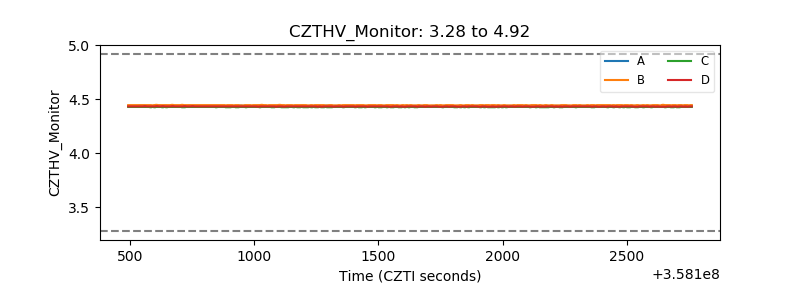 |
| D_VDD | 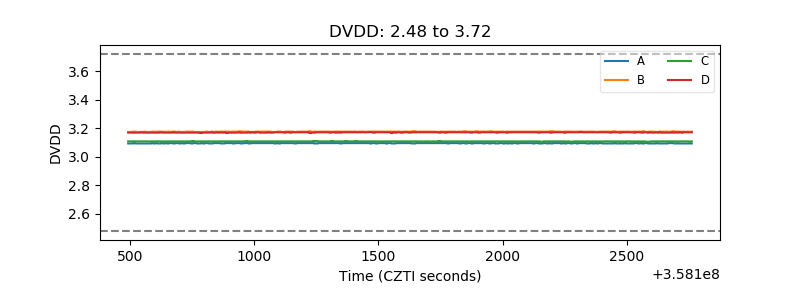 |
| Temperature 1 | 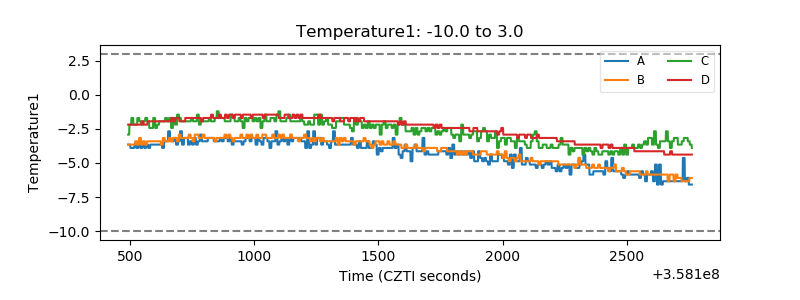 |
| Veto HV Monitor | 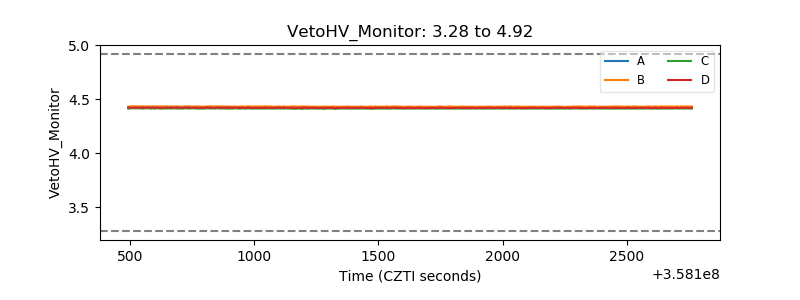 |
| Veto LLD | 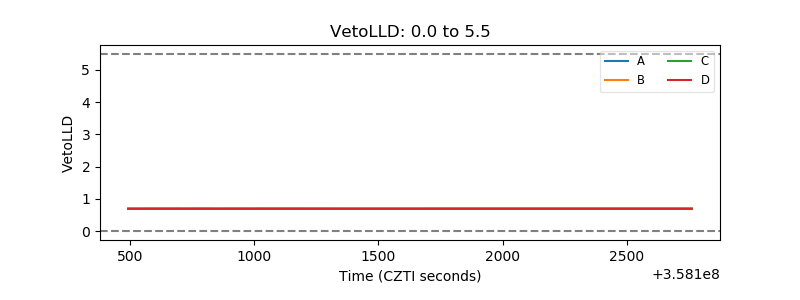 |
| Alpha Counter | 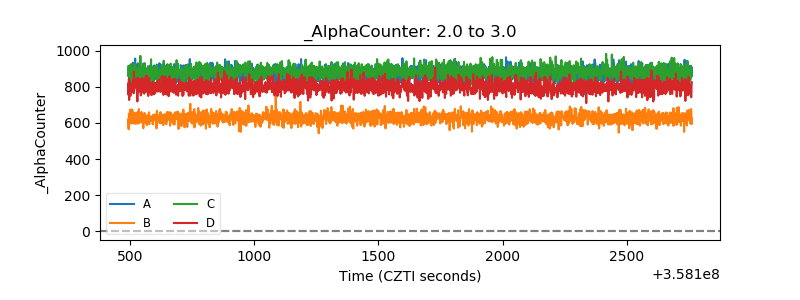 |
| _CPM_Rate | 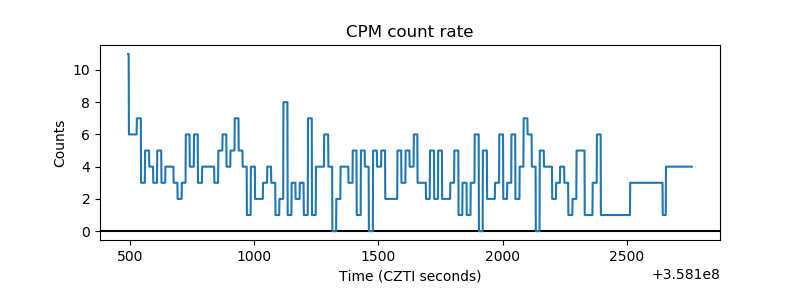 |
| CZT Counter | 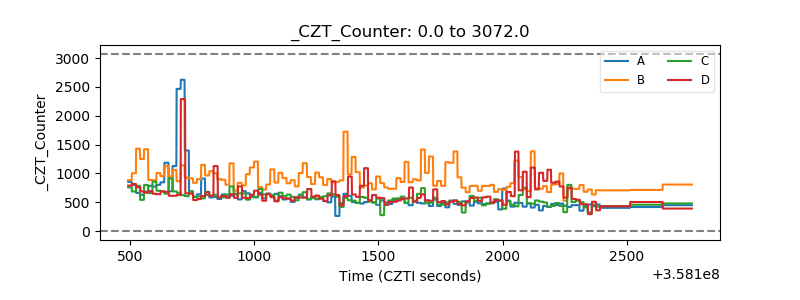 |
| +2.5 Volts monitor |  |
| +5 Volts monitor |  |
| _ROLL_ROT | 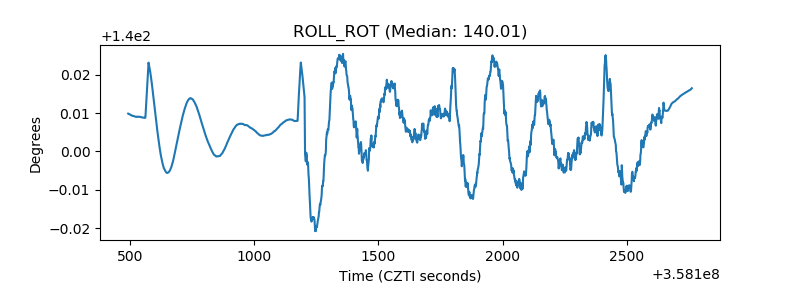 |
| _Roll_DEC | 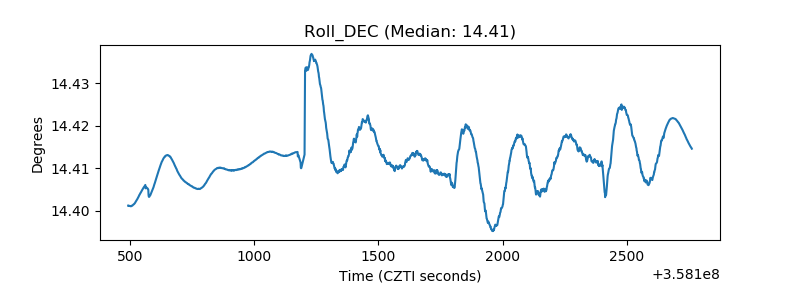 |
| _Roll_RA |  |
| Veto Counter | 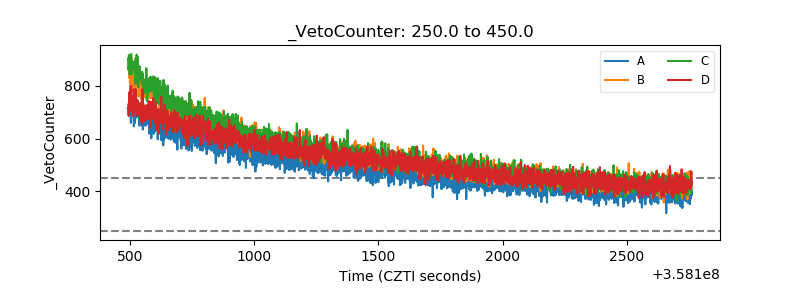 |