| Param | Original file | Final file |
|---|---|---|
| Filename | modeM0/AS1A10_071T29_9000004358cztM0_level2.fits | modeM0/AS1A10_071T29_9000004358cztM0_level2_quad_clean.evt |
| Size (bytes) | 548,320,320 | 365,857,920 |
| Size | 522.9 MB | 348.9 MB |
| Events in quadrant A | 3,405,436 | 1,927,768 |
| Events in quadrant B | 3,210,824 | 1,916,863 |
| Events in quadrant C | 3,312,106 | 1,825,793 |
| Events in quadrant D | 2,936,744 | 1,666,240 |
| Mode M9 | |||
|---|---|---|---|
| Quadrant | BADHDUFLAG | Total packets | Discarded packets |
| A | 0 | 86 | 0 |
| B | 0 | 86 | 0 |
| C | 0 | 86 | 0 |
| D | 0 | 86 | 0 |
| Mode SS | |||
|---|---|---|---|
| Quadrant | BADHDUFLAG | Total packets | Discarded packets |
| A | 0 | 1110 | 0 |
| B | 0 | 1110 | 0 |
| C | 0 | 1110 | 0 |
| D | 0 | 1110 | 0 |
| Mode M0 | |||
|---|---|---|---|
| Quadrant | BADHDUFLAG | Total packets | Discarded packets |
| A | 0 | 116384 | 0 |
| B | 0 | 170176 | 0 |
| C | 0 | 115668 | 0 |
| D | 0 | 119860 | 0 |
| Quadrant | Total seconds | Saturated seconds | Saturation percentage |
|---|---|---|---|
| A | 54530 | 815 | 1.494590% |
| B | 54530 | 1724 | 3.161562% |
| C | 54530 | 1055 | 1.934715% |
| D | 54530 | 818 | 1.500092% |
Noise dominated data is calculated using 1-second bins in cleaned event files. If a bin has >2000 counts, and if more than 50% of those come from <1% of pixels, then it is considered to be noise-dominated and hence unusable.
| Quadrant | # 1 sec bins | Bins with >0 counts | Bins with >2000 counts | High rate bins dominated by noise | Noise dominated (total time) | Noise dominated (detector-on time) | Marked lightcurve |
|---|---|---|---|---|---|---|---|
| A | 63045 | 54526 | 0 | 0 | 0.00% | 0.00% | 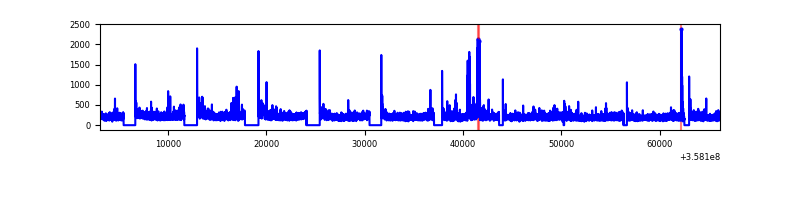 |
| B | 63045 | 54524 | 0 | 0 | 0.00% | 0.00% |  |
| C | 63045 | 54525 | 0 | 0 | 0.00% | 0.00% |  |
| D | 63045 | 54526 | 0 | 0 | 0.00% | 0.00% | 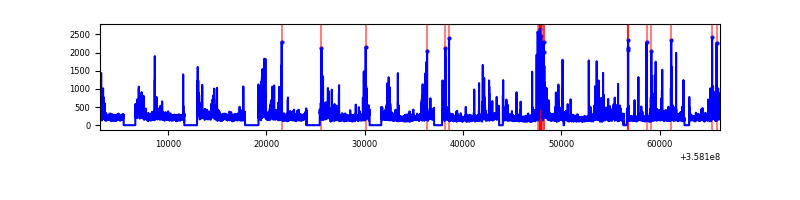 |
Top three noisy pixels from each quadrant. If the there are fewer than three noisy pixels in the level2.evt file, extra rows are filled as -1
| Pixel properties | Quadrant properties | ||||||
|---|---|---|---|---|---|---|---|
| Quadrant | DetID | PixID | Counts | Sigma | Mean | Median | Sigma |
| A | 0 | 29 | 3311 | 11.3 | 888 | 831 | 219.4 |
| A | 7 | 110 | 2737 | 8.68 | 888 | 831 | 219.4 |
| A | 9 | 19 | 2510 | 7.65 | 888 | 831 | 219.4 |
| B | 2 | 9 | 2535 | 10.25 | 846 | 806 | 168.7 |
| B | 3 | 17 | 2159 | 8.02 | 846 | 806 | 168.7 |
| B | 2 | 8 | 2109 | 7.72 | 846 | 806 | 168.7 |
| C | 3 | 126 | 2276 | 6.48 | 876 | 818 | 224.8 |
| C | 12 | 241 | 2263 | 6.43 | 876 | 818 | 224.8 |
| C | 9 | 209 | 2259 | 6.41 | 876 | 818 | 224.8 |
| D | 15 | 46 | 2230 | 6.48 | 838 | 760 | 226.9 |
| D | 3 | 14 | 2101 | 5.91 | 838 | 760 | 226.9 |
| D | 7 | 3 | 2005 | 5.49 | 838 | 760 | 226.9 |
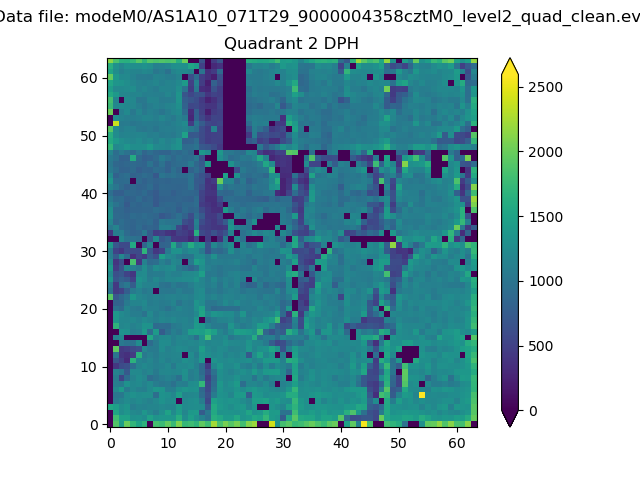
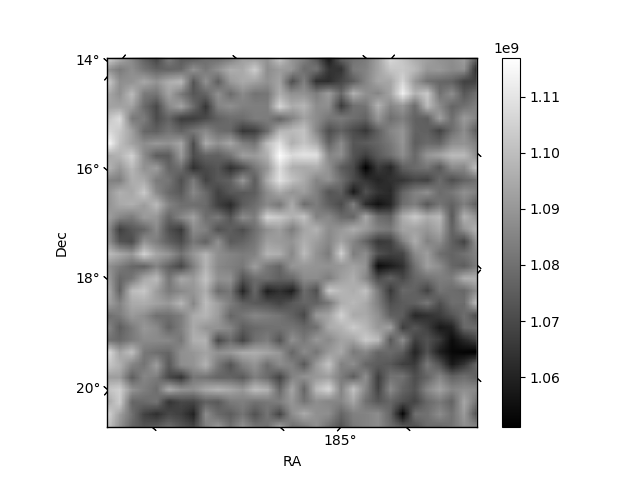
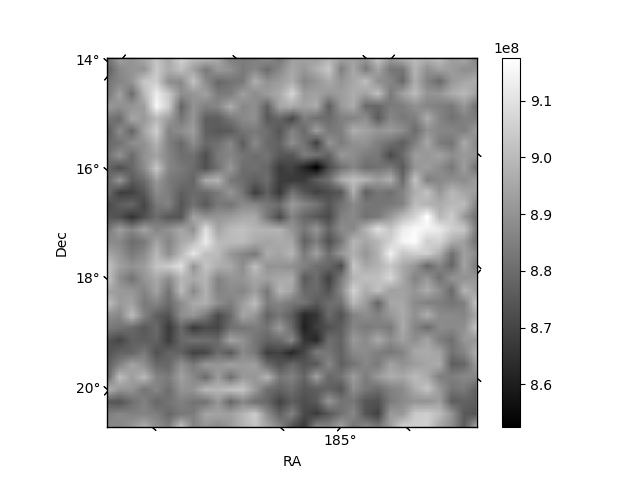
Histogram calculated using DETX and DETY for each event in the final _common_clean file
| Quadrant A | 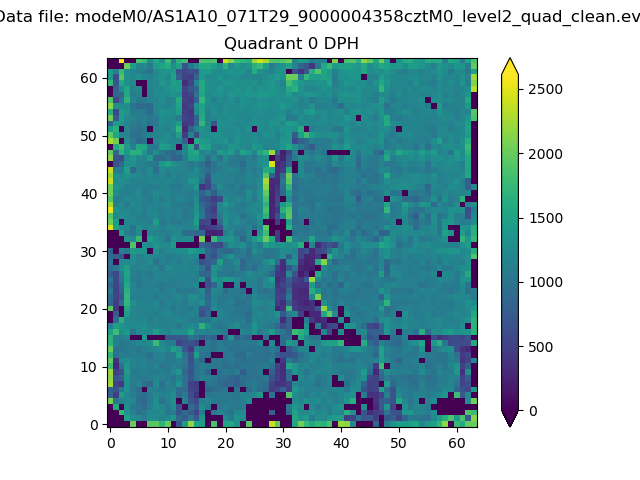 |
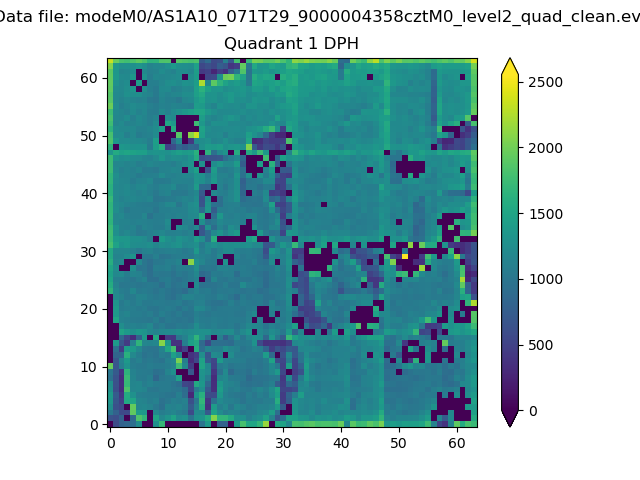 |
Quadrant B |
|---|---|---|---|
| Quadrant D | 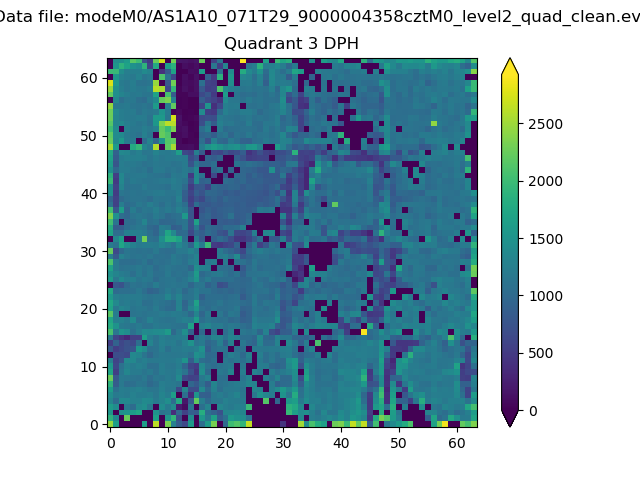 |
 |
Quadrant C |
| Plot type | Count rate plots | Images |
|---|---|---|
| Comparison with Poisson distribution Blue bars denote a histogram of data divided into 1 sec bins. Red curve is a Poisson curve with rate = median count rate of data. |
 |
 |
| Quadrant-wise count rates Data is divided into 100 sec bins |
 |
|
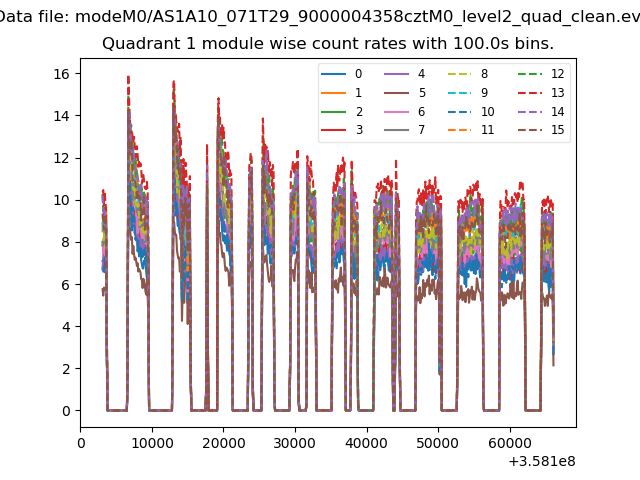
| Module-wise count rates for Quadrant A Data is divided into 100 sec bins |
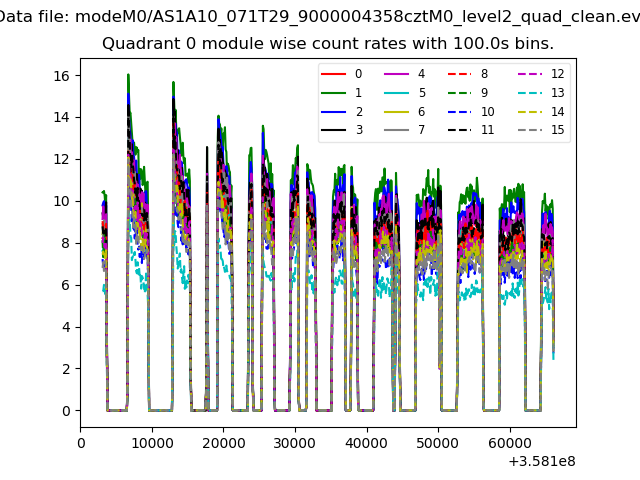 |
 |
| Module-wise count rates for Quadrant B Data is divided into 100 sec bins |
 |
 |
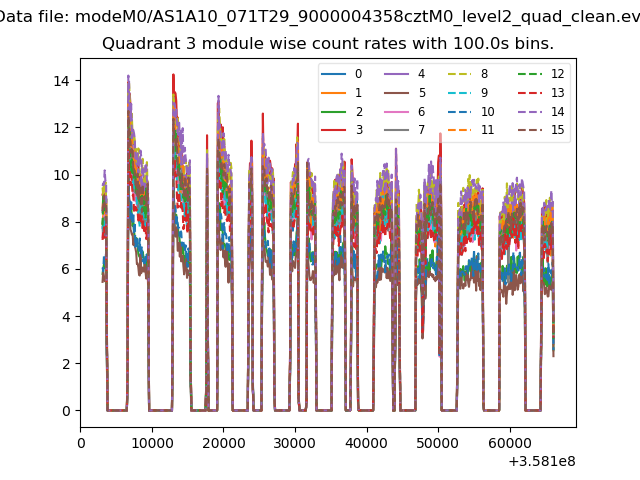
| Module-wise count rates for Quadrant C Data is divided into 100 sec bins |
 |
 |
| Module-wise count rates for Quadrant D Data is divided into 100 sec bins |
 |
 |
| Parameter | Plot |
|---|---|
| CZT HV Monitor | 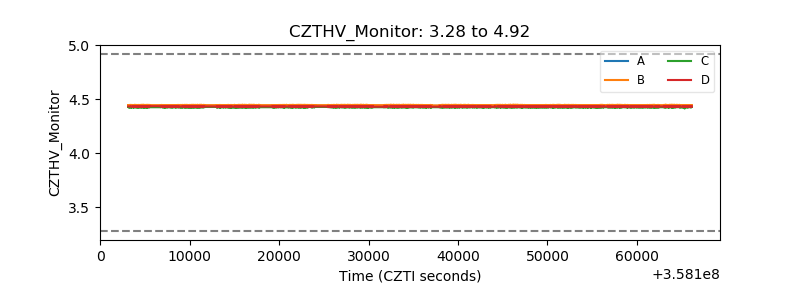 |
| D_VDD | 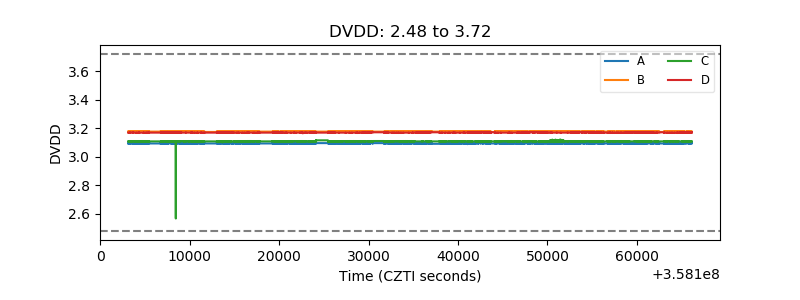 |
| Temperature 1 | 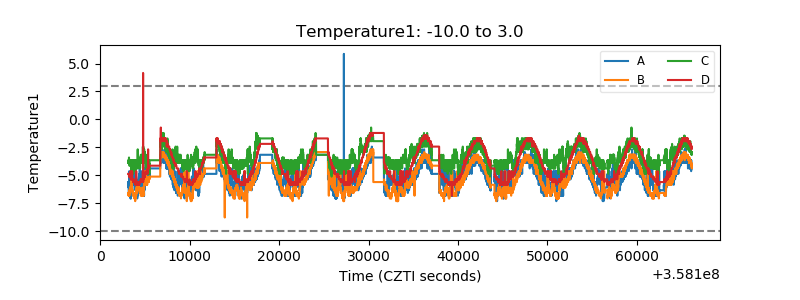 |
| Veto HV Monitor |  |
| Veto LLD | 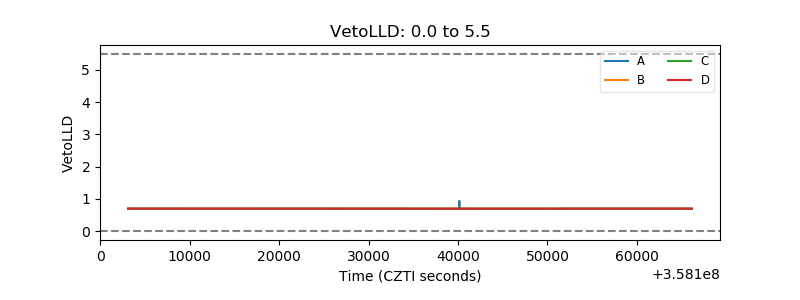 |
| Alpha Counter |  |
| _CPM_Rate |  |
| CZT Counter | 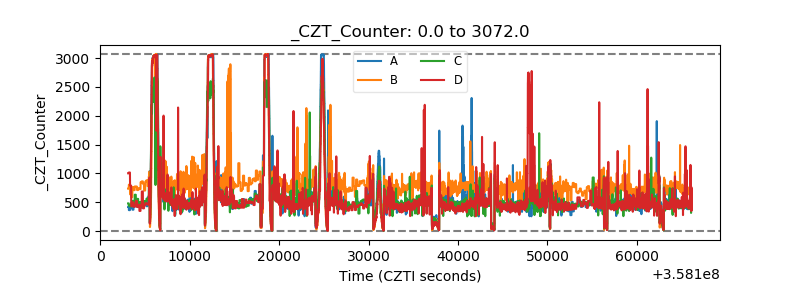 |
| +2.5 Volts monitor | 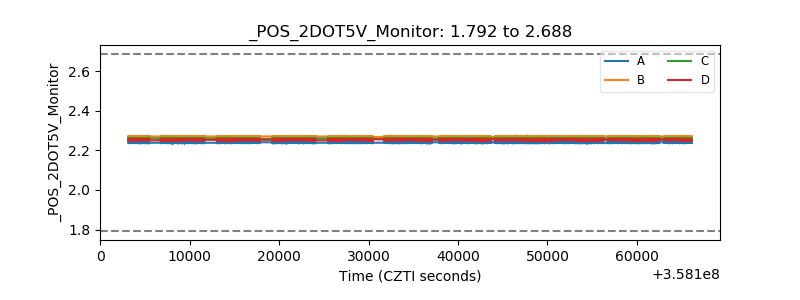 |
| +5 Volts monitor | 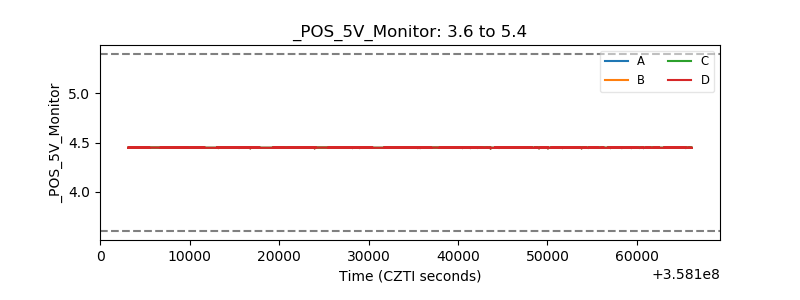 |
| _ROLL_ROT | 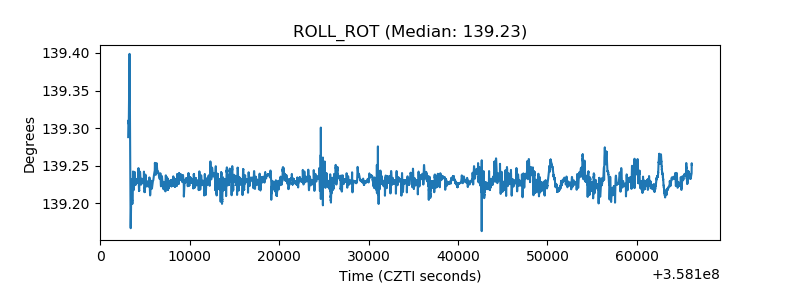 |
| _Roll_DEC | 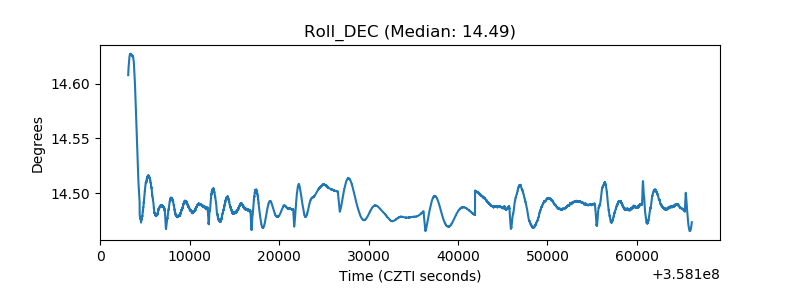 |
| _Roll_RA |  |
| Veto Counter |  |