| Param | Original file | Final file |
|---|---|---|
| Filename | modeM0/AS1A10_071T29_9000004358_30323cztM0_level2.evt | modeM0/AS1A10_071T29_9000004358_30323cztM0_level2_quad_clean.evt |
| Size (bytes) | 309,294,720 | 48,839,040 |
| Size | 295.0 MB | 46.6 MB |
| Events in quadrant A | 1,948,052 | 309,023 |
| Events in quadrant B | 3,100,651 | 312,757 |
| Events in quadrant C | 2,058,001 | 301,390 |
| Events in quadrant D | 2,008,694 | 294,409 |
| Mode M9 | |||
|---|---|---|---|
| Quadrant | BADHDUFLAG | Total packets | Discarded packets |
| A | 0 | 12 | 0 |
| B | 0 | 12 | 0 |
| C | 0 | 12 | 0 |
| D | 0 | 12 | 0 |
| Mode SS | |||
|---|---|---|---|
| Quadrant | BADHDUFLAG | Total packets | Discarded packets |
| A | 0 | 76 | 0 |
| B | 0 | 76 | 0 |
| C | 0 | 76 | 0 |
| D | 0 | 76 | 0 |
| Mode M0 | |||
|---|---|---|---|
| Quadrant | BADHDUFLAG | Total packets | Discarded packets |
| A | 0 | 8116 | 2 |
| B | 0 | 11763 | 1 |
| C | 0 | 8403 | 1 |
| D | 0 | 8470 | 1 |
| Quadrant | Total seconds | Saturated seconds | Saturation percentage |
|---|---|---|---|
| A | 3689 | 68 | 1.843318% |
| B | 3689 | 124 | 3.361345% |
| C | 3689 | 141 | 3.822174% |
| D | 3689 | 50 | 1.355381% |
Noise dominated data is calculated using 1-second bins in cleaned event files. If a bin has >2000 counts, and if more than 50% of those come from <1% of pixels, then it is considered to be noise-dominated and hence unusable.
| Quadrant | # 1 sec bins | Bins with >0 counts | Bins with >2000 counts | High rate bins dominated by noise | Noise dominated (total time) | Noise dominated (detector-on time) | Marked lightcurve |
|---|---|---|---|---|---|---|---|
| A | 4879 | 3689 | 1 | 1 | 0.02% | 0.03% | 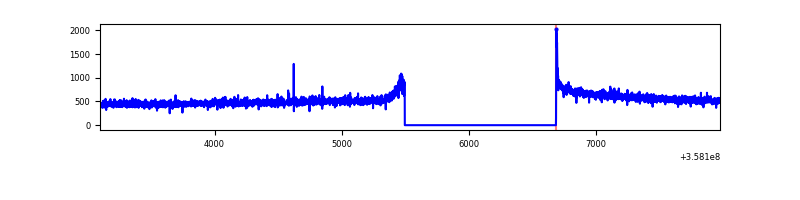 |
| B | 4879 | 3689 | 5 | 5 | 0.10% | 0.14% | 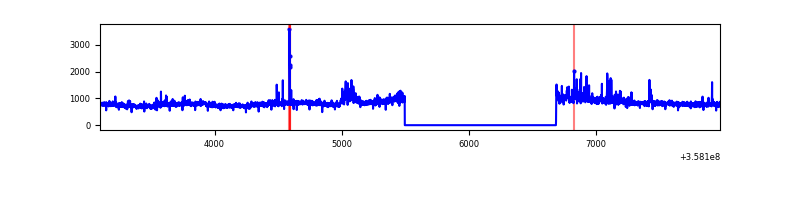 |
| C | 4879 | 3689 | 0 | 0 | 0.00% | 0.00% | 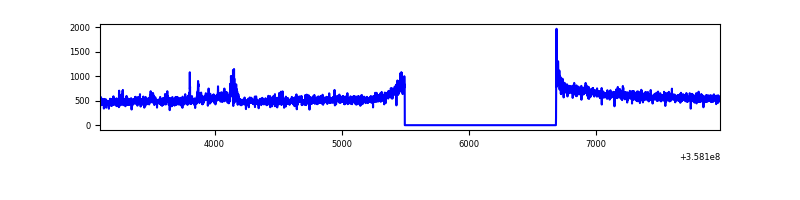 |
| D | 4879 | 3689 | 4 | 4 | 0.08% | 0.11% | 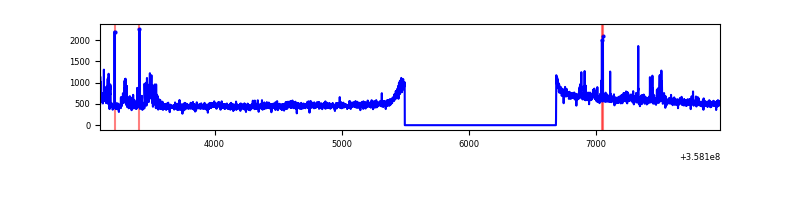 |
Top three noisy pixels from each quadrant. If the there are fewer than three noisy pixels in the level2.evt file, extra rows are filled as -1
| Pixel properties | Quadrant properties | ||||||
|---|---|---|---|---|---|---|---|
| Quadrant | DetID | PixID | Counts | Sigma | Mean | Median | Sigma |
| A | 5 | 203 | 20862 | 204.36 | 495 | 486 | 99.7 |
| A | 8 | 192 | 11465 | 110.11 | 495 | 486 | 99.7 |
| A | 13 | 254 | 6852 | 63.85 | 495 | 486 | 99.7 |
| B | 6 | 159 | 999516 | 10675.52 | 487 | 474 | 93.6 |
| B | 6 | 36 | 177801 | 1894.87 | 487 | 474 | 93.6 |
| B | 12 | 111 | 11523 | 118.07 | 487 | 474 | 93.6 |
| C | 14 | 238 | 93726 | 830.83 | 475 | 478 | 112.2 |
| C | 3 | 233 | 82840 | 733.84 | 475 | 478 | 112.2 |
| C | 14 | 254 | 20599 | 179.28 | 475 | 478 | 112.2 |
| D | 13 | 104 | 111446 | 977.27 | 480 | 469 | 113.6 |
| D | 8 | 195 | 45851 | 399.64 | 480 | 469 | 113.6 |
| D | 2 | 250 | 26047 | 225.24 | 480 | 469 | 113.6 |
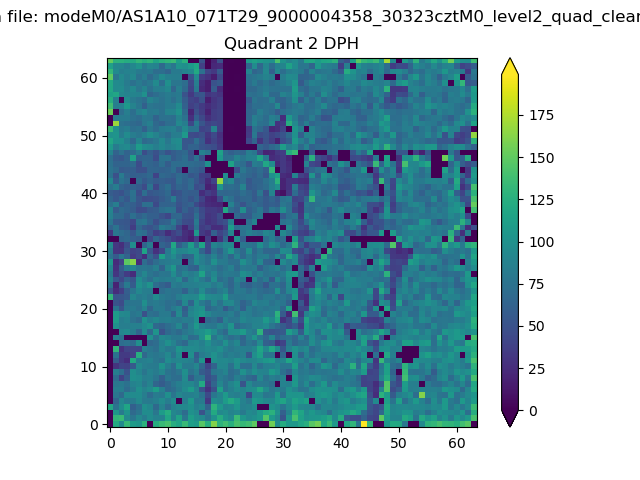
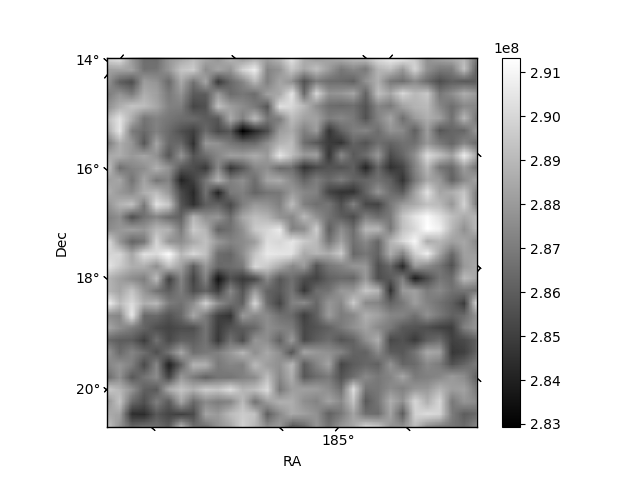
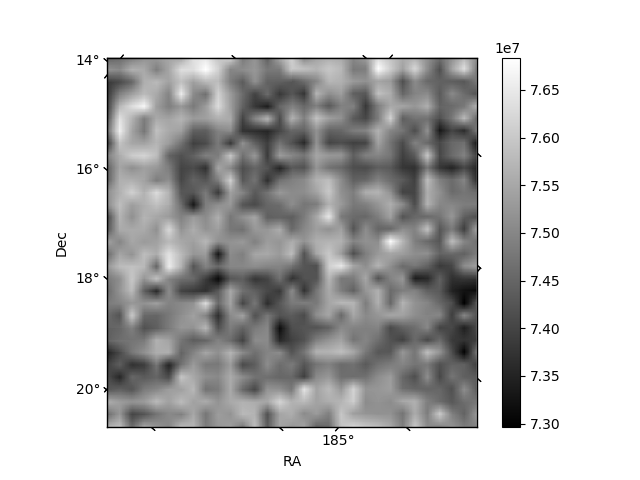
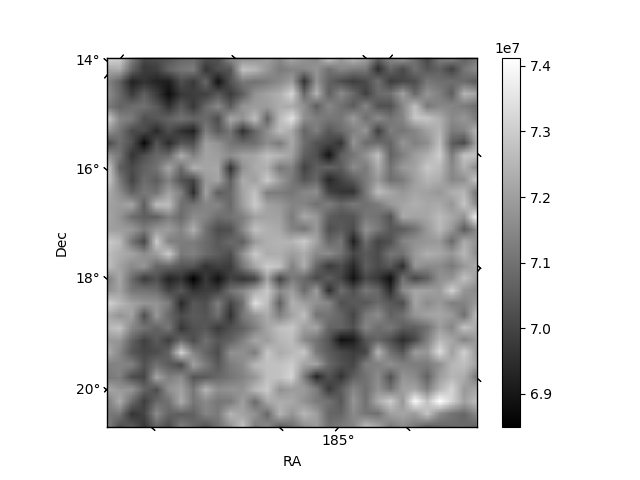
Histogram calculated using DETX and DETY for each event in the final _common_clean file
| Quadrant A | 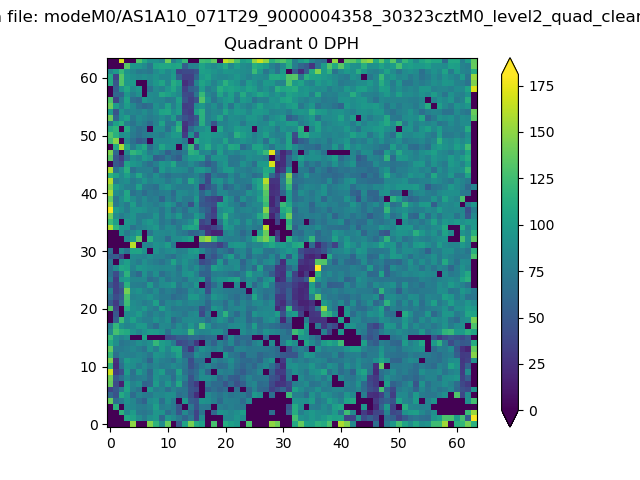 |
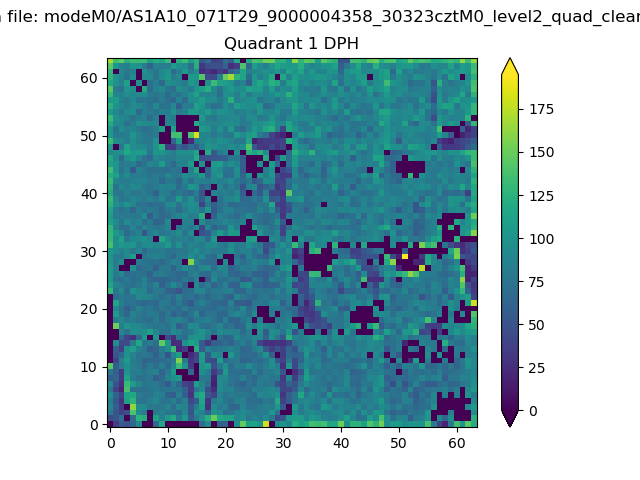 |
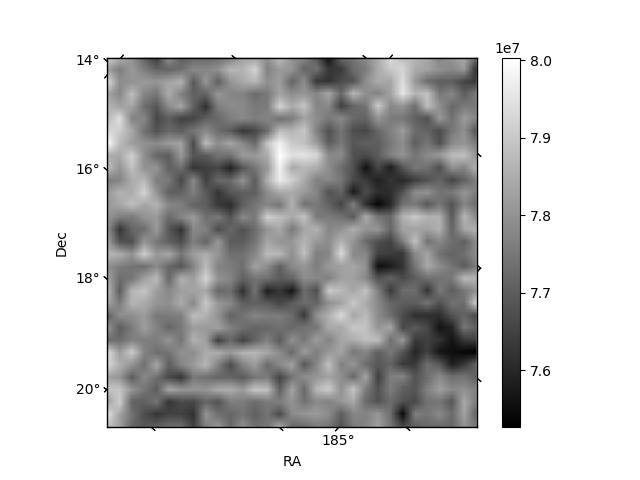
Quadrant B |
|---|---|---|---|
| Quadrant D | 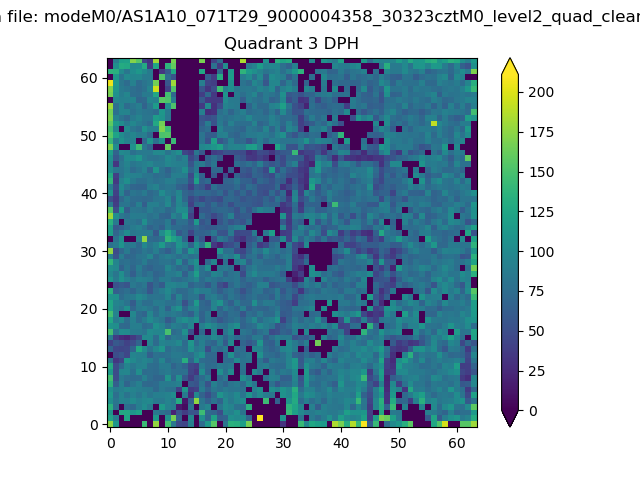 |
 |
Quadrant C |
| Plot type | Count rate plots | Images |
|---|---|---|
| Comparison with Poisson distribution Blue bars denote a histogram of data divided into 1 sec bins. Red curve is a Poisson curve with rate = median count rate of data. |
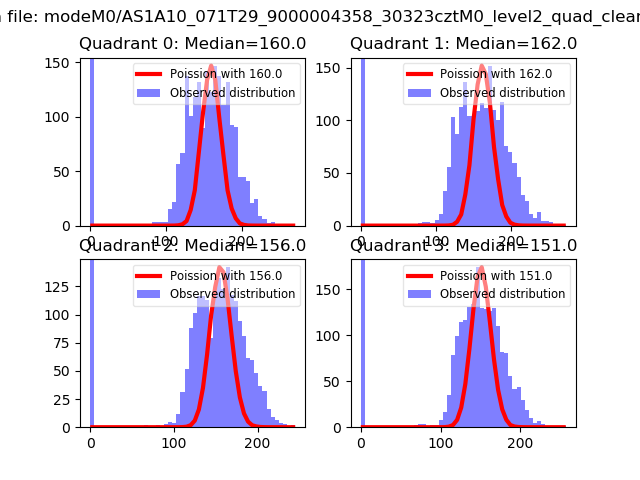 |
 |
| Quadrant-wise count rates Data is divided into 100 sec bins |
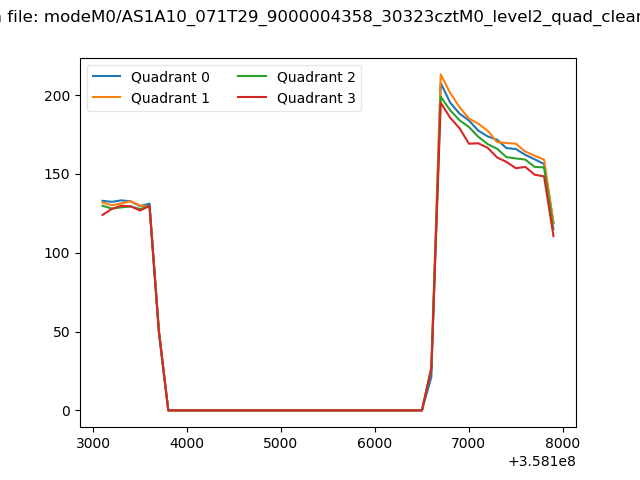 |
|
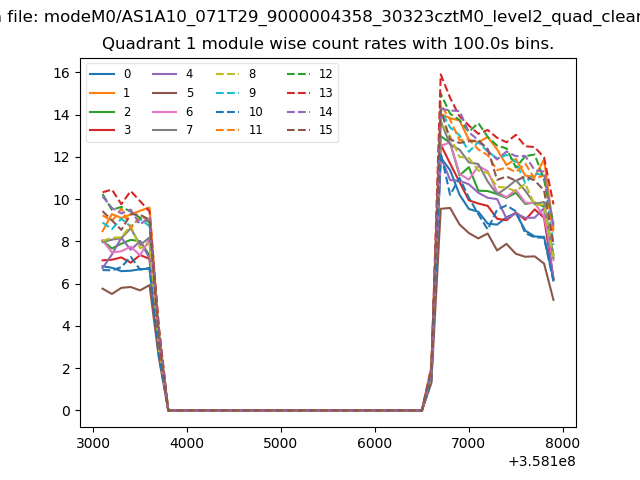
| Module-wise count rates for Quadrant A Data is divided into 100 sec bins |
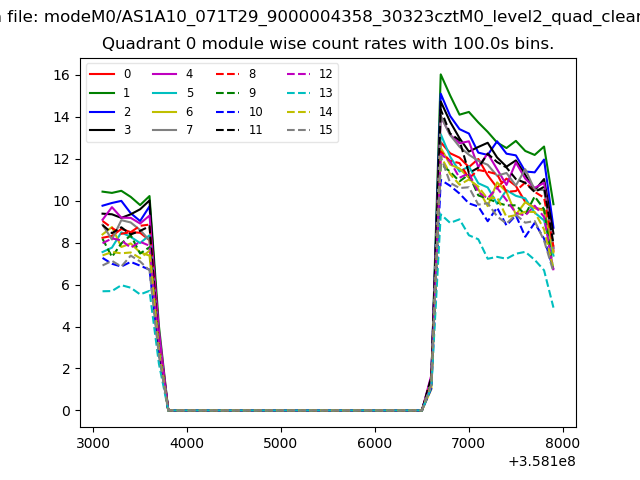 |
 |
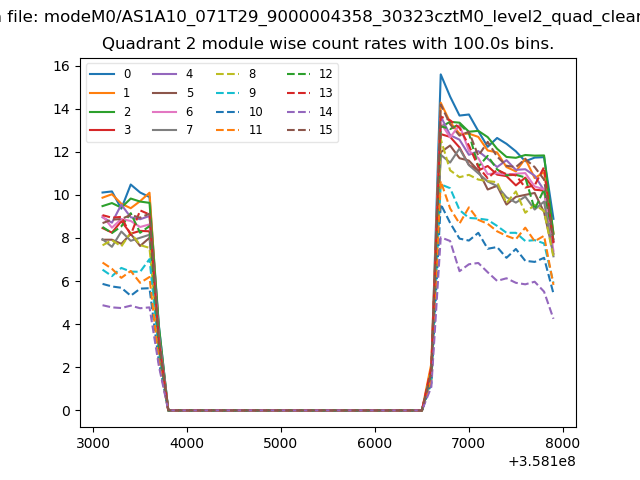
| Module-wise count rates for Quadrant B Data is divided into 100 sec bins |
 |
 |
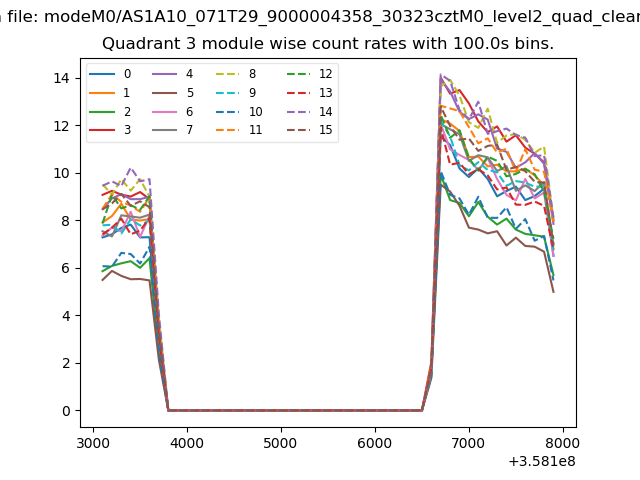
| Module-wise count rates for Quadrant C Data is divided into 100 sec bins |
 |
 |
| Module-wise count rates for Quadrant D Data is divided into 100 sec bins |
 |
 |
| Parameter | Plot |
|---|---|
| CZT HV Monitor | 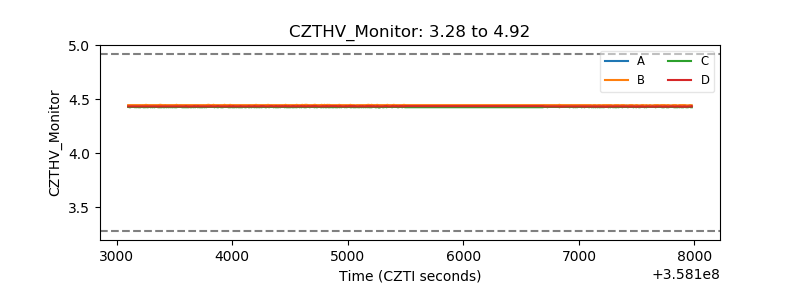 |
| D_VDD | 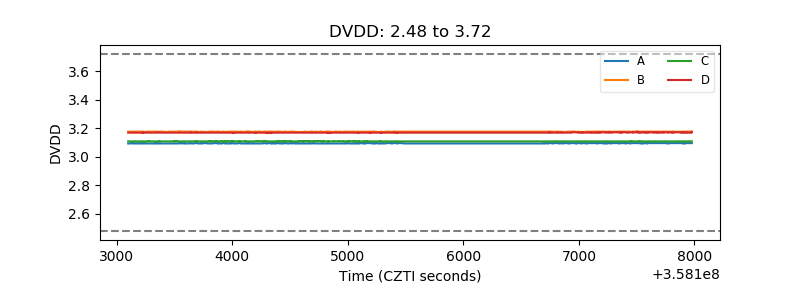 |
| Temperature 1 | 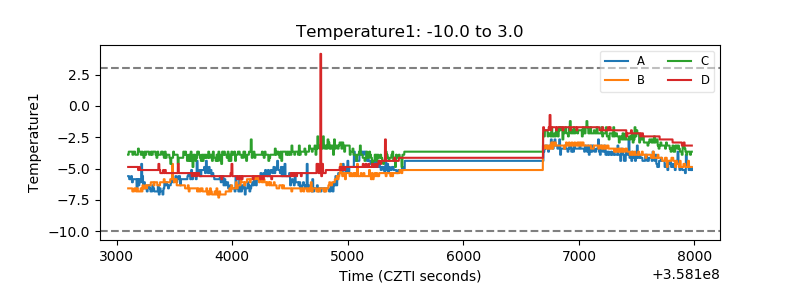 |
| Veto HV Monitor | 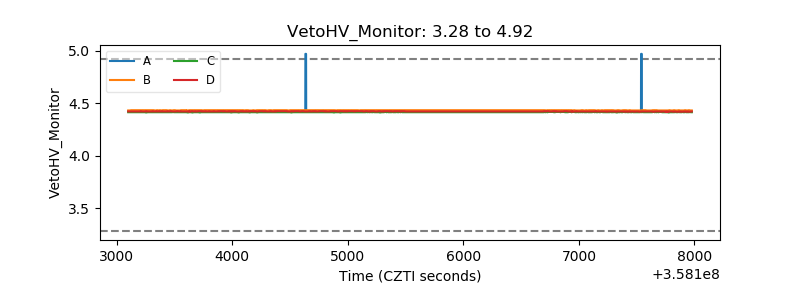 |
| Veto LLD | 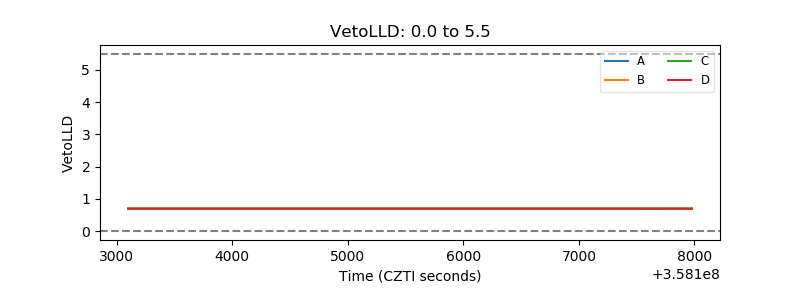 |
| Alpha Counter | 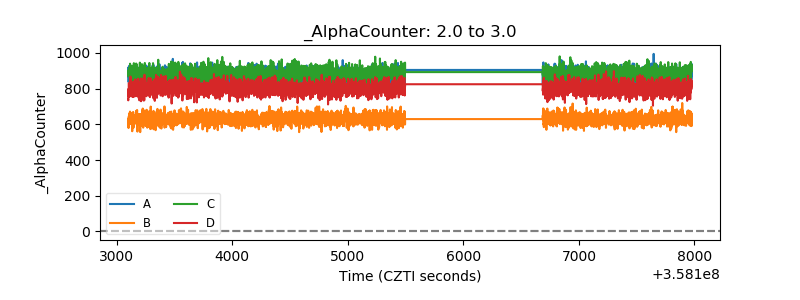 |
| _CPM_Rate | 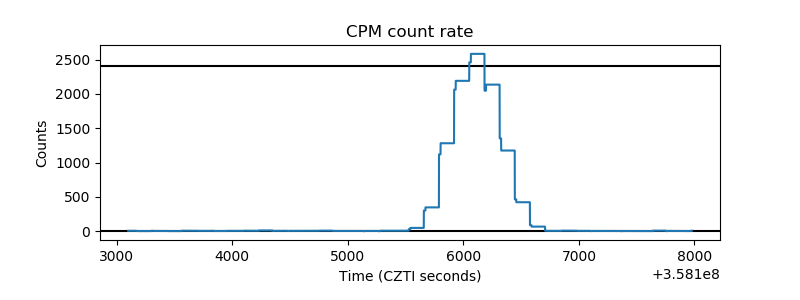 |
| CZT Counter | 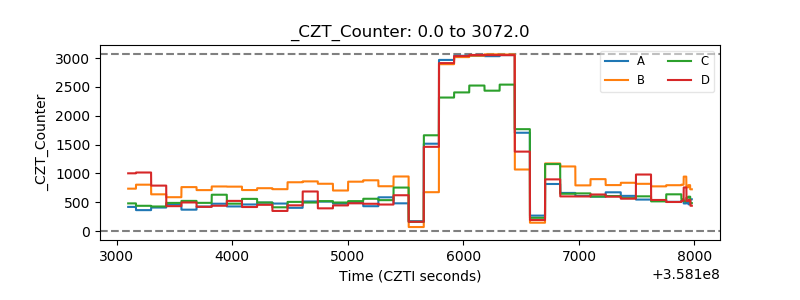 |
| +2.5 Volts monitor |  |
| +5 Volts monitor |  |
| _ROLL_ROT | 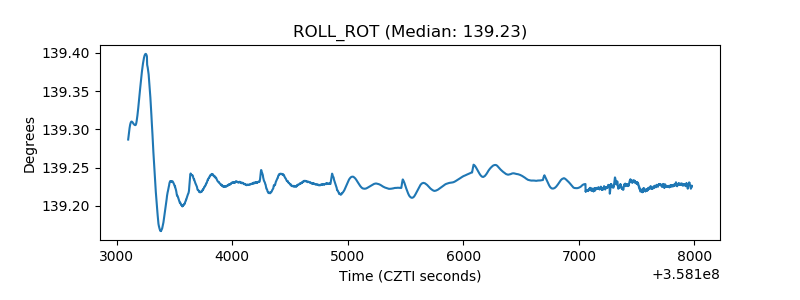 |
| _Roll_DEC | 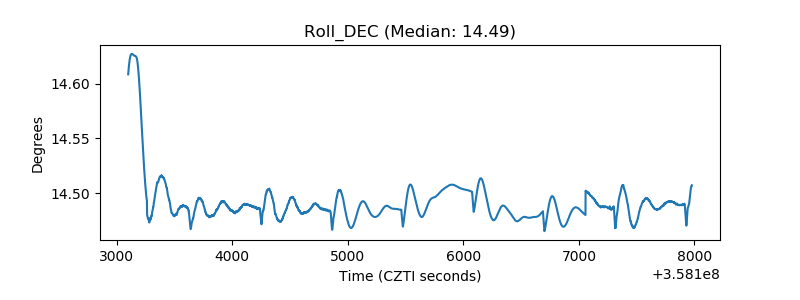 |
| _Roll_RA | 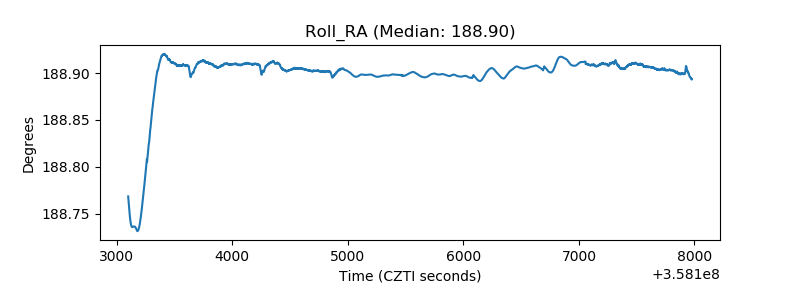 |
| Veto Counter | 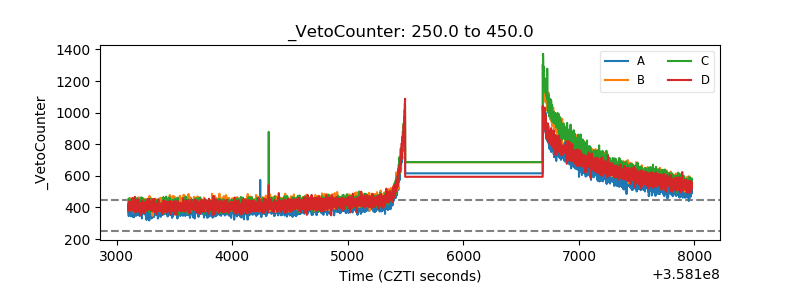 |