| Param | Original file | Final file |
|---|---|---|
| Filename | modeM0/AS1A10_071T29_9000004358_30324cztM0_level2.evt | modeM0/AS1A10_071T29_9000004358_30324cztM0_level2_quad_clean.evt |
| Size (bytes) | 526,599,360 | 100,595,520 |
| Size | 502.2 MB | 95.9 MB |
| Events in quadrant A | 3,333,170 | 664,623 |
| Events in quadrant B | 5,439,953 | 672,220 |
| Events in quadrant C | 3,385,365 | 648,981 |
| Events in quadrant D | 3,371,694 | 630,017 |
| Mode M9 | |||
|---|---|---|---|
| Quadrant | BADHDUFLAG | Total packets | Discarded packets |
| A | 0 | 19 | 0 |
| B | 0 | 20 | 0 |
| C | 0 | 20 | 0 |
| D | 0 | 20 | 0 |
| Mode SS | |||
|---|---|---|---|
| Quadrant | BADHDUFLAG | Total packets | Discarded packets |
| A | 0 | 126 | 0 |
| B | 0 | 126 | 0 |
| C | 0 | 126 | 0 |
| D | 0 | 126 | 0 |
| Mode M0 | |||
|---|---|---|---|
| Quadrant | BADHDUFLAG | Total packets | Discarded packets |
| A | 0 | 13835 | 2 |
| B | 0 | 20274 | 2 |
| C | 0 | 13992 | 2 |
| D | 0 | 13957 | 2 |
| Quadrant | Total seconds | Saturated seconds | Saturation percentage |
|---|---|---|---|
| A | 6170 | 95 | 1.539708% |
| B | 6170 | 214 | 3.468395% |
| C | 6169 | 127 | 2.058680% |
| D | 6169 | 64 | 1.037445% |
Noise dominated data is calculated using 1-second bins in cleaned event files. If a bin has >2000 counts, and if more than 50% of those come from <1% of pixels, then it is considered to be noise-dominated and hence unusable.
| Quadrant | # 1 sec bins | Bins with >0 counts | Bins with >2000 counts | High rate bins dominated by noise | Noise dominated (total time) | Noise dominated (detector-on time) | Marked lightcurve |
|---|---|---|---|---|---|---|---|
| A | 7475 | 6170 | 3 | 3 | 0.04% | 0.05% | 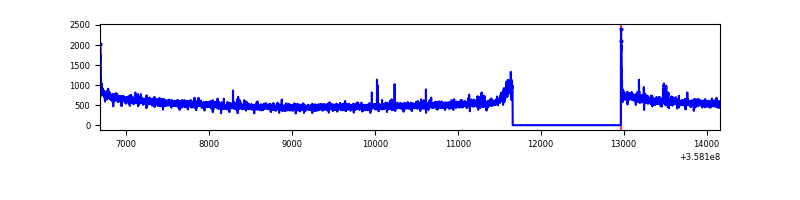 |
| B | 7475 | 6170 | 20 | 20 | 0.27% | 0.32% | 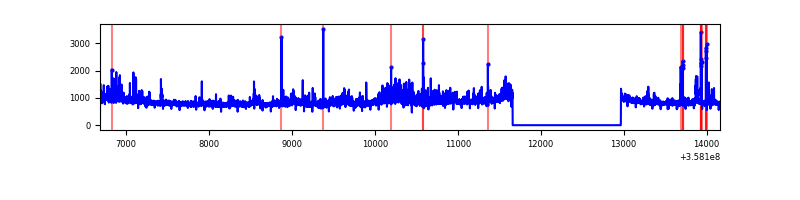 |
| C | 7474 | 6169 | 1 | 1 | 0.01% | 0.02% | 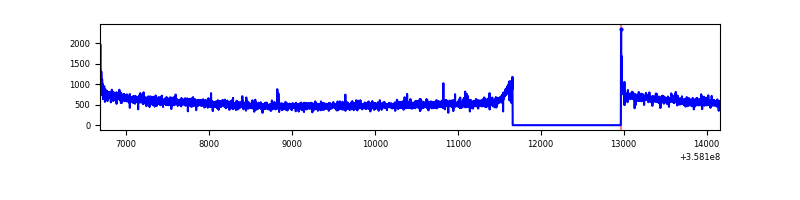 |
| D | 7474 | 6170 | 6 | 6 | 0.08% | 0.10% | 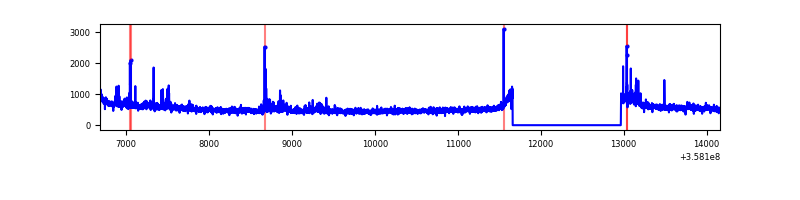 |
Top three noisy pixels from each quadrant. If the there are fewer than three noisy pixels in the level2.evt file, extra rows are filled as -1
| Pixel properties | Quadrant properties | ||||||
|---|---|---|---|---|---|---|---|
| Quadrant | DetID | PixID | Counts | Sigma | Mean | Median | Sigma |
| A | 14 | 239 | 38108 | 224.68 | 839 | 825 | 165.9 |
| A | 5 | 203 | 33615 | 197.6 | 839 | 825 | 165.9 |
| A | 8 | 192 | 26973 | 157.58 | 839 | 825 | 165.9 |
| B | 6 | 159 | 1663521 | 10843.5 | 827 | 806 | 153.3 |
| B | 6 | 36 | 508613 | 3311.7 | 827 | 806 | 153.3 |
| B | 12 | 111 | 18966 | 118.43 | 827 | 806 | 153.3 |
| C | 14 | 238 | 133300 | 699.84 | 812 | 820 | 189.3 |
| C | 3 | 233 | 65240 | 340.31 | 812 | 820 | 189.3 |
| C | 2 | 114 | 14802 | 73.86 | 812 | 820 | 189.3 |
| D | 13 | 104 | 133135 | 629.07 | 808 | 797 | 210.4 |
| D | 8 | 195 | 90119 | 424.59 | 808 | 797 | 210.4 |
| D | 2 | 250 | 48238 | 225.51 | 808 | 797 | 210.4 |
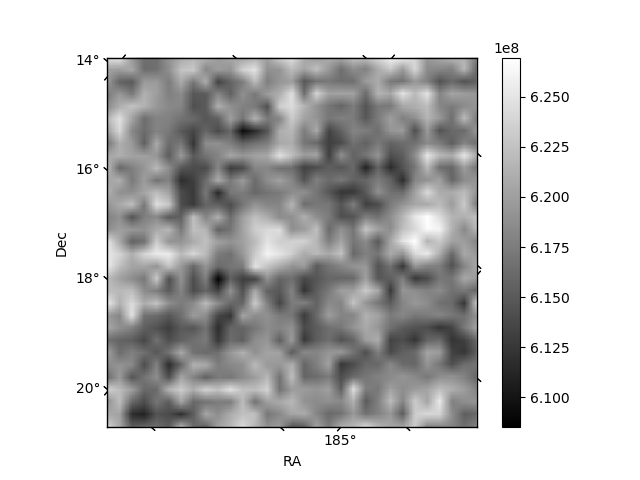
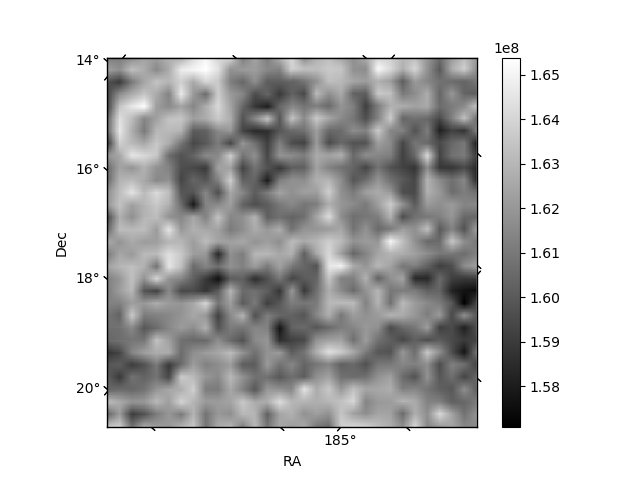
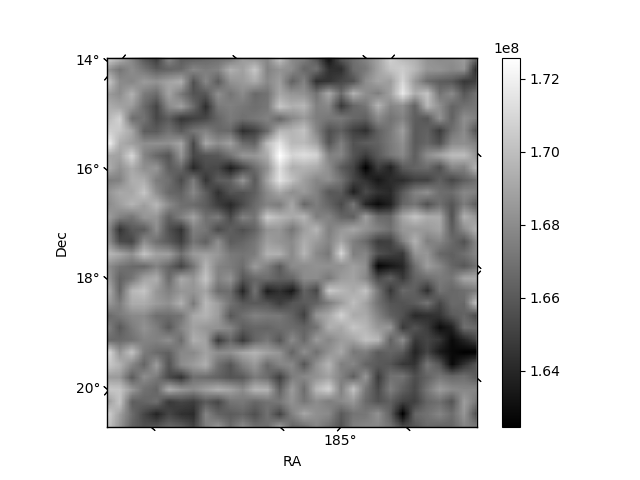
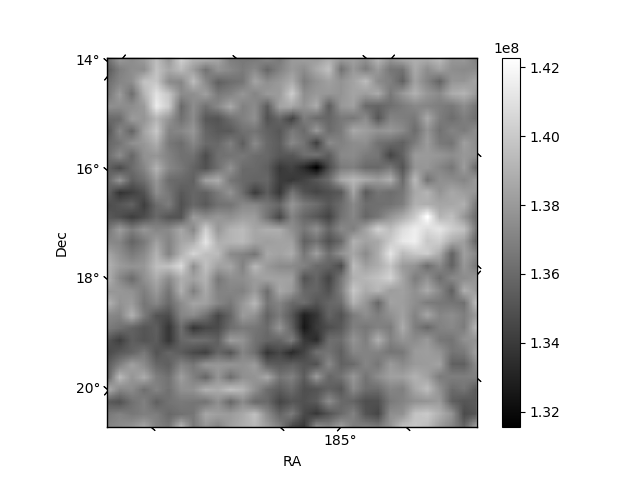
Histogram calculated using DETX and DETY for each event in the final _common_clean file
| Quadrant A | 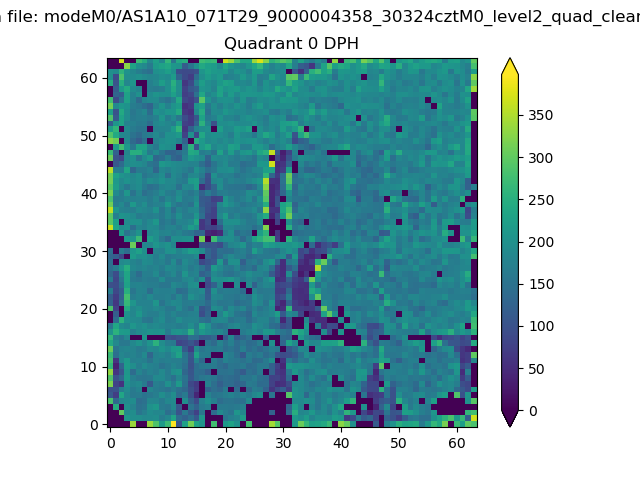 |
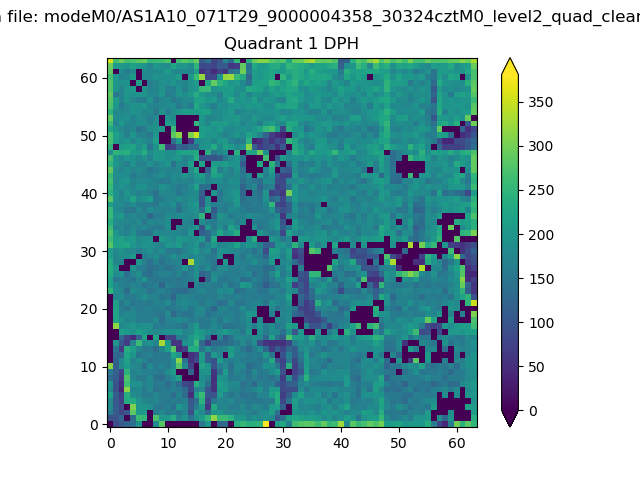 |
Quadrant B |
|---|---|---|---|
| Quadrant D | 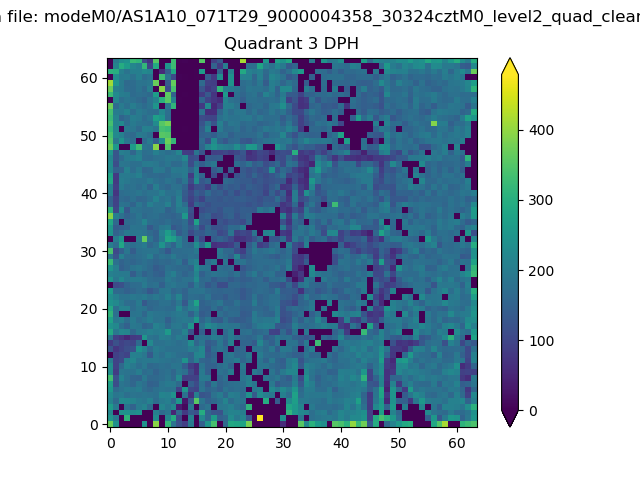 |
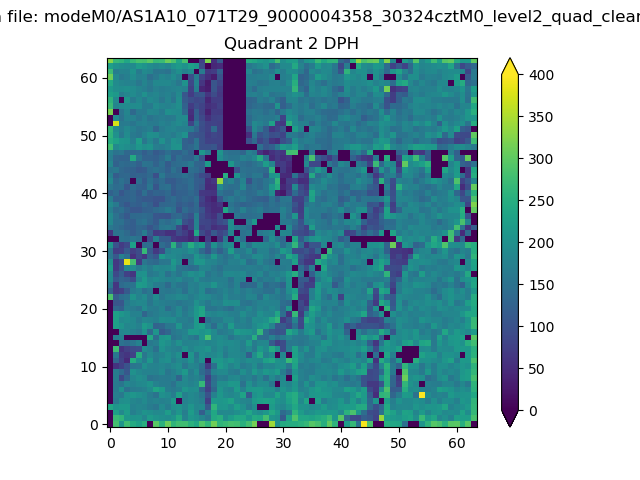 |
Quadrant C |
| Plot type | Count rate plots | Images |
|---|---|---|
| Comparison with Poisson distribution Blue bars denote a histogram of data divided into 1 sec bins. Red curve is a Poisson curve with rate = median count rate of data. |
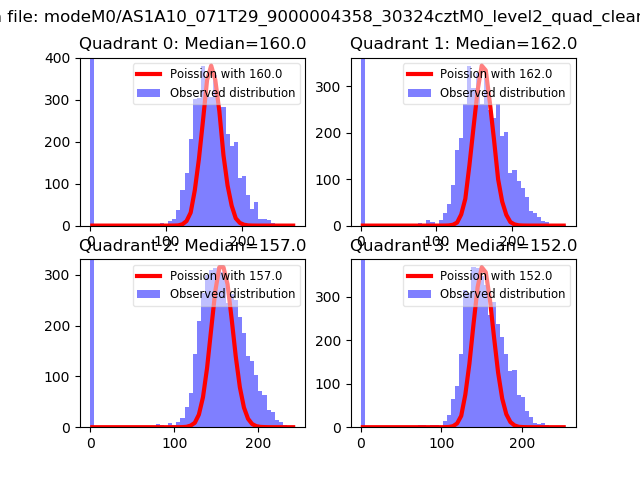 |
 |
| Quadrant-wise count rates Data is divided into 100 sec bins |
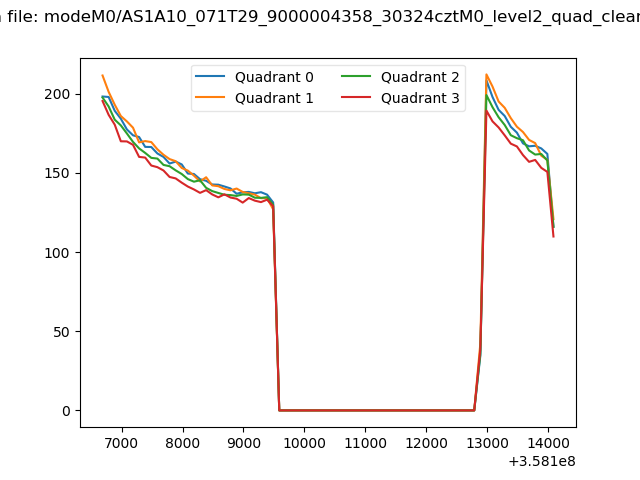 |
|
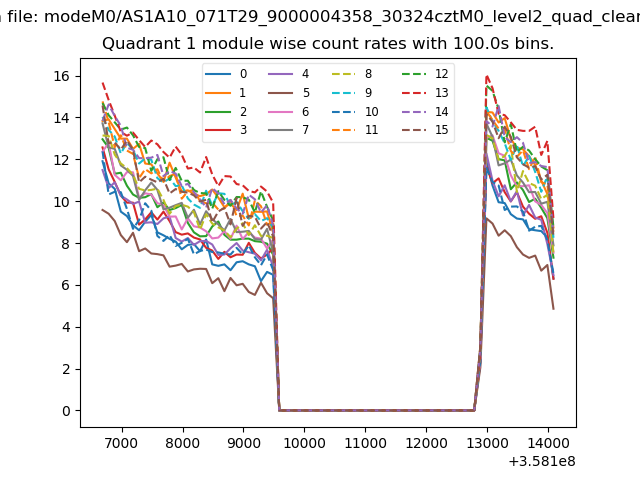
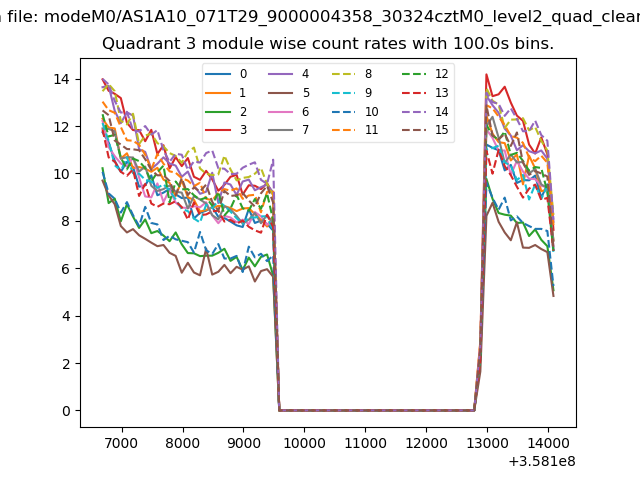
| Module-wise count rates for Quadrant A Data is divided into 100 sec bins |
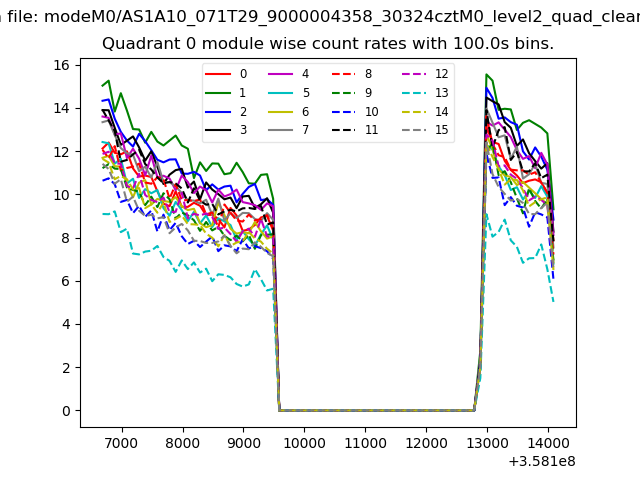 |
 |
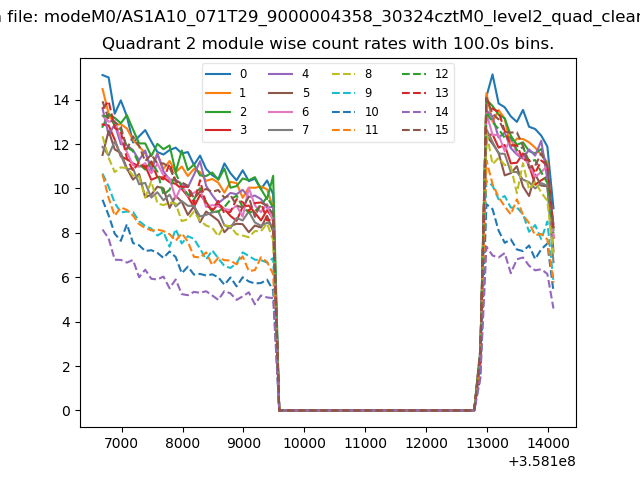
| Module-wise count rates for Quadrant B Data is divided into 100 sec bins |
 |
 |
| Module-wise count rates for Quadrant C Data is divided into 100 sec bins |
 |
 |
| Module-wise count rates for Quadrant D Data is divided into 100 sec bins |
 |
 |
| Parameter | Plot |
|---|---|
| CZT HV Monitor | 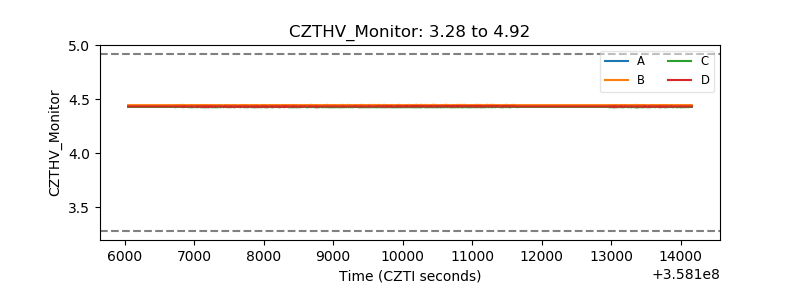 |
| D_VDD |  |
| Temperature 1 | 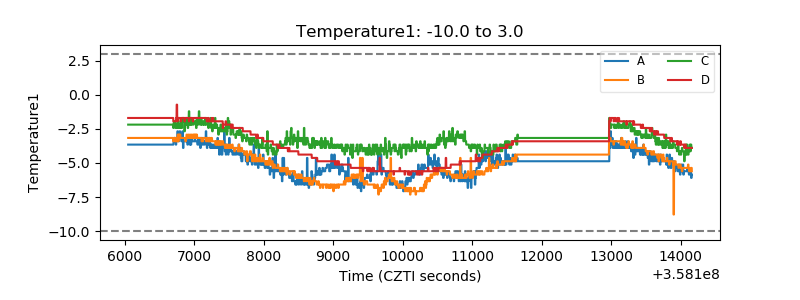 |
| Veto HV Monitor |  |
| Veto LLD | 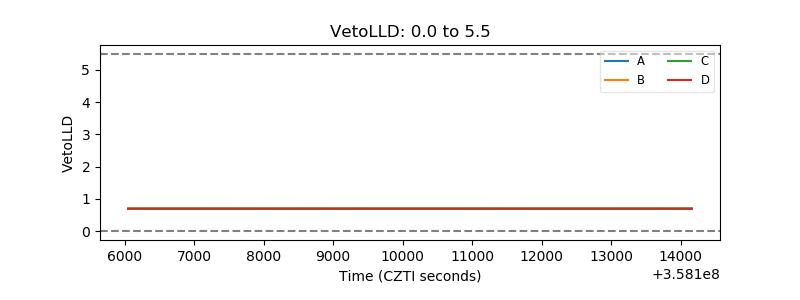 |
| Alpha Counter | 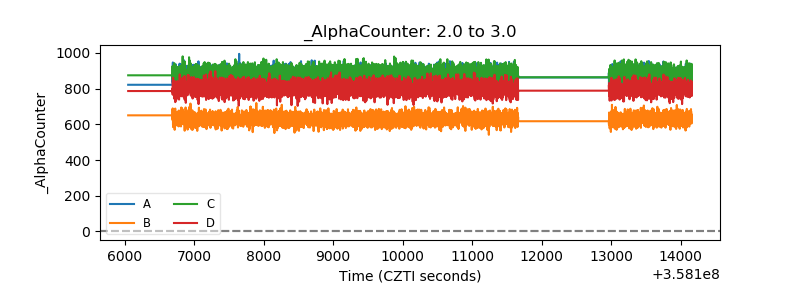 |
| _CPM_Rate | 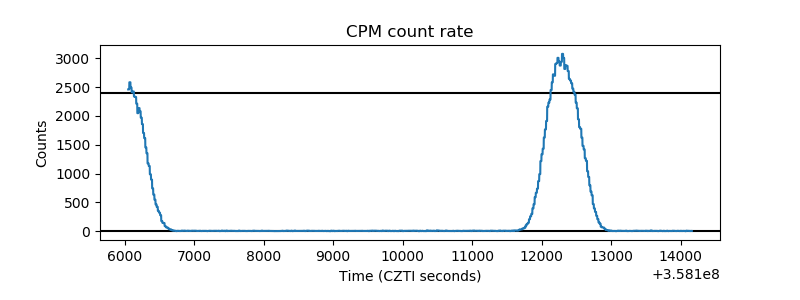 |
| CZT Counter | 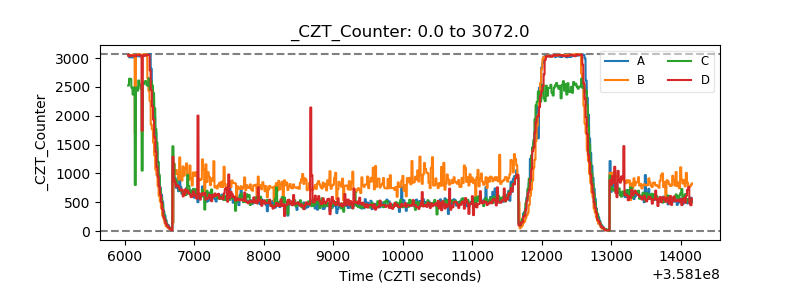 |
| +2.5 Volts monitor |  |
| +5 Volts monitor |  |
| _ROLL_ROT | 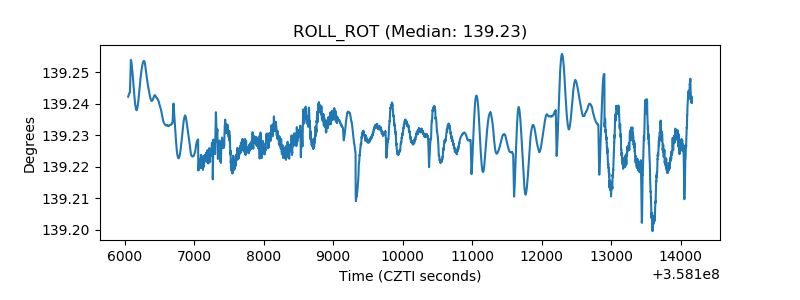 |
| _Roll_DEC | 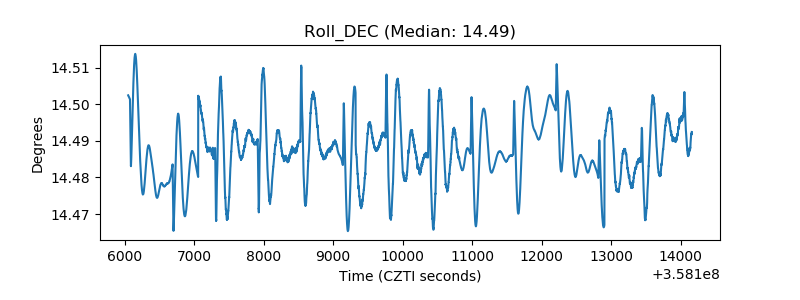 |
| _Roll_RA | 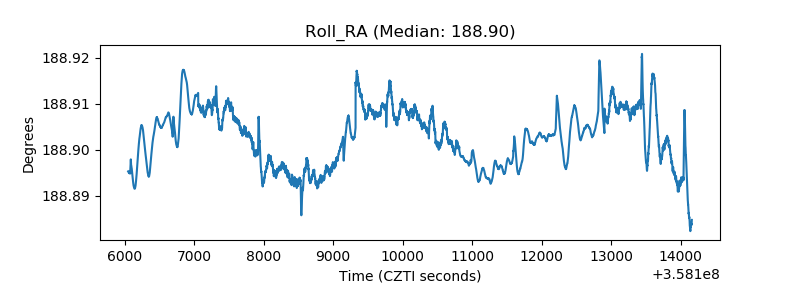 |
| Veto Counter | 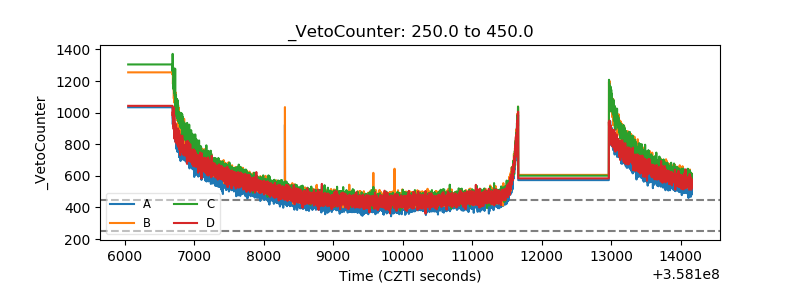 |