| Param | Original file | Final file |
|---|---|---|
| Filename | modeM0/AS1A10_071T29_9000004358_30325cztM0_level2.evt | modeM0/AS1A10_071T29_9000004358_30325cztM0_level2_quad_clean.evt |
| Size (bytes) | 533,796,480 | 95,402,880 |
| Size | 509.1 MB | 91.0 MB |
| Events in quadrant A | 3,342,237 | 632,274 |
| Events in quadrant B | 5,660,925 | 624,345 |
| Events in quadrant C | 3,391,739 | 613,080 |
| Events in quadrant D | 3,359,056 | 594,566 |
| Mode M9 | |||
|---|---|---|---|
| Quadrant | BADHDUFLAG | Total packets | Discarded packets |
| A | 0 | 19 | 0 |
| B | 0 | 20 | 0 |
| C | 0 | 20 | 0 |
| D | 0 | 20 | 0 |
| Mode SS | |||
|---|---|---|---|
| Quadrant | BADHDUFLAG | Total packets | Discarded packets |
| A | 0 | 122 | 0 |
| B | 0 | 122 | 0 |
| C | 0 | 122 | 0 |
| D | 0 | 122 | 0 |
| Mode M0 | |||
|---|---|---|---|
| Quadrant | BADHDUFLAG | Total packets | Discarded packets |
| A | 0 | 13815 | 2 |
| B | 0 | 20728 | 2 |
| C | 0 | 13870 | 2 |
| D | 0 | 13768 | 2 |
| Quadrant | Total seconds | Saturated seconds | Saturation percentage |
|---|---|---|---|
| A | 6094 | 68 | 1.115852% |
| B | 6093 | 373 | 6.121779% |
| C | 6093 | 101 | 1.657640% |
| D | 6093 | 36 | 0.590842% |
Noise dominated data is calculated using 1-second bins in cleaned event files. If a bin has >2000 counts, and if more than 50% of those come from <1% of pixels, then it is considered to be noise-dominated and hence unusable.
| Quadrant | # 1 sec bins | Bins with >0 counts | Bins with >2000 counts | High rate bins dominated by noise | Noise dominated (total time) | Noise dominated (detector-on time) | Marked lightcurve |
|---|---|---|---|---|---|---|---|
| A | 7469 | 6095 | 6 | 6 | 0.08% | 0.10% | 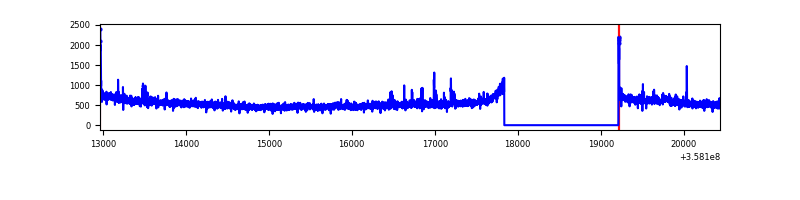 |
| B | 7468 | 6093 | 227 | 227 | 3.04% | 3.73% | 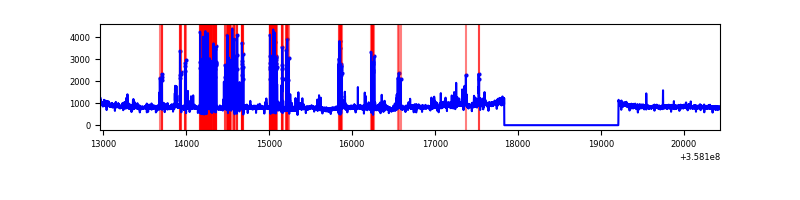 |
| C | 7468 | 6094 | 2 | 2 | 0.03% | 0.03% |  |
| D | 7468 | 6094 | 6 | 6 | 0.08% | 0.10% | 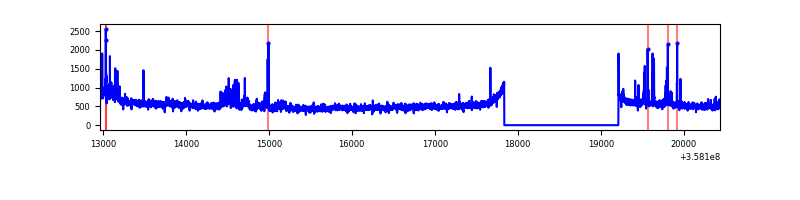 |
Top three noisy pixels from each quadrant. If the there are fewer than three noisy pixels in the level2.evt file, extra rows are filled as -1
| Pixel properties | Quadrant properties | ||||||
|---|---|---|---|---|---|---|---|
| Quadrant | DetID | PixID | Counts | Sigma | Mean | Median | Sigma |
| A | 5 | 203 | 56904 | 342.68 | 828 | 815 | 163.7 |
| A | 14 | 239 | 56069 | 337.58 | 828 | 815 | 163.7 |
| A | 8 | 192 | 28229 | 167.49 | 828 | 815 | 163.7 |
| B | 6 | 159 | 1688866 | 11156.83 | 805 | 787 | 151.3 |
| B | 6 | 36 | 804198 | 5309.89 | 805 | 787 | 151.3 |
| B | 12 | 111 | 17897 | 113.08 | 805 | 787 | 151.3 |
| C | 14 | 238 | 137787 | 741.2 | 795 | 802 | 184.8 |
| C | 3 | 233 | 111938 | 601.34 | 795 | 802 | 184.8 |
| C | 0 | 10 | 18345 | 94.92 | 795 | 802 | 184.8 |
| D | 13 | 104 | 144712 | 693.52 | 788 | 778 | 207.5 |
| D | 8 | 195 | 103008 | 492.57 | 788 | 778 | 207.5 |
| D | 13 | 249 | 36457 | 171.91 | 788 | 778 | 207.5 |
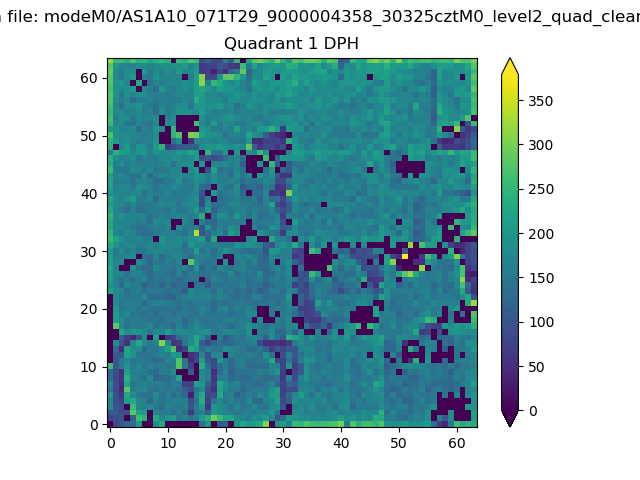
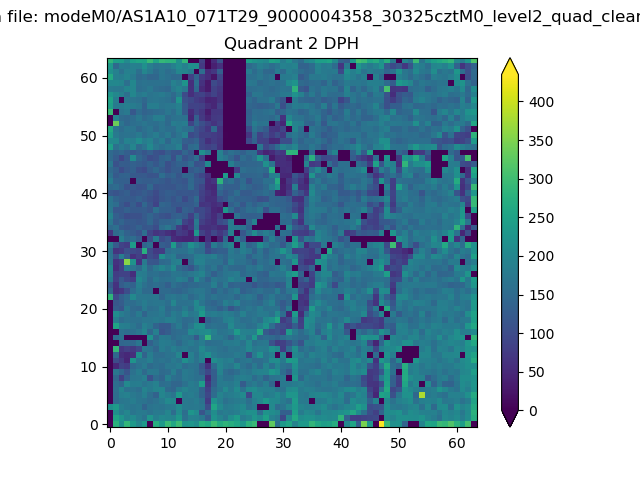
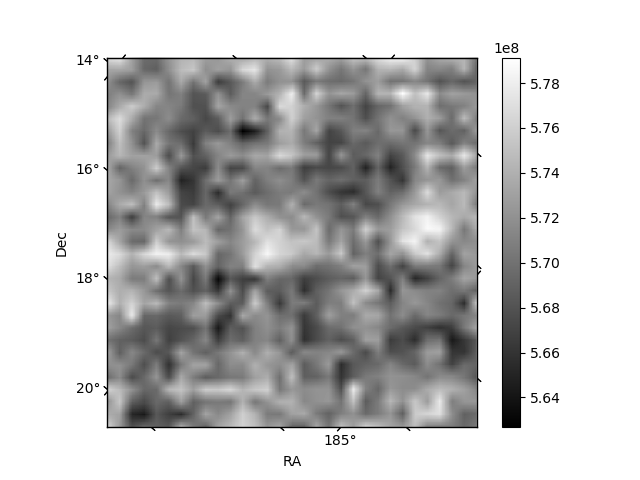
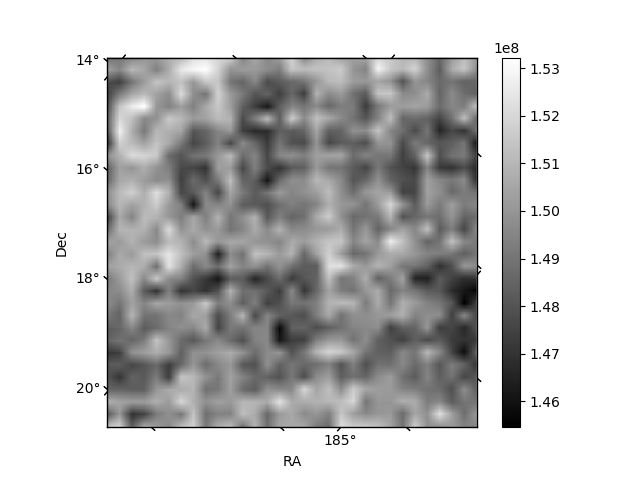
Histogram calculated using DETX and DETY for each event in the final _common_clean file
| Quadrant A | 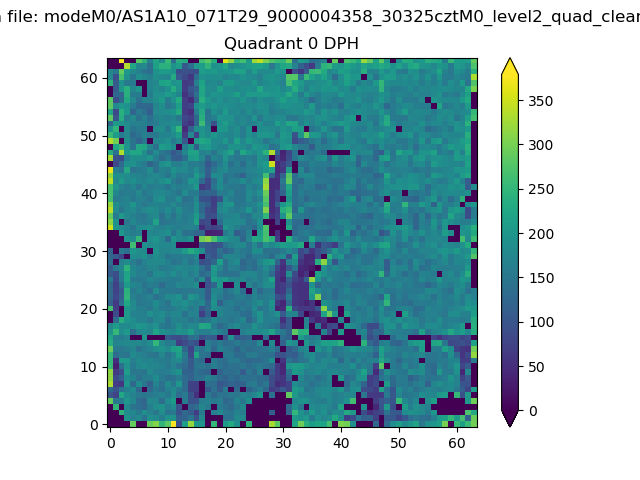 |
 |
Quadrant B |
|---|---|---|---|
| Quadrant D | 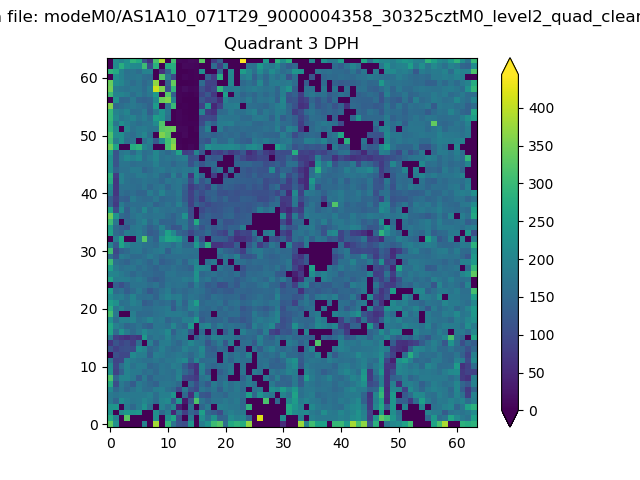 |
 |
Quadrant C |
| Plot type | Count rate plots | Images |
|---|---|---|
| Comparison with Poisson distribution Blue bars denote a histogram of data divided into 1 sec bins. Red curve is a Poisson curve with rate = median count rate of data. |
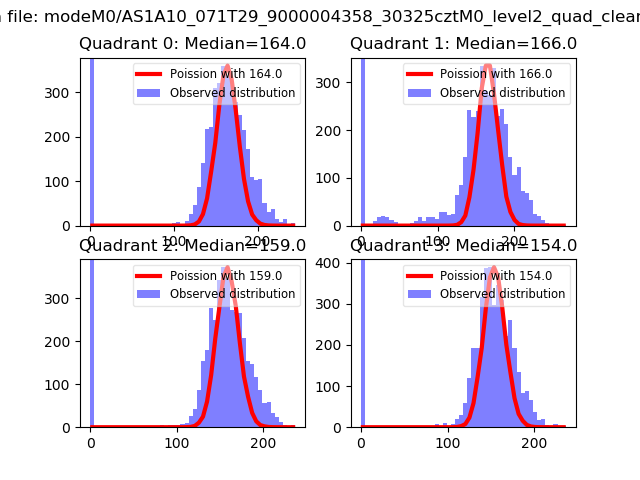 |
 |
| Quadrant-wise count rates Data is divided into 100 sec bins |
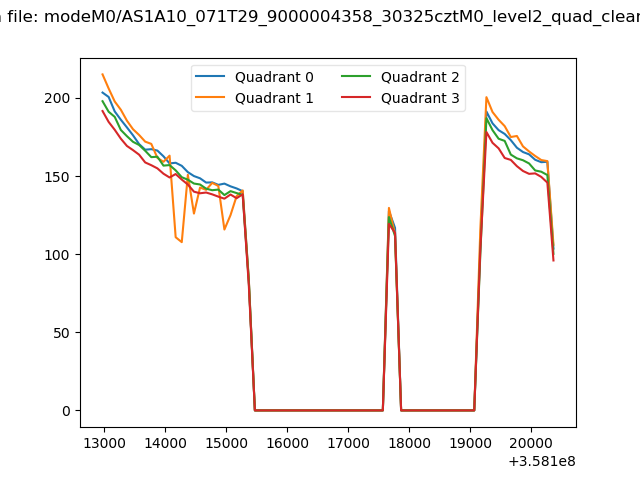 |
|
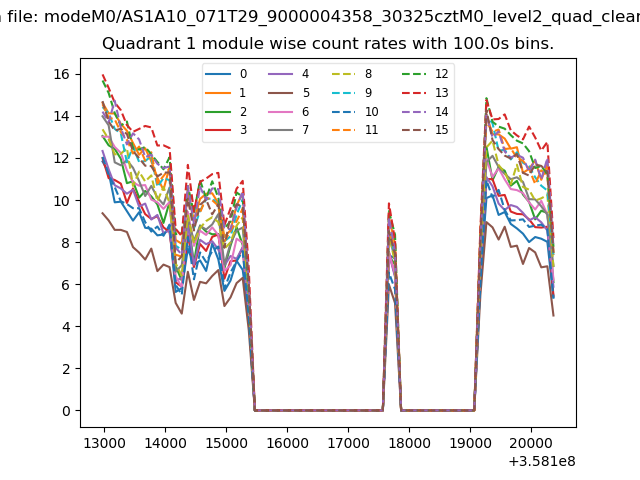
| Module-wise count rates for Quadrant A Data is divided into 100 sec bins |
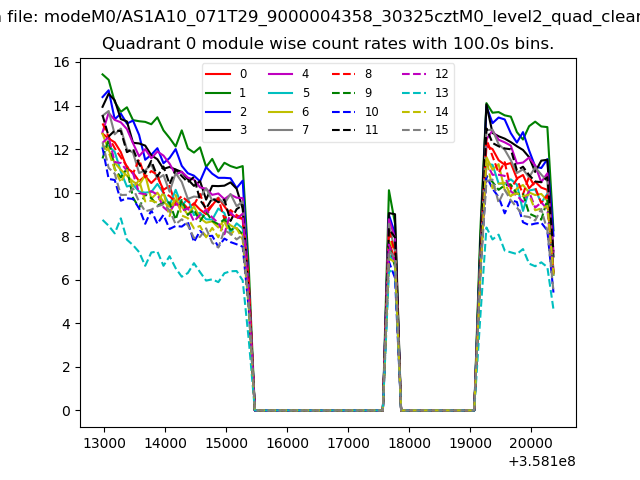 |
 |
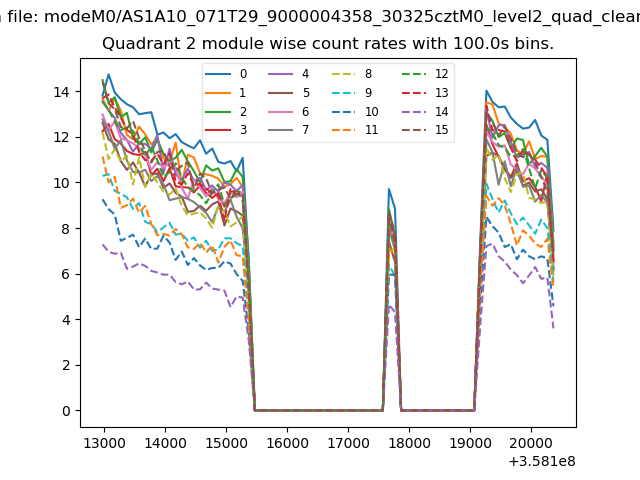
| Module-wise count rates for Quadrant B Data is divided into 100 sec bins |
 |
 |
| Module-wise count rates for Quadrant C Data is divided into 100 sec bins |
 |
 |
| Module-wise count rates for Quadrant D Data is divided into 100 sec bins |
 |
 |
| Parameter | Plot |
|---|---|
| CZT HV Monitor | 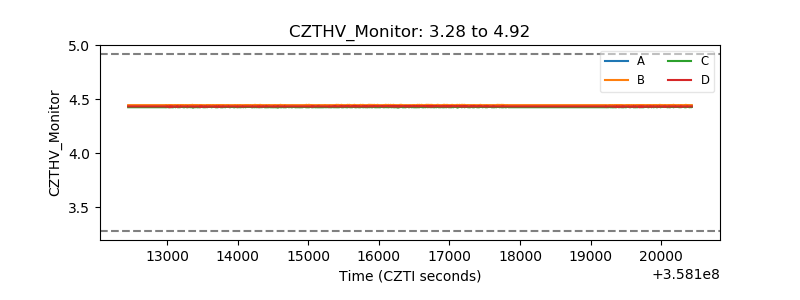 |
| D_VDD | 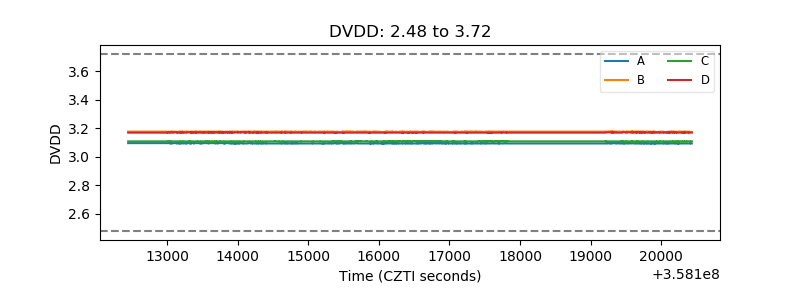 |
| Temperature 1 | 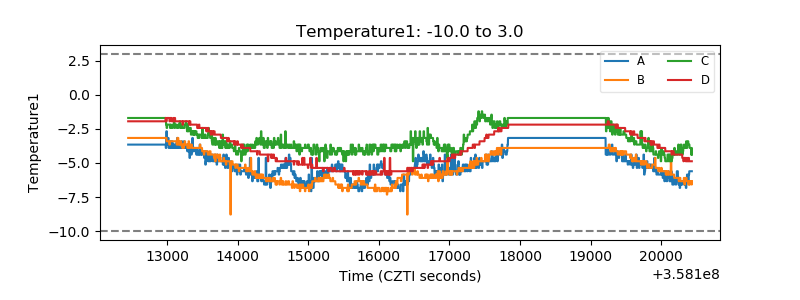 |
| Veto HV Monitor | 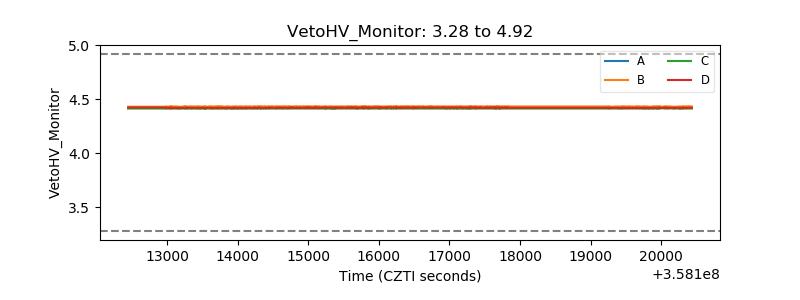 |
| Veto LLD | 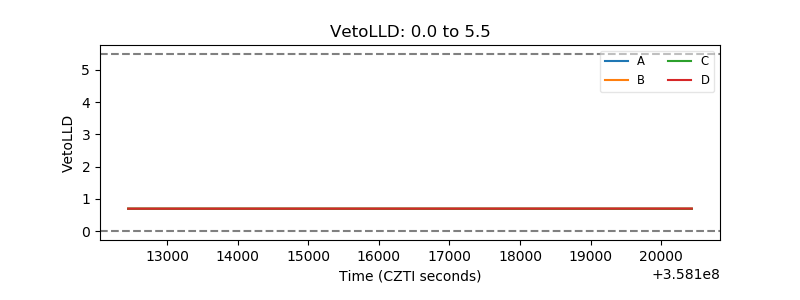 |
| Alpha Counter | 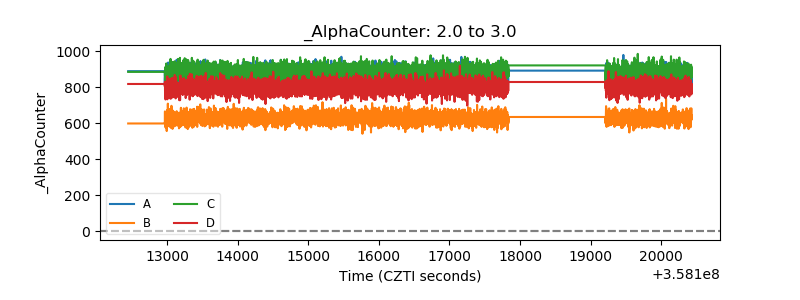 |
| _CPM_Rate | 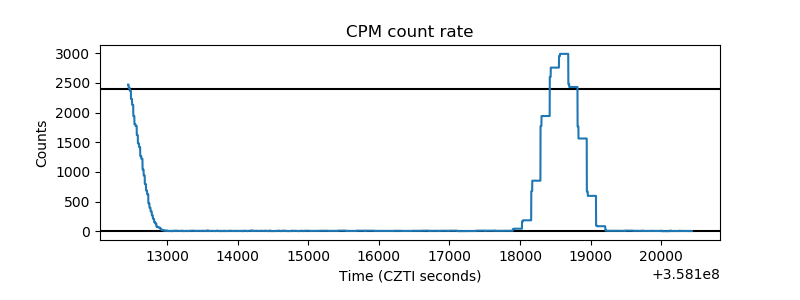 |
| CZT Counter | 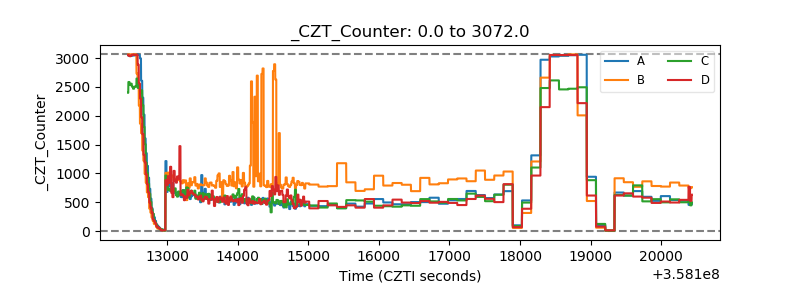 |
| +2.5 Volts monitor | 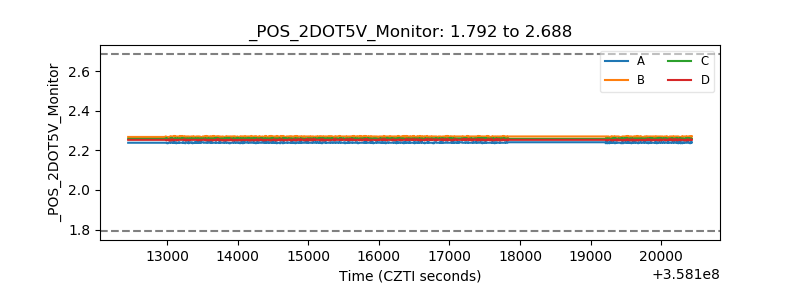 |
| +5 Volts monitor |  |
| _ROLL_ROT | 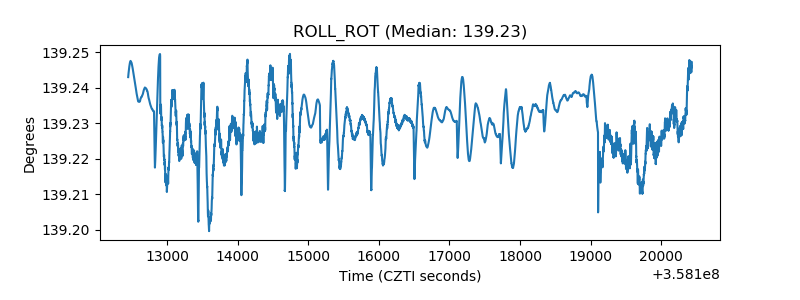 |
| _Roll_DEC | 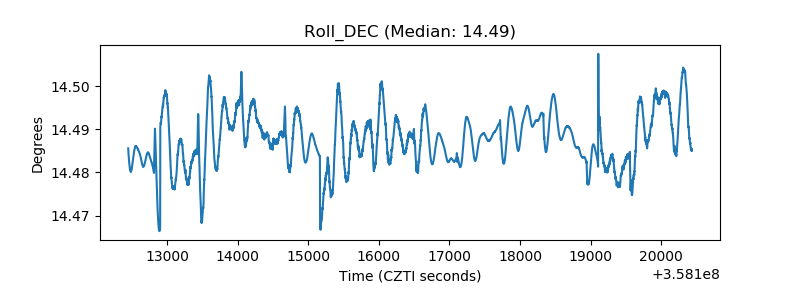 |
| _Roll_RA | 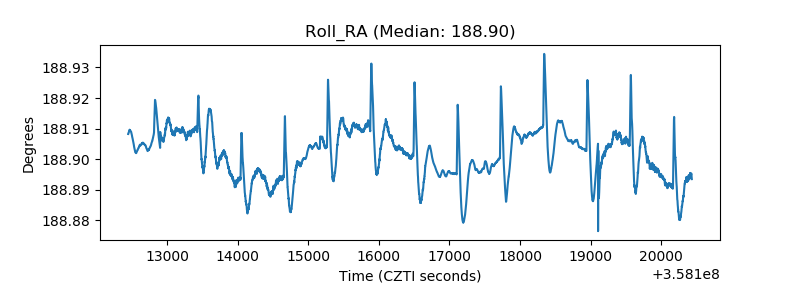 |
| Veto Counter | 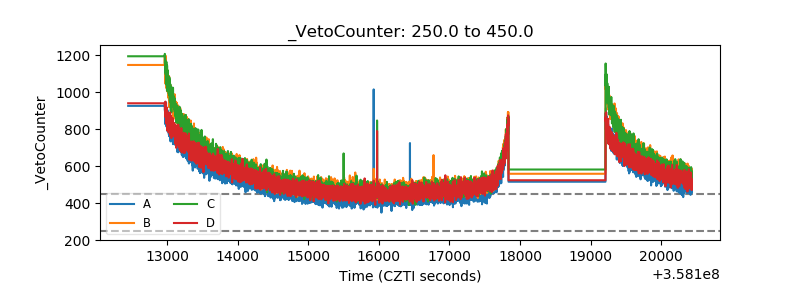 |