| Param | Original file | Final file |
|---|---|---|
| Filename | modeM0/AS1A10_071T29_9000004358_30326cztM0_level2.evt | modeM0/AS1A10_071T29_9000004358_30326cztM0_level2_quad_clean.evt |
| Size (bytes) | 513,437,760 | 93,162,240 |
| Size | 489.7 MB | 88.8 MB |
| Events in quadrant A | 3,269,494 | 611,162 |
| Events in quadrant B | 5,199,760 | 621,822 |
| Events in quadrant C | 3,376,345 | 589,452 |
| Events in quadrant D | 3,288,888 | 571,245 |
| Mode M9 | |||
|---|---|---|---|
| Quadrant | BADHDUFLAG | Total packets | Discarded packets |
| A | 0 | 15 | 0 |
| B | 0 | 16 | 0 |
| C | 0 | 16 | 0 |
| D | 0 | 16 | 0 |
| Mode SS | |||
|---|---|---|---|
| Quadrant | BADHDUFLAG | Total packets | Discarded packets |
| A | 0 | 126 | 0 |
| B | 0 | 126 | 0 |
| C | 0 | 126 | 0 |
| D | 0 | 126 | 0 |
| Mode M0 | |||
|---|---|---|---|
| Quadrant | BADHDUFLAG | Total packets | Discarded packets |
| A | 0 | 13644 | 2 |
| B | 0 | 19413 | 2 |
| C | 0 | 13718 | 3 |
| D | 0 | 13747 | 2 |
| Quadrant | Total seconds | Saturated seconds | Saturation percentage |
|---|---|---|---|
| A | 6121 | 73 | 1.192616% |
| B | 6121 | 157 | 2.564940% |
| C | 6120 | 131 | 2.140523% |
| D | 6120 | 33 | 0.539216% |
Noise dominated data is calculated using 1-second bins in cleaned event files. If a bin has >2000 counts, and if more than 50% of those come from <1% of pixels, then it is considered to be noise-dominated and hence unusable.
| Quadrant | # 1 sec bins | Bins with >0 counts | Bins with >2000 counts | High rate bins dominated by noise | Noise dominated (total time) | Noise dominated (detector-on time) | Marked lightcurve |
|---|---|---|---|---|---|---|---|
| A | 7466 | 6123 | 5 | 5 | 0.07% | 0.08% | 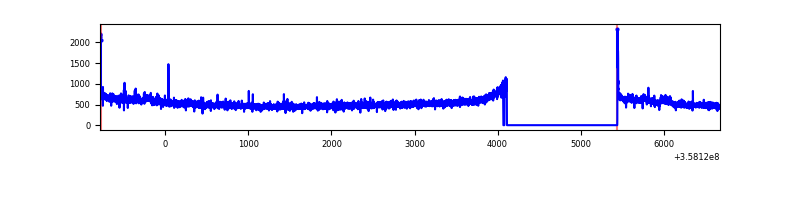 |
| B | 7466 | 6123 | 26 | 26 | 0.35% | 0.42% | 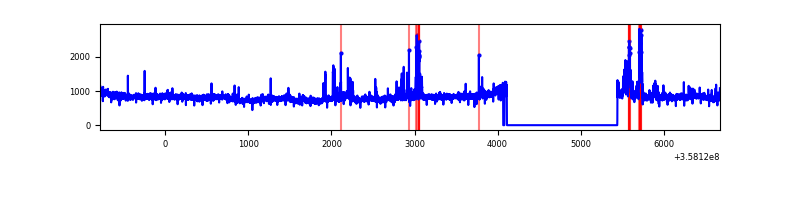 |
| C | 7465 | 6122 | 8 | 8 | 0.11% | 0.13% | 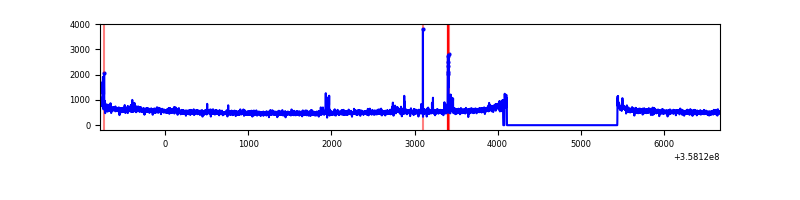 |
| D | 7465 | 6122 | 7 | 7 | 0.09% | 0.11% | 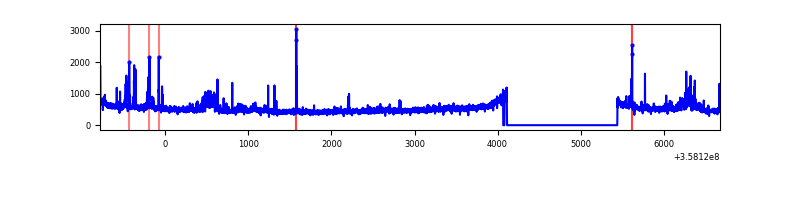 |
Top three noisy pixels from each quadrant. If the there are fewer than three noisy pixels in the level2.evt file, extra rows are filled as -1
| Pixel properties | Quadrant properties | ||||||
|---|---|---|---|---|---|---|---|
| Quadrant | DetID | PixID | Counts | Sigma | Mean | Median | Sigma |
| A | 5 | 203 | 90546 | 559.04 | 812 | 799 | 160.5 |
| A | 8 | 192 | 25959 | 156.72 | 812 | 799 | 160.5 |
| A | 14 | 239 | 17738 | 105.51 | 812 | 799 | 160.5 |
| B | 6 | 159 | 1719929 | 11232.72 | 805 | 787 | 153.0 |
| B | 6 | 36 | 288563 | 1880.3 | 805 | 787 | 153.0 |
| B | 0 | 190 | 19000 | 119.0 | 805 | 787 | 153.0 |
| C | 3 | 233 | 148411 | 818.72 | 778 | 786 | 180.3 |
| C | 14 | 238 | 140677 | 775.83 | 778 | 786 | 180.3 |
| C | 0 | 10 | 19797 | 105.43 | 778 | 786 | 180.3 |
| D | 13 | 104 | 125520 | 620.75 | 773 | 758 | 201.0 |
| D | 8 | 195 | 107179 | 529.5 | 773 | 758 | 201.0 |
| D | 13 | 249 | 52232 | 256.11 | 773 | 758 | 201.0 |
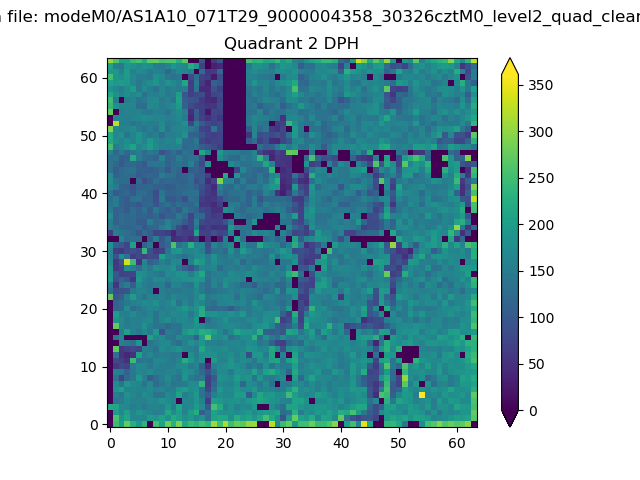
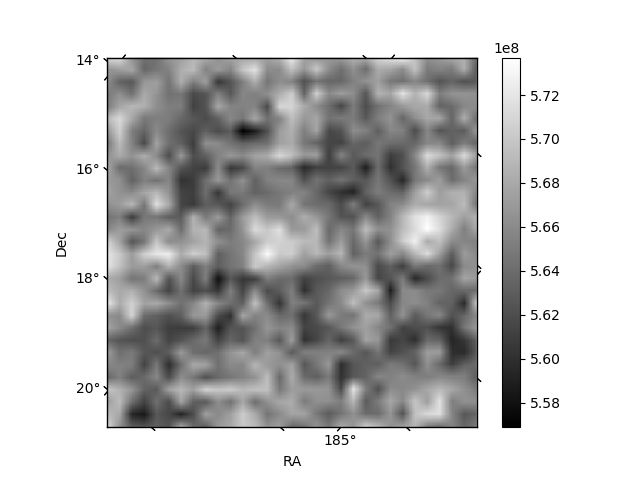
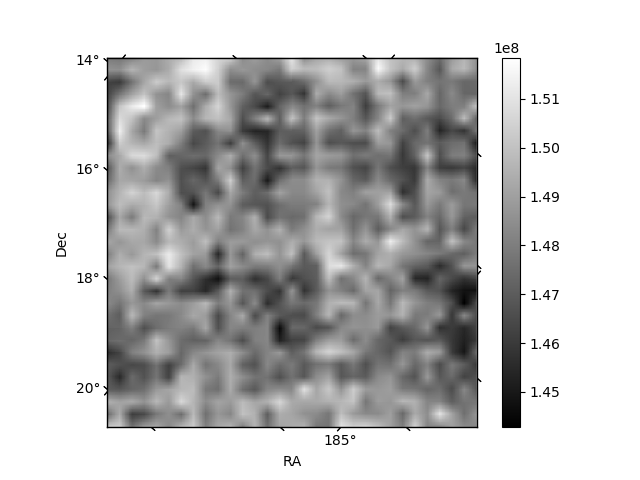
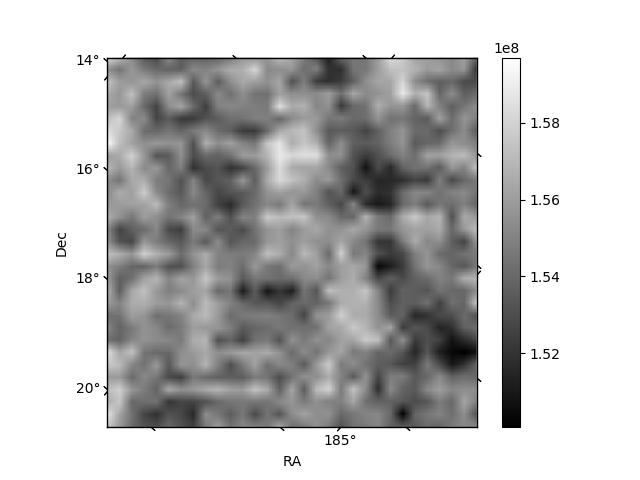
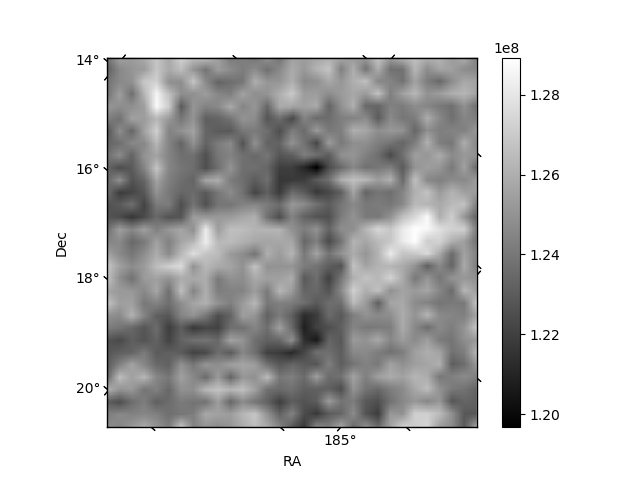
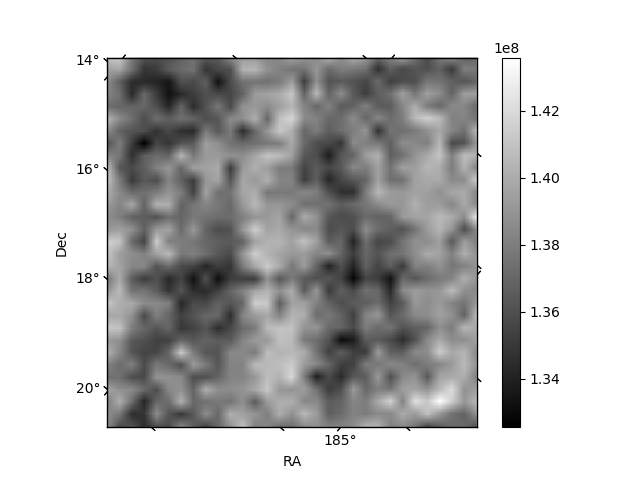
Histogram calculated using DETX and DETY for each event in the final _common_clean file
| Quadrant A | 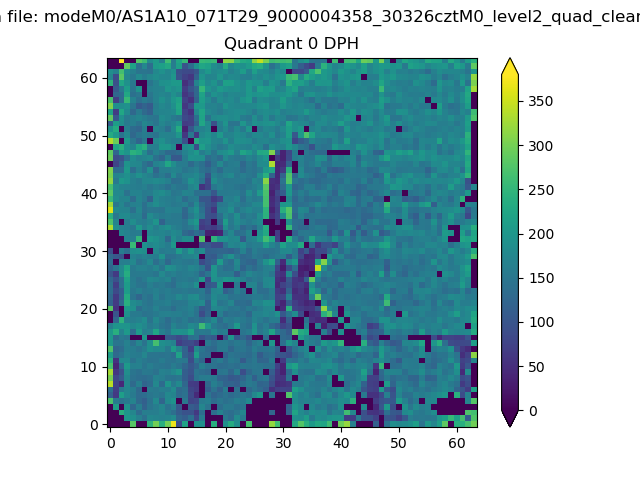 |
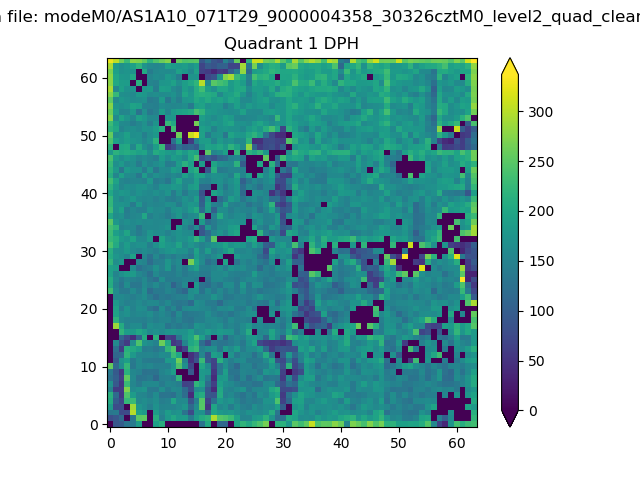 |
Quadrant B |
|---|---|---|---|
| Quadrant D | 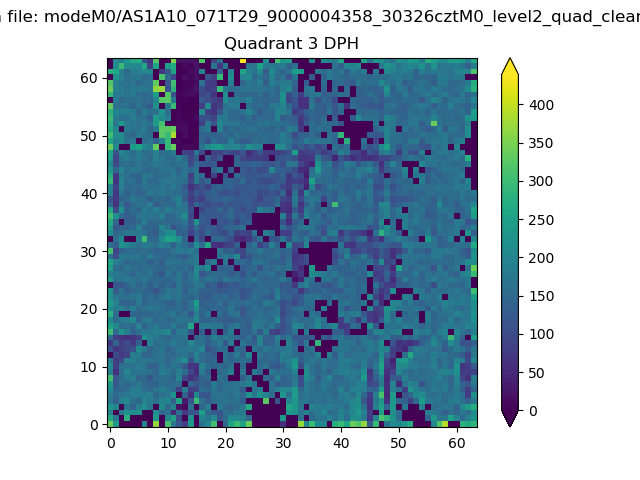 |
 |
Quadrant C |
| Plot type | Count rate plots | Images |
|---|---|---|
| Comparison with Poisson distribution Blue bars denote a histogram of data divided into 1 sec bins. Red curve is a Poisson curve with rate = median count rate of data. |
 |
 |
| Quadrant-wise count rates Data is divided into 100 sec bins |
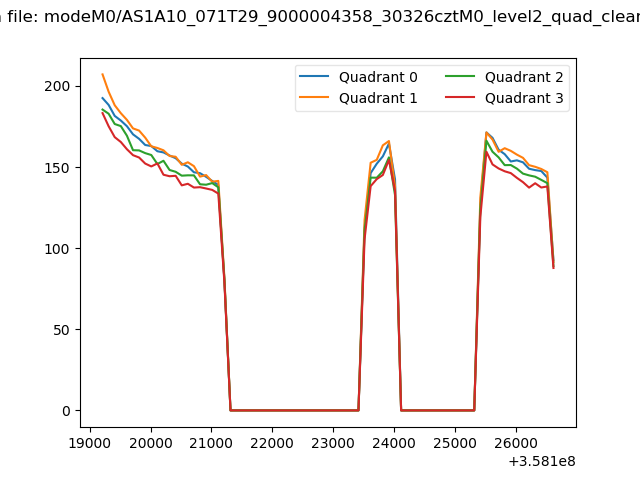 |
|
| Module-wise count rates for Quadrant A Data is divided into 100 sec bins |
 |
 |
| Module-wise count rates for Quadrant B Data is divided into 100 sec bins |
 |
 |
| Module-wise count rates for Quadrant C Data is divided into 100 sec bins |
 |
 |
| Module-wise count rates for Quadrant D Data is divided into 100 sec bins |
 |
 |
| Parameter | Plot |
|---|---|
| CZT HV Monitor |  |
| D_VDD | 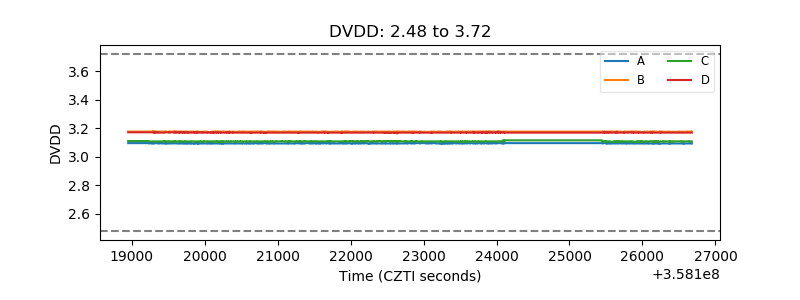 |
| Temperature 1 | 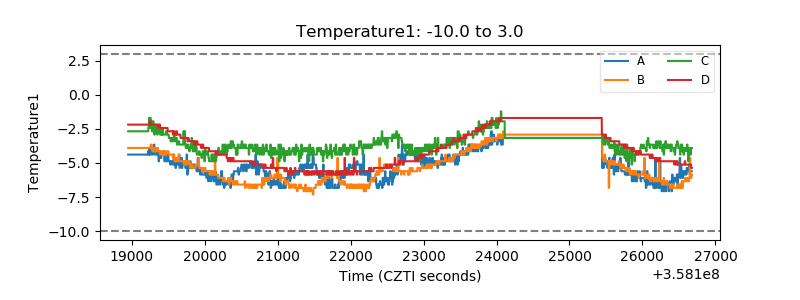 |
| Veto HV Monitor | 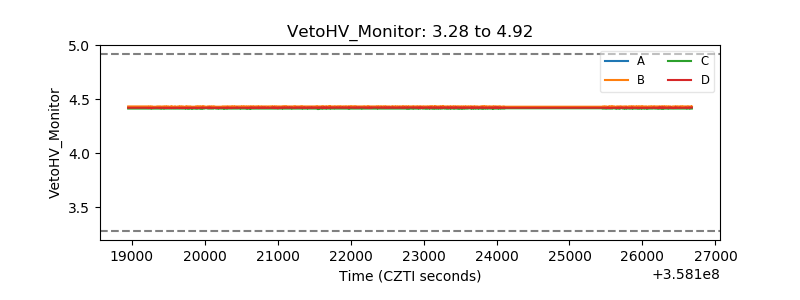 |
| Veto LLD | 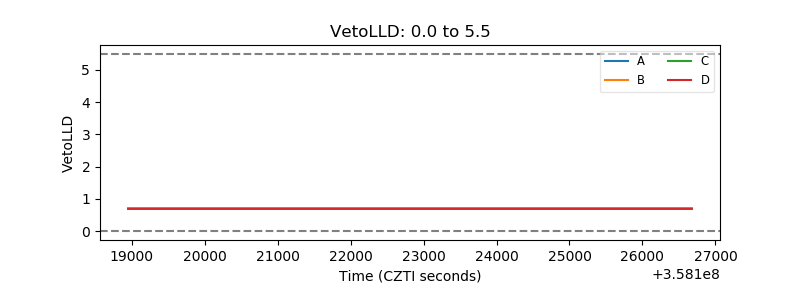 |
| Alpha Counter | 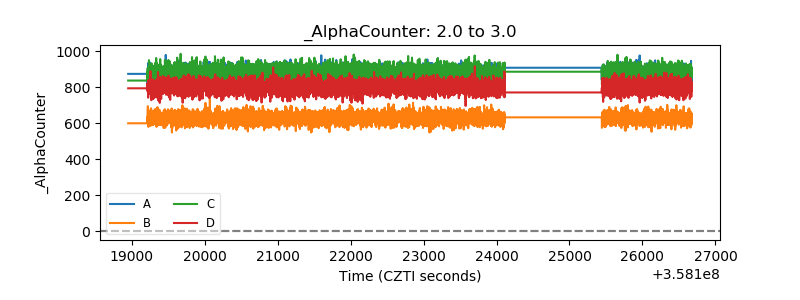 |
| _CPM_Rate | 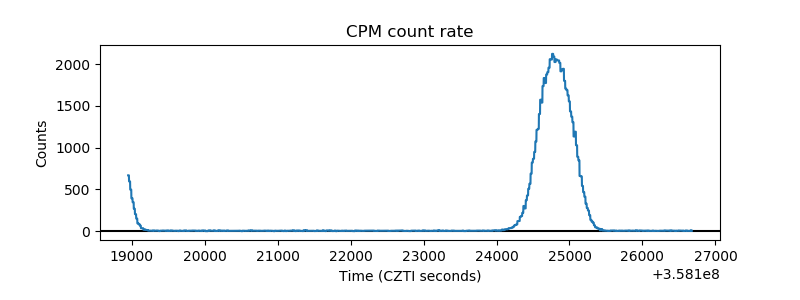 |
| CZT Counter | 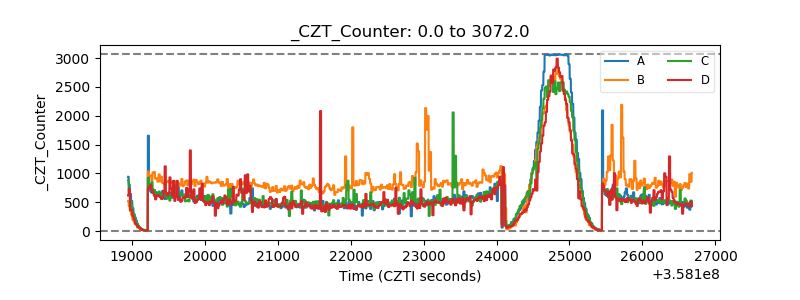 |
| +2.5 Volts monitor |  |
| +5 Volts monitor |  |
| _ROLL_ROT |  |
| _Roll_DEC | 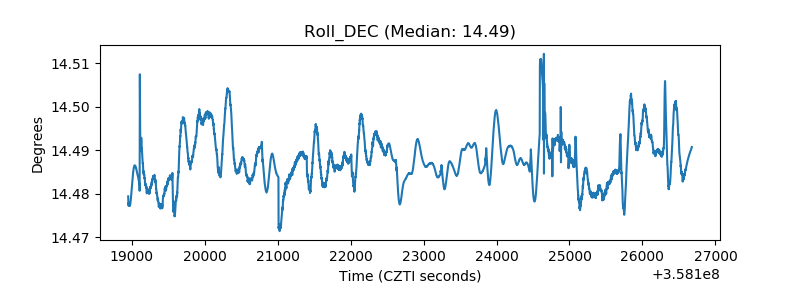 |
| _Roll_RA | 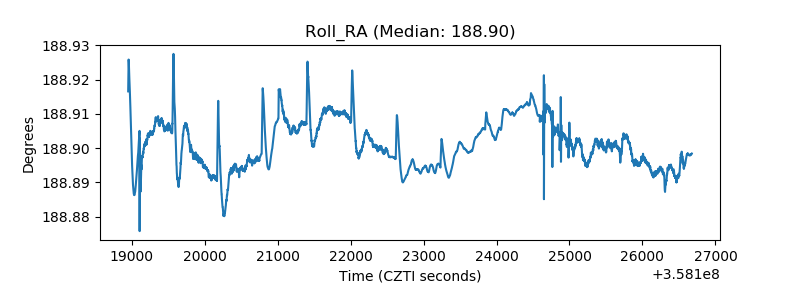 |
| Veto Counter |  |