| Param | Original file | Final file |
|---|---|---|
| Filename | modeM0/AS1A10_071T29_9000004358_30327cztM0_level2.evt | modeM0/AS1A10_071T29_9000004358_30327cztM0_level2_quad_clean.evt |
| Size (bytes) | 518,175,360 | 92,243,520 |
| Size | 494.2 MB | 88.0 MB |
| Events in quadrant A | 3,282,837 | 598,373 |
| Events in quadrant B | 5,345,460 | 602,247 |
| Events in quadrant C | 3,320,209 | 579,103 |
| Events in quadrant D | 3,307,452 | 564,012 |
| Mode M9 | |||
|---|---|---|---|
| Quadrant | BADHDUFLAG | Total packets | Discarded packets |
| A | 0 | 23 | 0 |
| B | 0 | 24 | 0 |
| C | 0 | 24 | 0 |
| D | 0 | 24 | 0 |
| Mode SS | |||
|---|---|---|---|
| Quadrant | BADHDUFLAG | Total packets | Discarded packets |
| A | 0 | 132 | 0 |
| B | 0 | 132 | 0 |
| C | 0 | 132 | 0 |
| D | 0 | 132 | 0 |
| Mode M0 | |||
|---|---|---|---|
| Quadrant | BADHDUFLAG | Total packets | Discarded packets |
| A | 0 | 13880 | 2 |
| B | 0 | 20191 | 2 |
| C | 0 | 13689 | 2 |
| D | 0 | 14120 | 2 |
| Quadrant | Total seconds | Saturated seconds | Saturation percentage |
|---|---|---|---|
| A | 6444 | 49 | 0.760397% |
| B | 6444 | 152 | 2.358783% |
| C | 6444 | 68 | 1.055245% |
| D | 6444 | 32 | 0.496586% |
Noise dominated data is calculated using 1-second bins in cleaned event files. If a bin has >2000 counts, and if more than 50% of those come from <1% of pixels, then it is considered to be noise-dominated and hence unusable.
| Quadrant | # 1 sec bins | Bins with >0 counts | Bins with >2000 counts | High rate bins dominated by noise | Noise dominated (total time) | Noise dominated (detector-on time) | Marked lightcurve |
|---|---|---|---|---|---|---|---|
| A | 7634 | 6445 | 5 | 5 | 0.07% | 0.08% | 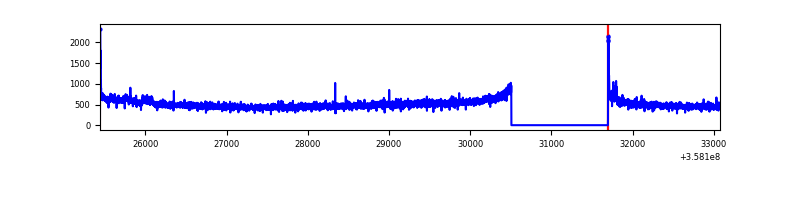 |
| B | 7634 | 6445 | 19 | 19 | 0.25% | 0.29% | 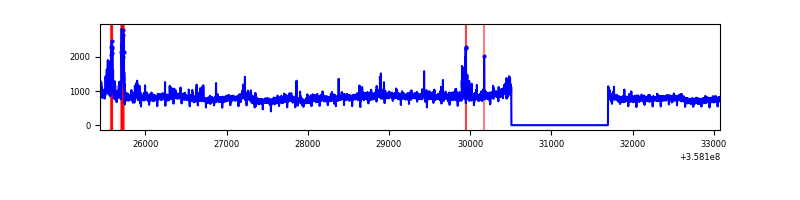 |
| C | 7634 | 6445 | 0 | 0 | 0.00% | 0.00% | 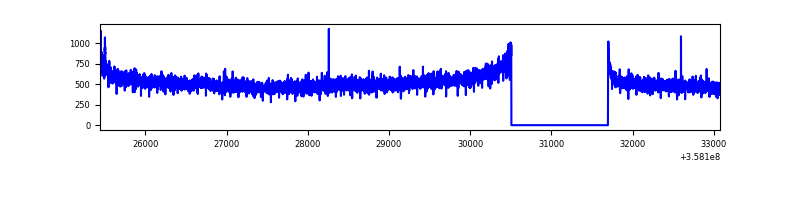 |
| D | 7634 | 6445 | 10 | 10 | 0.13% | 0.16% | 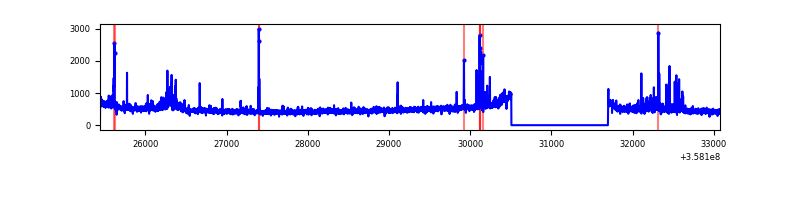 |
Top three noisy pixels from each quadrant. If the there are fewer than three noisy pixels in the level2.evt file, extra rows are filled as -1
| Pixel properties | Quadrant properties | ||||||
|---|---|---|---|---|---|---|---|
| Quadrant | DetID | PixID | Counts | Sigma | Mean | Median | Sigma |
| A | 5 | 203 | 58721 | 351.26 | 824 | 809 | 164.9 |
| A | 8 | 192 | 26506 | 155.86 | 824 | 809 | 164.9 |
| A | 14 | 239 | 22308 | 130.4 | 824 | 809 | 164.9 |
| B | 6 | 159 | 1849101 | 11812.46 | 817 | 795 | 156.5 |
| B | 6 | 36 | 249166 | 1587.33 | 817 | 795 | 156.5 |
| B | 12 | 111 | 19153 | 117.33 | 817 | 795 | 156.5 |
| C | 14 | 238 | 129838 | 697.5 | 793 | 800 | 185.0 |
| C | 3 | 233 | 80383 | 430.18 | 793 | 800 | 185.0 |
| C | 2 | 114 | 14999 | 76.75 | 793 | 800 | 185.0 |
| D | 13 | 104 | 123984 | 593.71 | 784 | 771 | 207.5 |
| D | 8 | 195 | 102193 | 488.71 | 784 | 771 | 207.5 |
| D | 2 | 250 | 28183 | 132.09 | 784 | 771 | 207.5 |
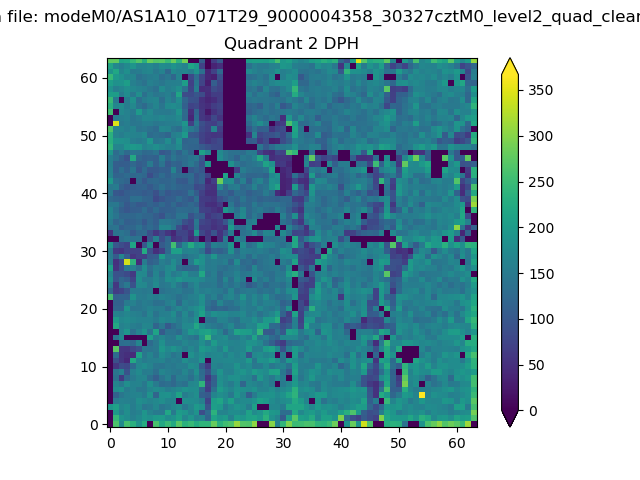
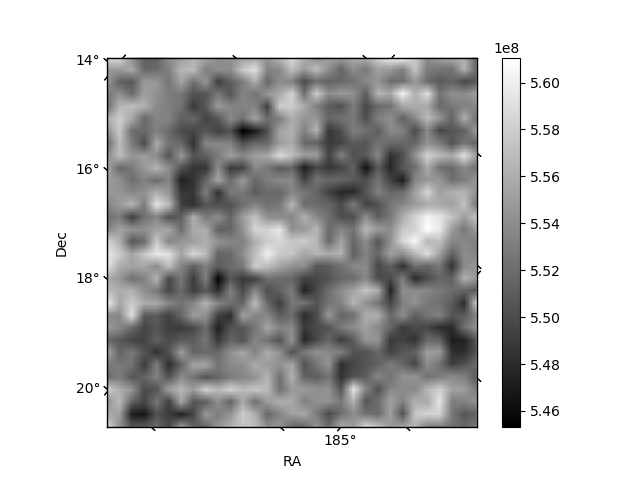
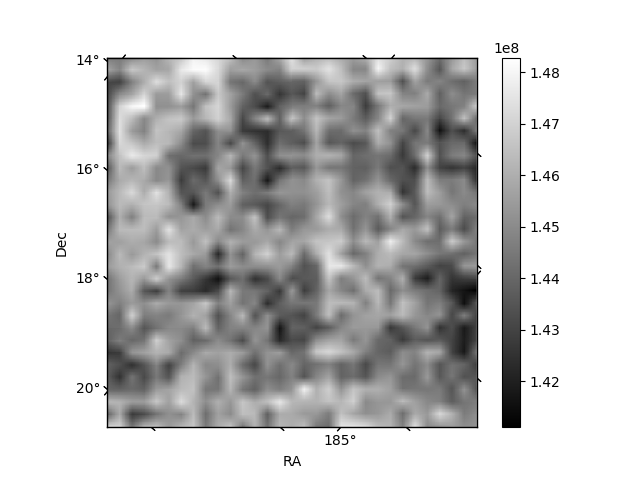
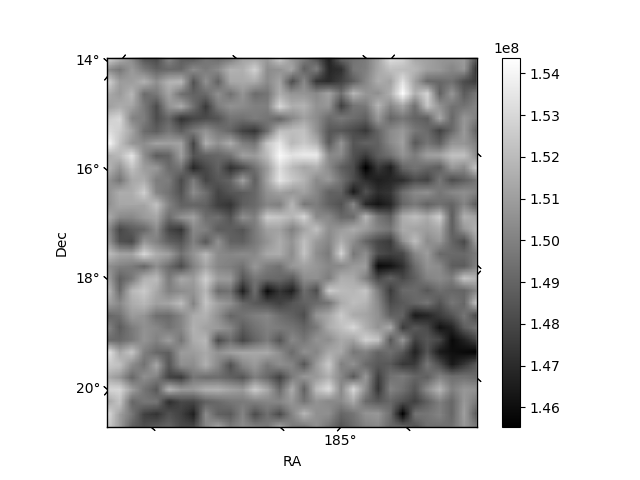
Histogram calculated using DETX and DETY for each event in the final _common_clean file
| Quadrant A | 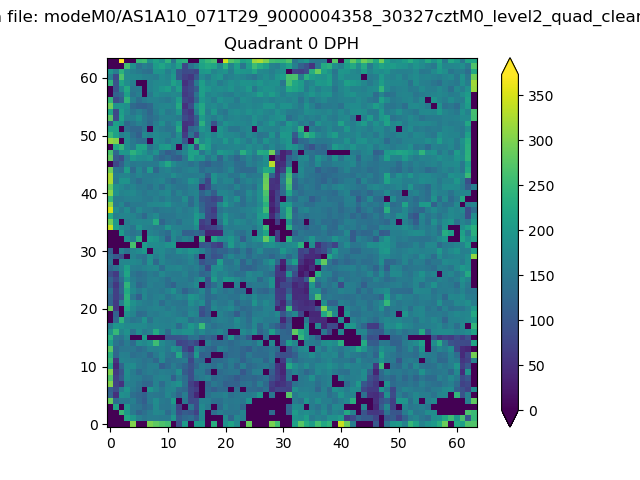 |
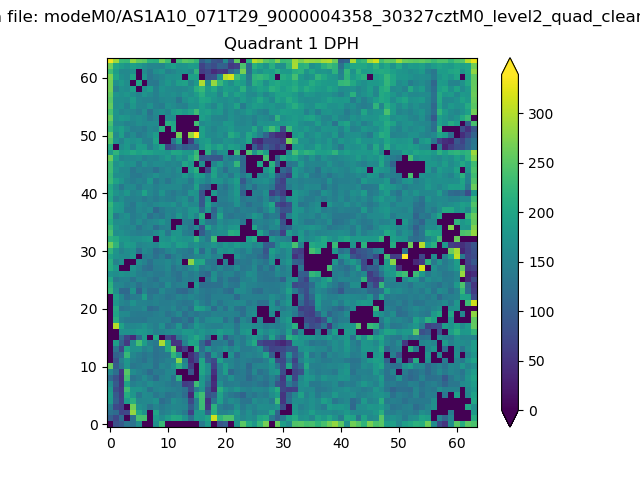 |
Quadrant B |
|---|---|---|---|
| Quadrant D | 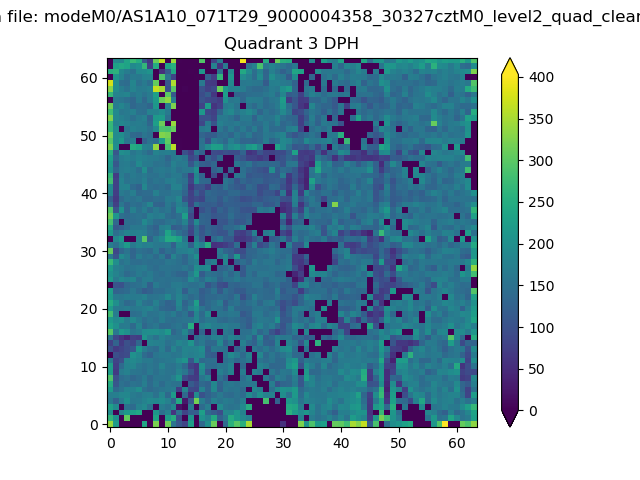 |
 |
Quadrant C |
| Plot type | Count rate plots | Images |
|---|---|---|
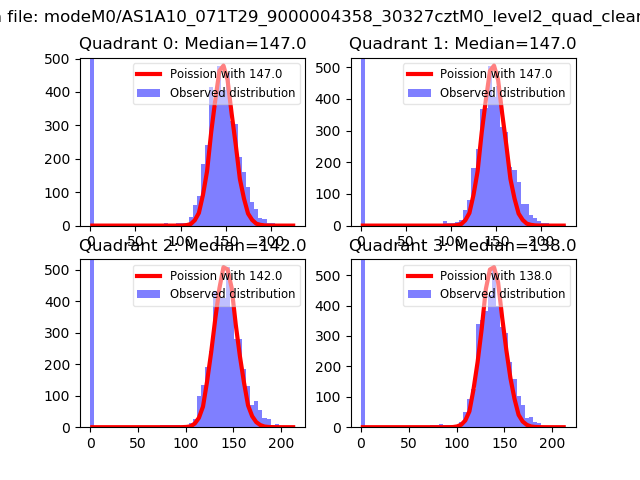
| Comparison with Poisson distribution Blue bars denote a histogram of data divided into 1 sec bins. Red curve is a Poisson curve with rate = median count rate of data. |
 |
 |
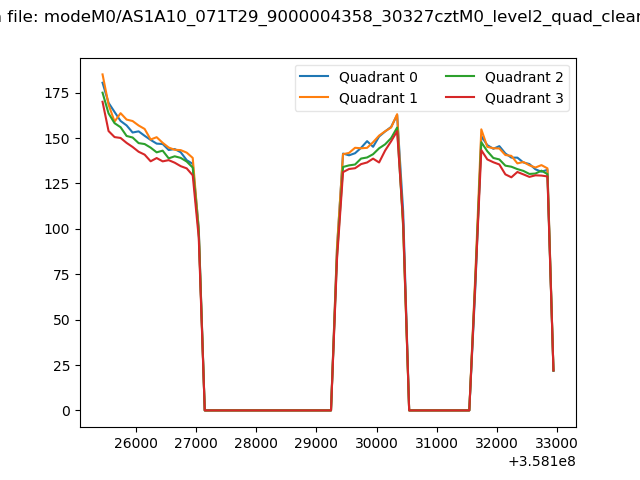
| Quadrant-wise count rates Data is divided into 100 sec bins |
 |
|
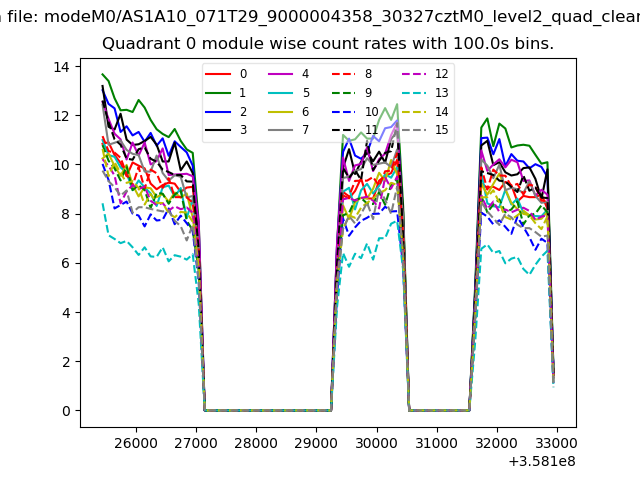
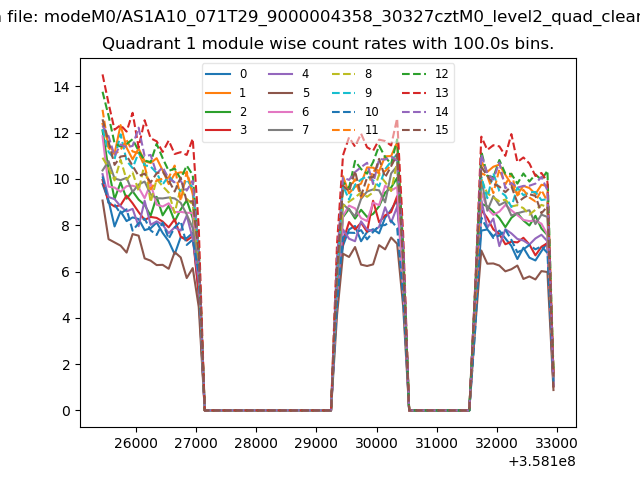
| Module-wise count rates for Quadrant A Data is divided into 100 sec bins |
 |
 |
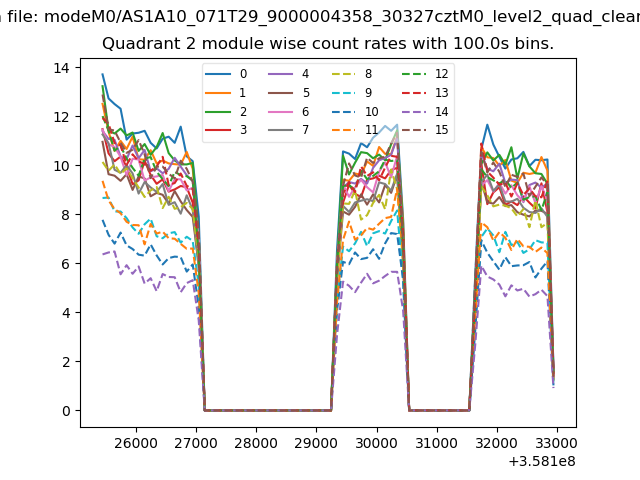
| Module-wise count rates for Quadrant B Data is divided into 100 sec bins |
 |
 |
| Module-wise count rates for Quadrant C Data is divided into 100 sec bins |
 |
 |
| Module-wise count rates for Quadrant D Data is divided into 100 sec bins |
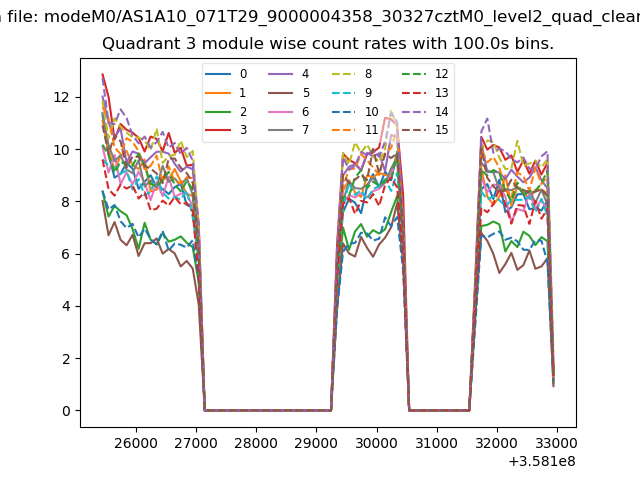 |
 |
| Parameter | Plot |
|---|---|
| CZT HV Monitor | 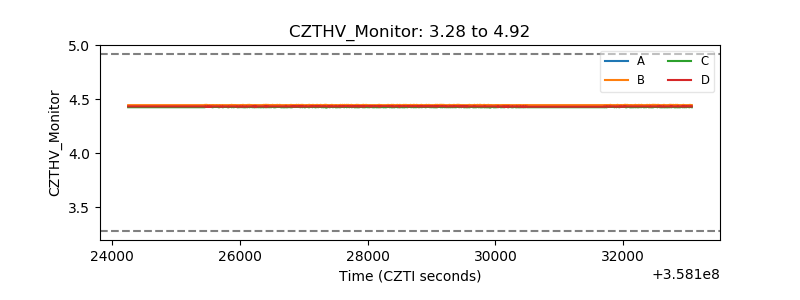 |
| D_VDD | 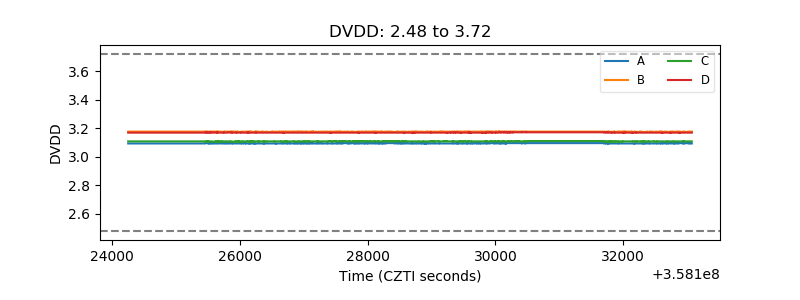 |
| Temperature 1 | 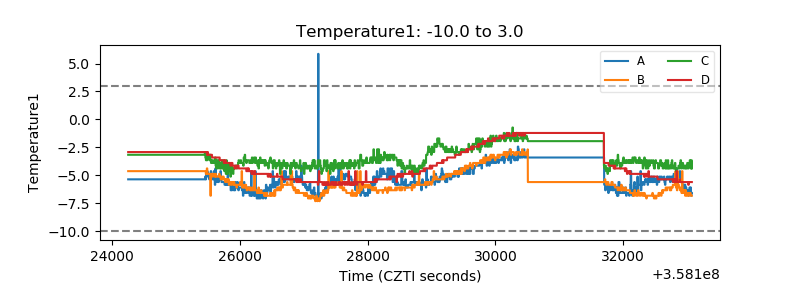 |
| Veto HV Monitor | 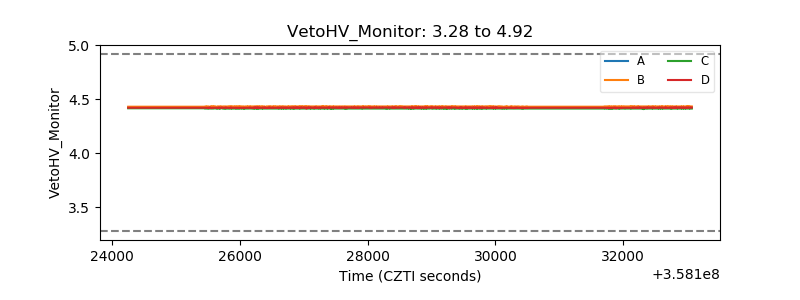 |
| Veto LLD | 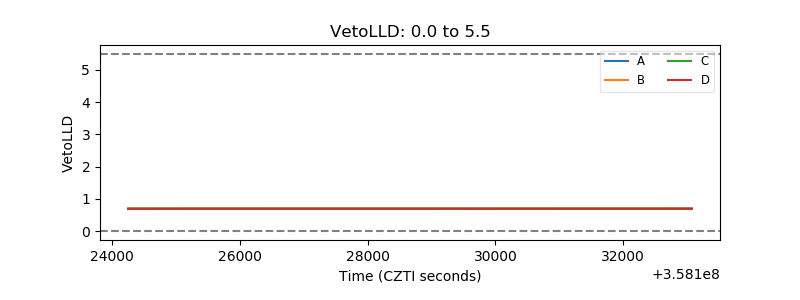 |
| Alpha Counter | 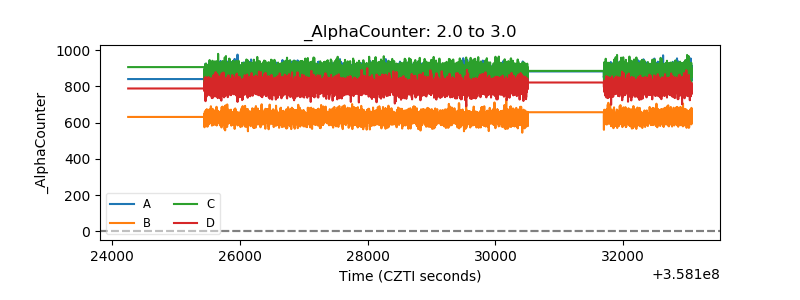 |
| _CPM_Rate | 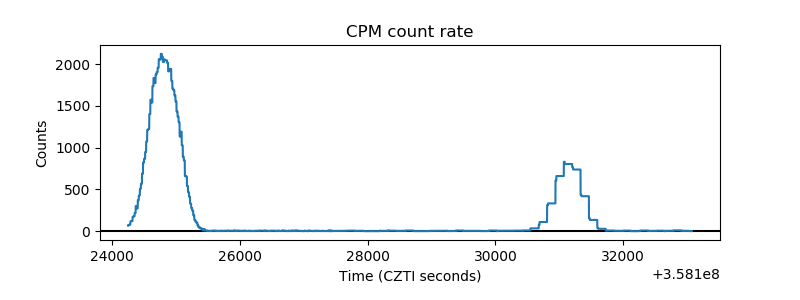 |
| CZT Counter | 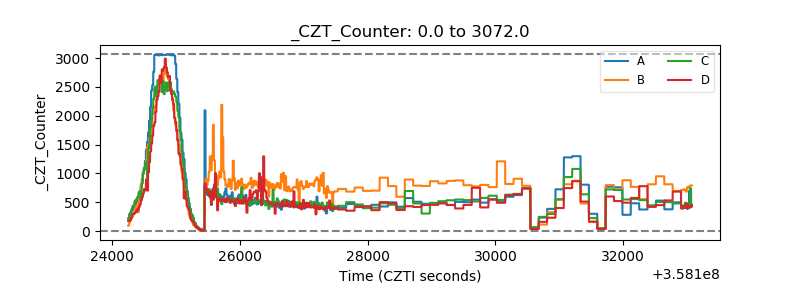 |
| +2.5 Volts monitor |  |
| +5 Volts monitor |  |
| _ROLL_ROT | 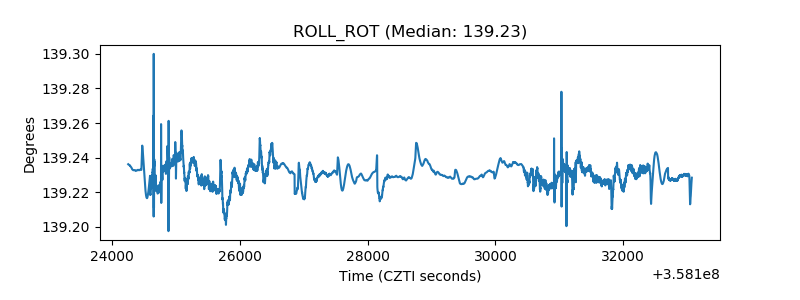 |
| _Roll_DEC | 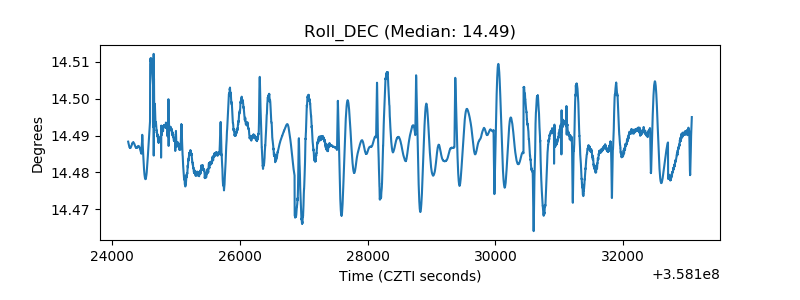 |
| _Roll_RA | 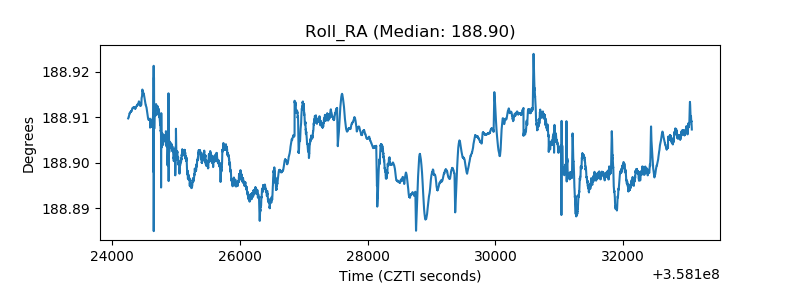 |
| Veto Counter | 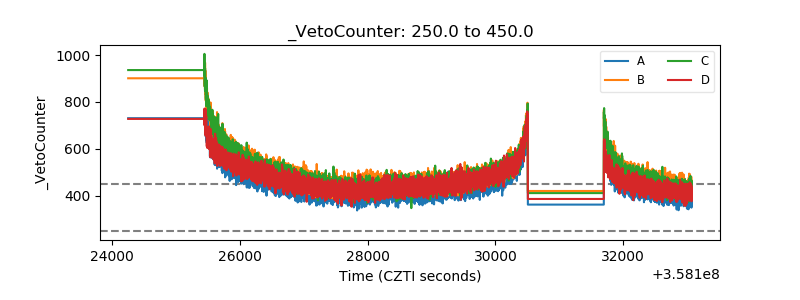 |