| Param | Original file | Final file |
|---|---|---|
| Filename | modeM0/AS1A10_071T29_9000004358_30329cztM0_level2.evt | modeM0/AS1A10_071T29_9000004358_30329cztM0_level2_quad_clean.evt |
| Size (bytes) | 569,208,960 | 88,701,120 |
| Size | 542.8 MB | 84.6 MB |
| Events in quadrant A | 3,937,026 | 550,305 |
| Events in quadrant B | 5,647,525 | 554,115 |
| Events in quadrant C | 3,622,613 | 538,079 |
| Events in quadrant D | 3,532,695 | 531,147 |
| Mode M9 | |||
|---|---|---|---|
| Quadrant | BADHDUFLAG | Total packets | Discarded packets |
| A | 0 | 8 | 0 |
| B | 0 | 9 | 0 |
| C | 0 | 9 | 0 |
| D | 0 | 9 | 0 |
| Mode SS | |||
|---|---|---|---|
| Quadrant | BADHDUFLAG | Total packets | Discarded packets |
| A | 0 | 148 | 0 |
| B | 0 | 148 | 0 |
| C | 0 | 148 | 0 |
| D | 0 | 148 | 0 |
| Mode M0 | |||
|---|---|---|---|
| Quadrant | BADHDUFLAG | Total packets | Discarded packets |
| A | 0 | 16362 | 2 |
| B | 0 | 22465 | 2 |
| C | 0 | 15267 | 2 |
| D | 0 | 15537 | 2 |
| Quadrant | Total seconds | Saturated seconds | Saturation percentage |
|---|---|---|---|
| A | 7364 | 104 | 1.412276% |
| B | 7364 | 179 | 2.430744% |
| C | 7364 | 107 | 1.453015% |
| D | 7364 | 41 | 0.556763% |
Noise dominated data is calculated using 1-second bins in cleaned event files. If a bin has >2000 counts, and if more than 50% of those come from <1% of pixels, then it is considered to be noise-dominated and hence unusable.
| Quadrant | # 1 sec bins | Bins with >0 counts | Bins with >2000 counts | High rate bins dominated by noise | Noise dominated (total time) | Noise dominated (detector-on time) | Marked lightcurve |
|---|---|---|---|---|---|---|---|
| A | 7754 | 7365 | 16 | 16 | 0.21% | 0.22% | 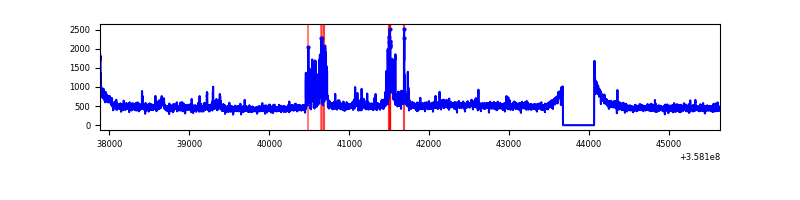 |
| B | 7754 | 7365 | 3 | 3 | 0.04% | 0.04% | 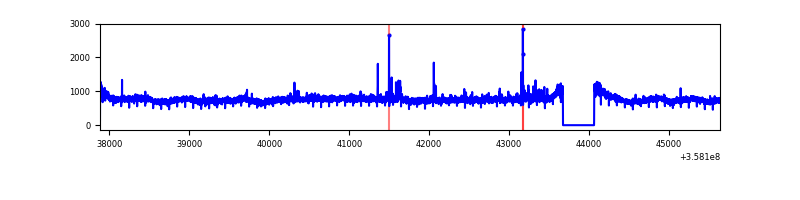 |
| C | 7754 | 7365 | 0 | 0 | 0.00% | 0.00% | 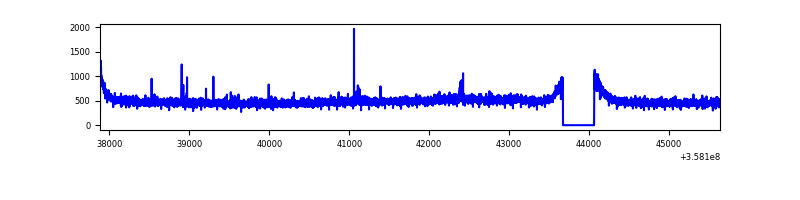 |
| D | 7754 | 7365 | 11 | 11 | 0.14% | 0.15% | 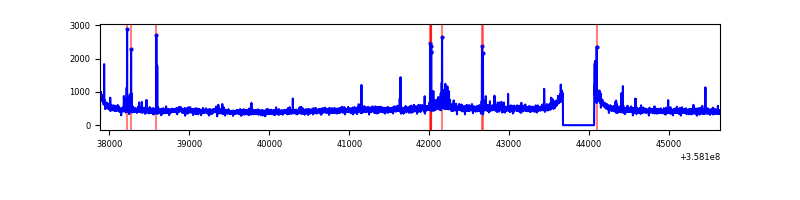 |
Top three noisy pixels from each quadrant. If the there are fewer than three noisy pixels in the level2.evt file, extra rows are filled as -1
| Pixel properties | Quadrant properties | ||||||
|---|---|---|---|---|---|---|---|
| Quadrant | DetID | PixID | Counts | Sigma | Mean | Median | Sigma |
| A | 14 | 239 | 392660 | 2140.42 | 905 | 886 | 183.0 |
| A | 5 | 203 | 29118 | 154.24 | 905 | 886 | 183.0 |
| A | 8 | 192 | 21357 | 111.84 | 905 | 886 | 183.0 |
| B | 6 | 159 | 1990946 | 11346.92 | 897 | 873 | 175.4 |
| B | 6 | 36 | 59634 | 335.04 | 897 | 873 | 175.4 |
| B | 0 | 190 | 55767 | 312.99 | 897 | 873 | 175.4 |
| C | 14 | 238 | 147157 | 706.84 | 874 | 877 | 206.9 |
| C | 3 | 233 | 39832 | 188.24 | 874 | 877 | 206.9 |
| C | 2 | 114 | 16785 | 76.87 | 874 | 877 | 206.9 |
| D | 2 | 250 | 88932 | 394.32 | 872 | 852 | 223.4 |
| D | 8 | 195 | 86985 | 385.6 | 872 | 852 | 223.4 |
| D | 2 | 234 | 29251 | 127.14 | 872 | 852 | 223.4 |
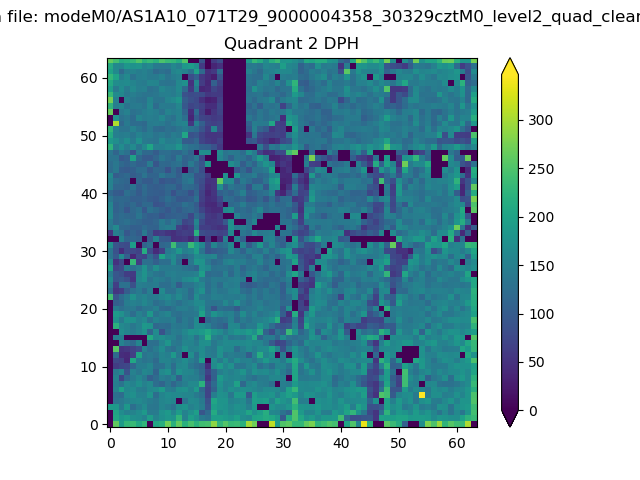
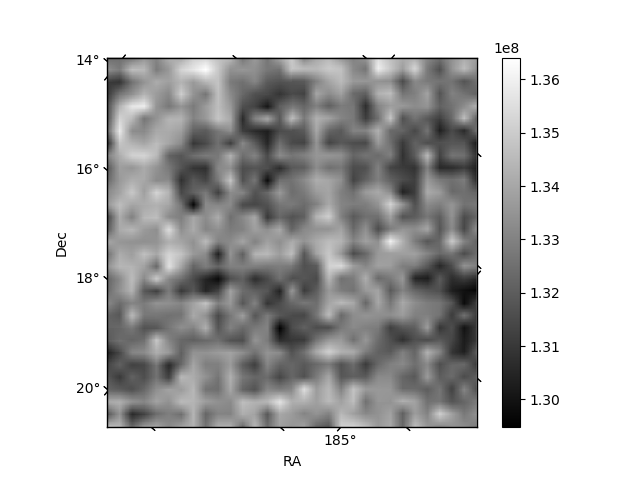
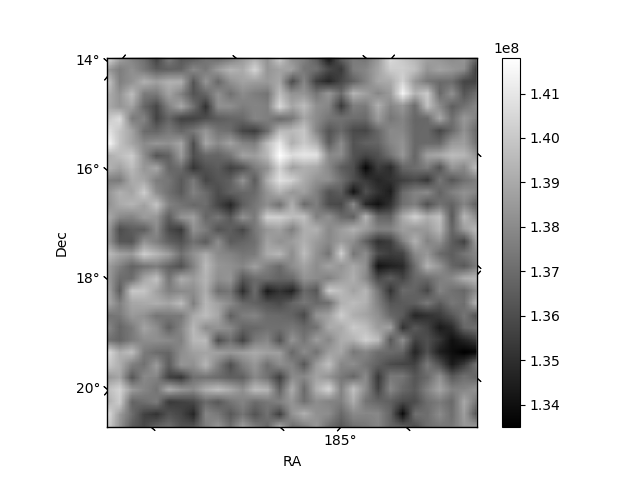
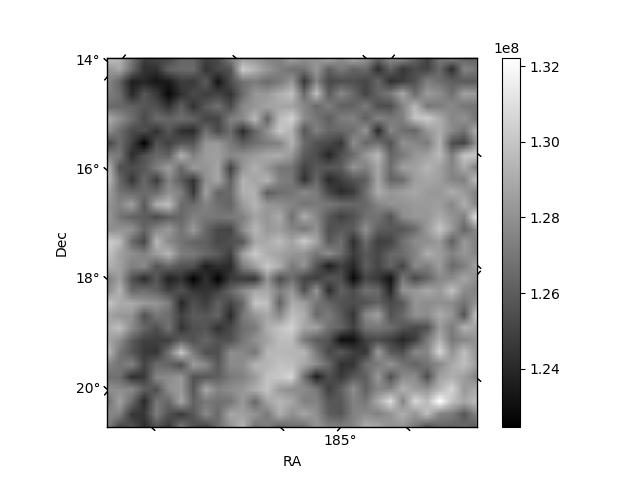
Histogram calculated using DETX and DETY for each event in the final _common_clean file
| Quadrant A | 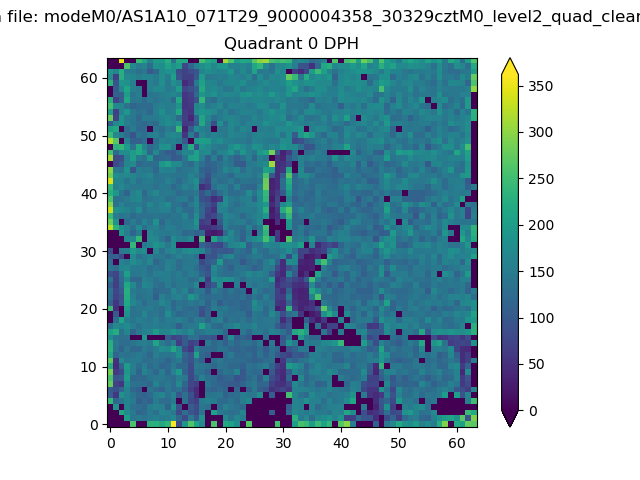 |
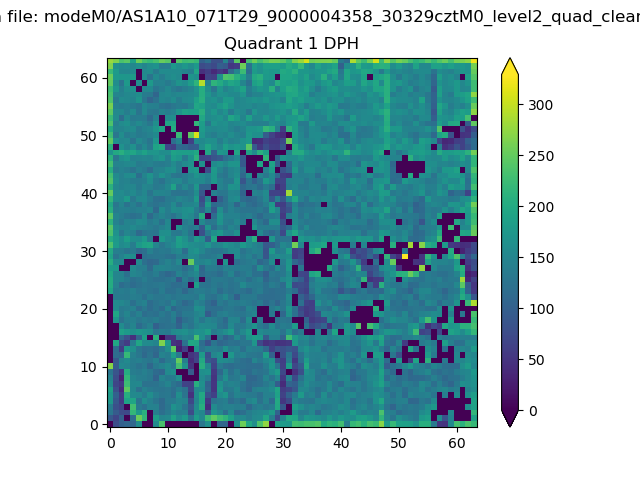 |
Quadrant B |
|---|---|---|---|
| Quadrant D | 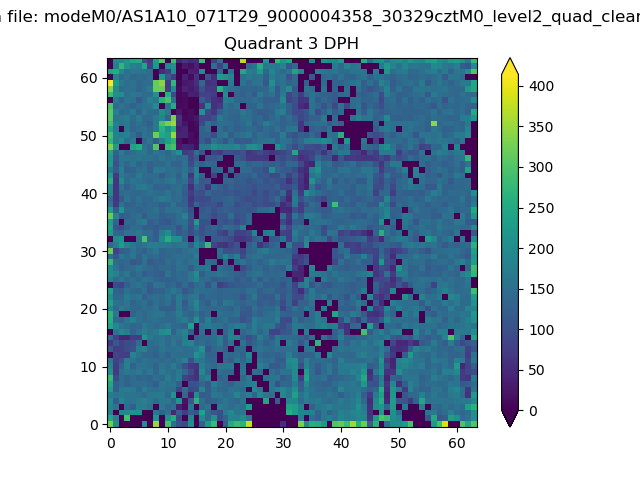 |
 |
Quadrant C |
| Plot type | Count rate plots | Images |
|---|---|---|
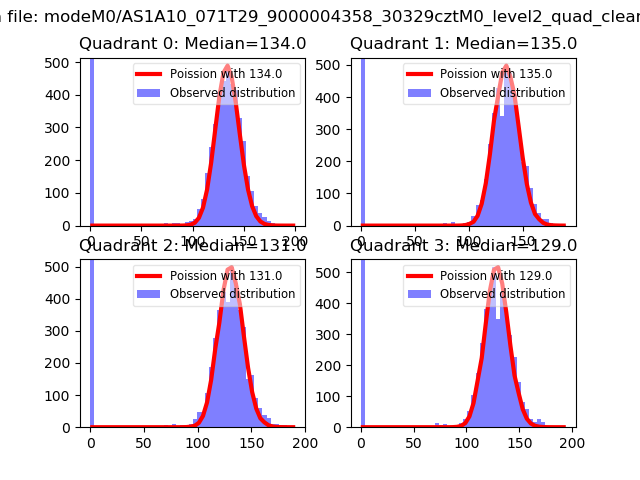
| Comparison with Poisson distribution Blue bars denote a histogram of data divided into 1 sec bins. Red curve is a Poisson curve with rate = median count rate of data. |
 |
 |
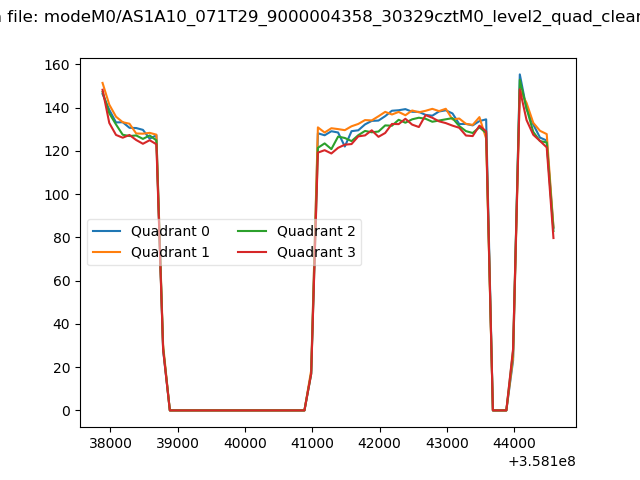
| Quadrant-wise count rates Data is divided into 100 sec bins |
 |
|
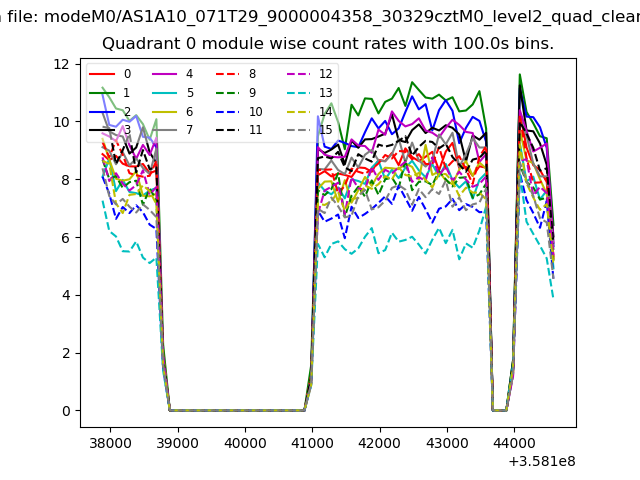
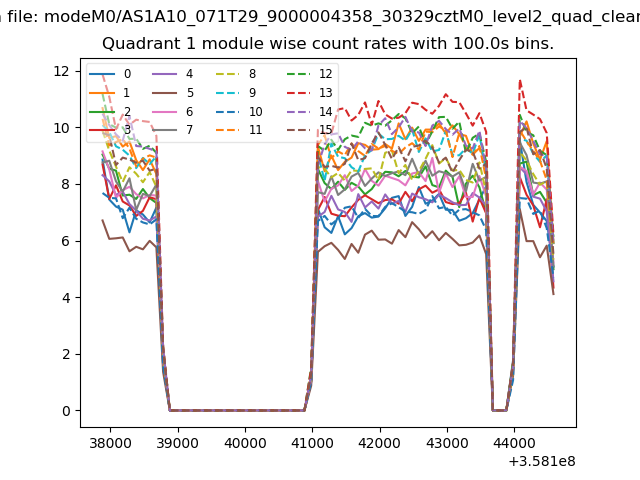
| Module-wise count rates for Quadrant A Data is divided into 100 sec bins |
 |
 |
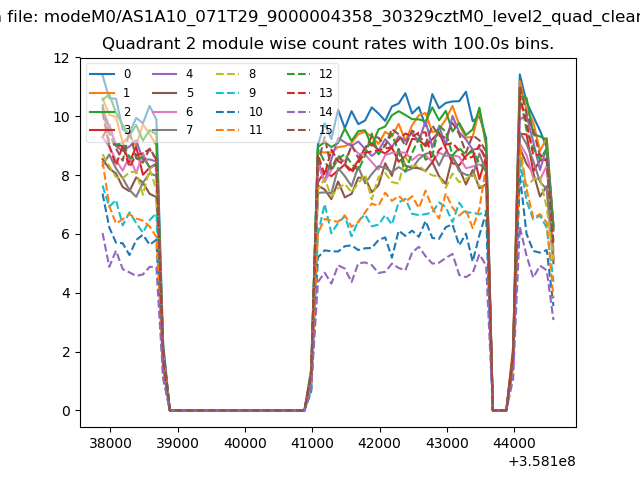
| Module-wise count rates for Quadrant B Data is divided into 100 sec bins |
 |
 |
| Module-wise count rates for Quadrant C Data is divided into 100 sec bins |
 |
 |
| Module-wise count rates for Quadrant D Data is divided into 100 sec bins |
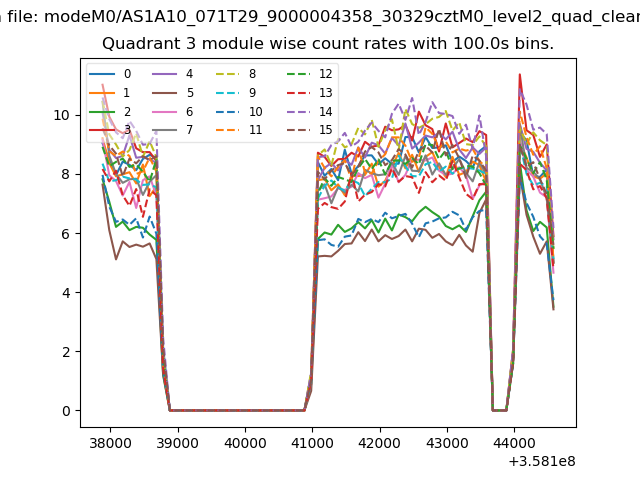 |
 |
| Parameter | Plot |
|---|---|
| CZT HV Monitor |  |
| D_VDD | 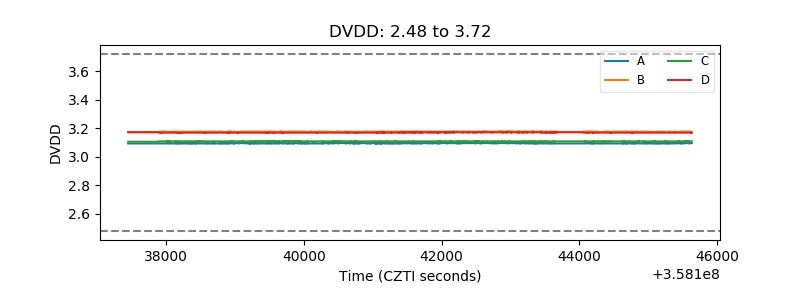 |
| Temperature 1 |  |
| Veto HV Monitor | 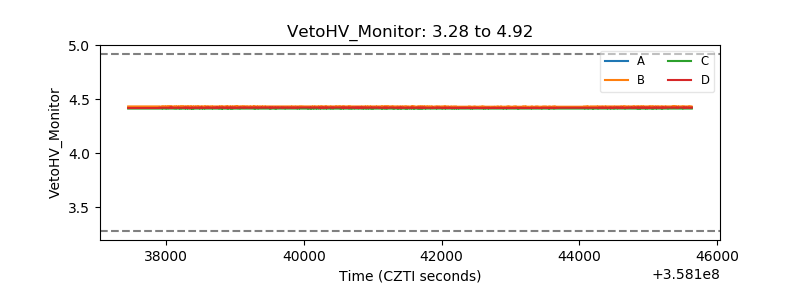 |
| Veto LLD | 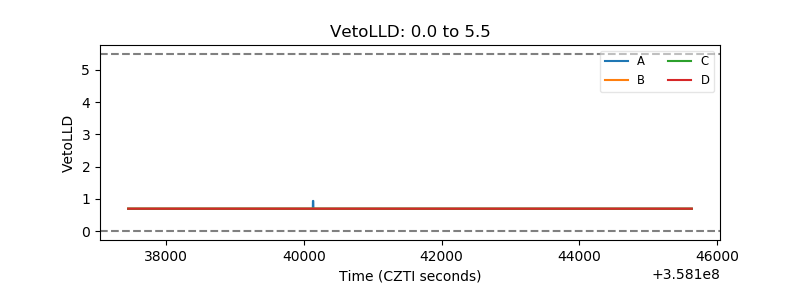 |
| Alpha Counter | 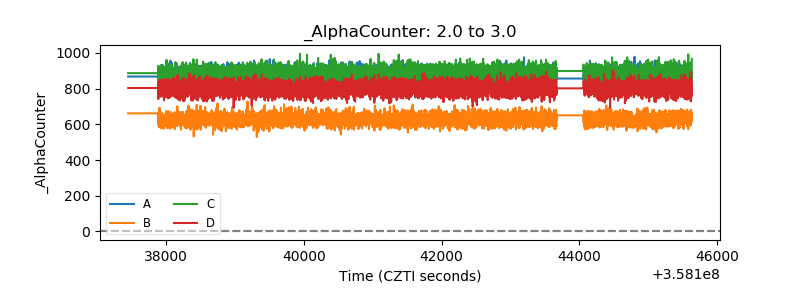 |
| _CPM_Rate | 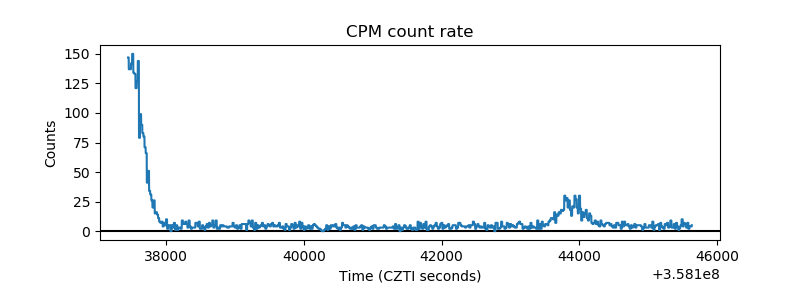 |
| CZT Counter | 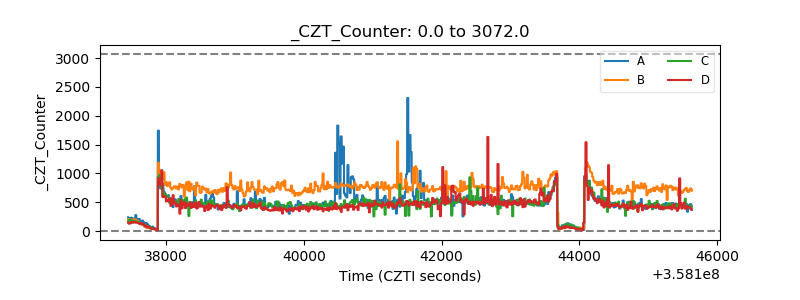 |
| +2.5 Volts monitor |  |
| +5 Volts monitor |  |
| _ROLL_ROT | 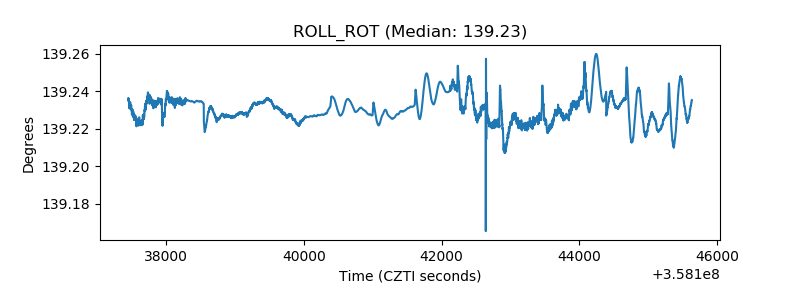 |
| _Roll_DEC | 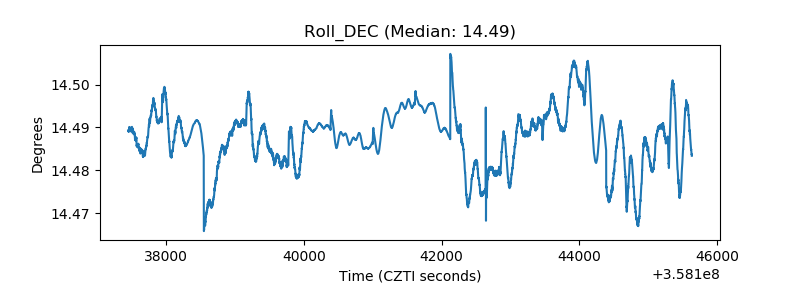 |
| _Roll_RA | 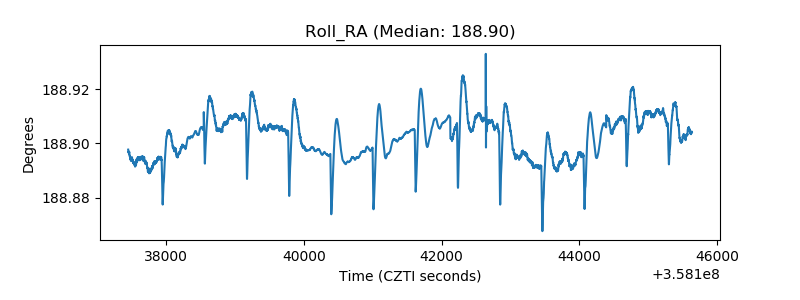 |
| Veto Counter | 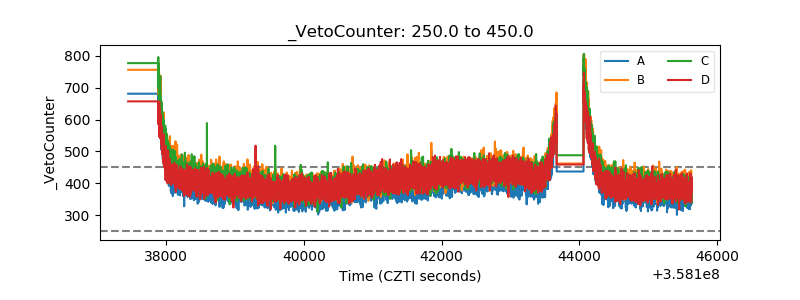 |