| Param | Original file | Final file |
|---|---|---|
| Filename | modeM0/AS1A10_071T29_9000004358_30330cztM0_level2.evt | modeM0/AS1A10_071T29_9000004358_30330cztM0_level2_quad_clean.evt |
| Size (bytes) | 605,295,360 | 83,266,560 |
| Size | 577.3 MB | 79.4 MB |
| Events in quadrant A | 3,776,778 | 509,786 |
| Events in quadrant B | 5,842,131 | 509,735 |
| Events in quadrant C | 3,778,728 | 493,698 |
| Events in quadrant D | 4,416,754 | 477,191 |
| Mode M9 | |||
|---|---|---|---|
| Quadrant | BADHDUFLAG | Total packets | Discarded packets |
| A | 0 | 1 | 0 |
| B | 0 | 1 | 0 |
| C | 0 | 1 | 0 |
| D | 0 | 1 | 0 |
| Mode SS | |||
|---|---|---|---|
| Quadrant | BADHDUFLAG | Total packets | Discarded packets |
| A | 0 | 154 | 0 |
| B | 0 | 154 | 0 |
| C | 0 | 154 | 0 |
| D | 0 | 154 | 0 |
| Mode M0 | |||
|---|---|---|---|
| Quadrant | BADHDUFLAG | Total packets | Discarded packets |
| A | 0 | 16037 | 1 |
| B | 0 | 23232 | 1 |
| C | 0 | 16017 | 1 |
| D | 0 | 18444 | 1 |
| Quadrant | Total seconds | Saturated seconds | Saturation percentage |
|---|---|---|---|
| A | 7629 | 235 | 3.080351% |
| B | 7630 | 329 | 4.311927% |
| C | 7630 | 238 | 3.119266% |
| D | 7630 | 412 | 5.399738% |
Noise dominated data is calculated using 1-second bins in cleaned event files. If a bin has >2000 counts, and if more than 50% of those come from <1% of pixels, then it is considered to be noise-dominated and hence unusable.
| Quadrant | # 1 sec bins | Bins with >0 counts | Bins with >2000 counts | High rate bins dominated by noise | Noise dominated (total time) | Noise dominated (detector-on time) | Marked lightcurve |
|---|---|---|---|---|---|---|---|
| A | 7699 | 7630 | 0 | 0 | 0.00% | 0.00% | 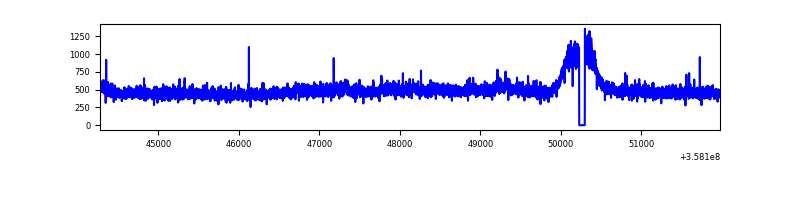 |
| B | 7700 | 7630 | 3 | 3 | 0.04% | 0.04% | 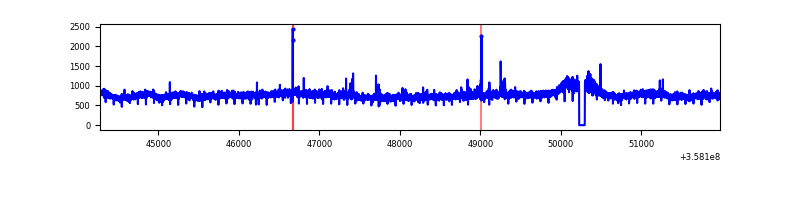 |
| C | 7700 | 7630 | 1 | 1 | 0.01% | 0.01% | 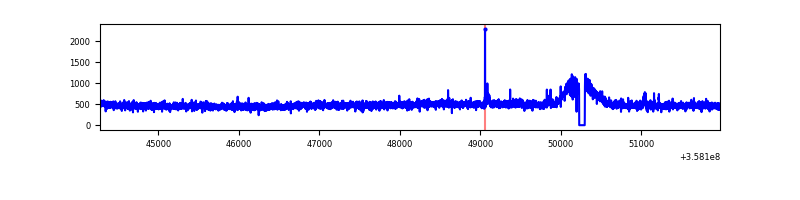 |
| D | 7700 | 7630 | 243 | 243 | 3.16% | 3.18% | 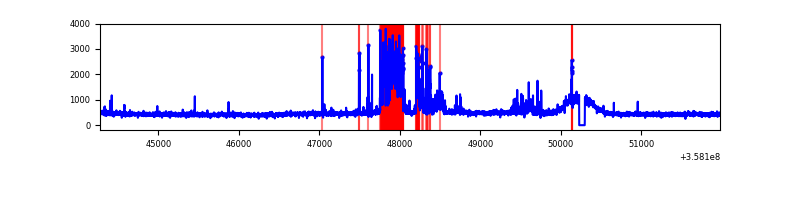 |
Top three noisy pixels from each quadrant. If the there are fewer than three noisy pixels in the level2.evt file, extra rows are filled as -1
| Pixel properties | Quadrant properties | ||||||
|---|---|---|---|---|---|---|---|
| Quadrant | DetID | PixID | Counts | Sigma | Mean | Median | Sigma |
| A | 14 | 239 | 84329 | 432.25 | 948 | 928 | 192.9 |
| A | 5 | 203 | 29206 | 146.56 | 948 | 928 | 192.9 |
| A | 13 | 254 | 13902 | 67.24 | 948 | 928 | 192.9 |
| B | 6 | 159 | 2110682 | 11444.58 | 933 | 907 | 184.3 |
| B | 6 | 36 | 27469 | 144.09 | 933 | 907 | 184.3 |
| B | 0 | 190 | 25182 | 131.68 | 933 | 907 | 184.3 |
| C | 14 | 238 | 151901 | 698.99 | 908 | 912 | 216.0 |
| C | 3 | 233 | 40559 | 183.54 | 908 | 912 | 216.0 |
| C | 2 | 114 | 17830 | 78.32 | 908 | 912 | 216.0 |
| D | 13 | 104 | 756292 | 3183.22 | 901 | 882 | 237.3 |
| D | 2 | 250 | 121773 | 509.42 | 901 | 882 | 237.3 |
| D | 8 | 195 | 93890 | 391.93 | 901 | 882 | 237.3 |
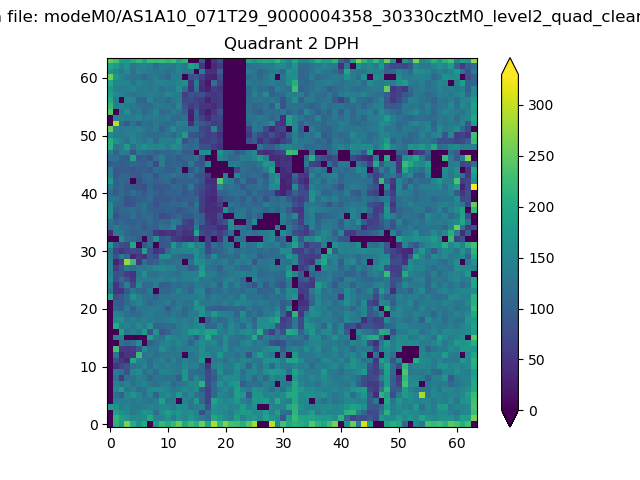
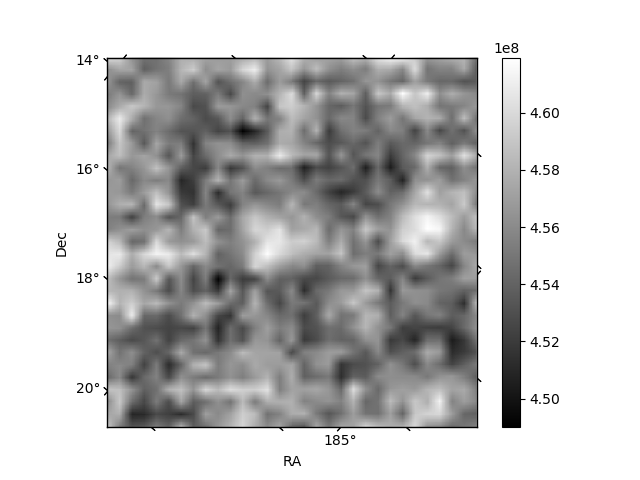
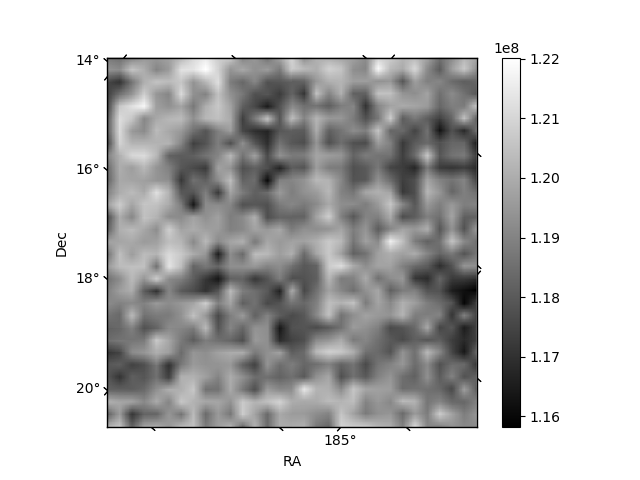
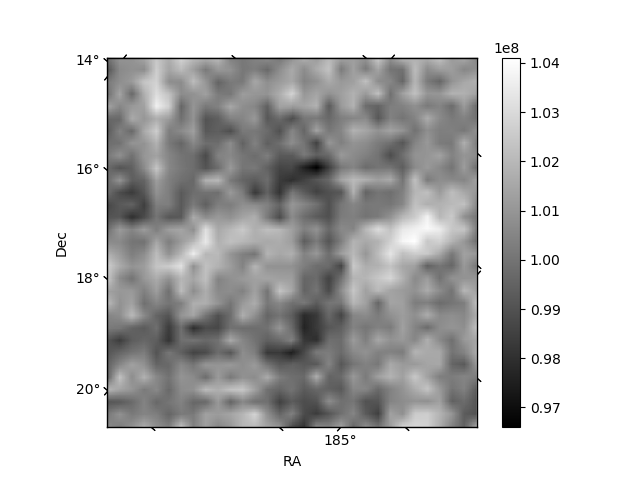
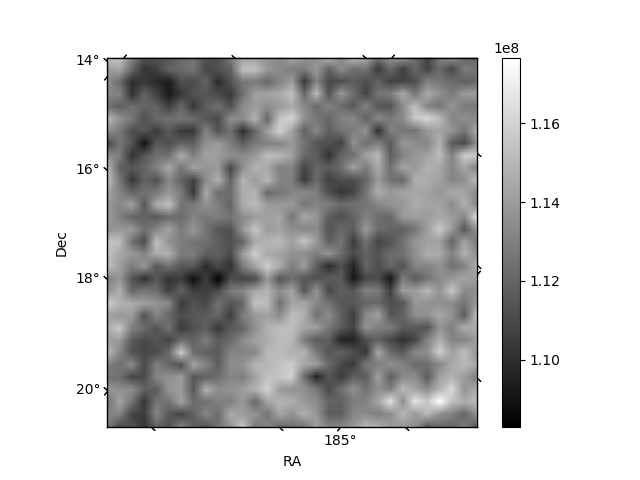
Histogram calculated using DETX and DETY for each event in the final _common_clean file
| Quadrant A | 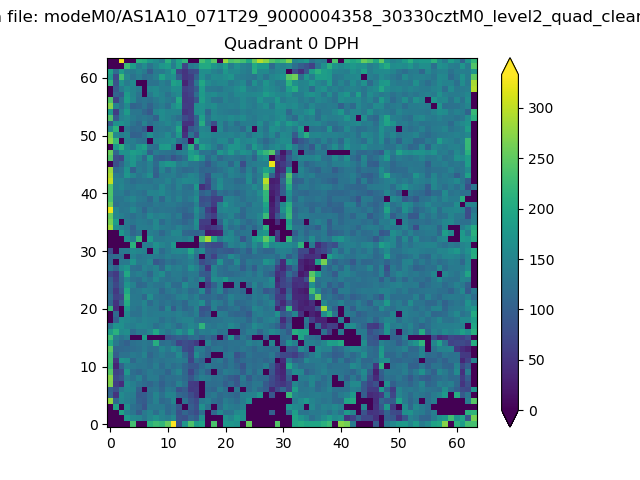 |
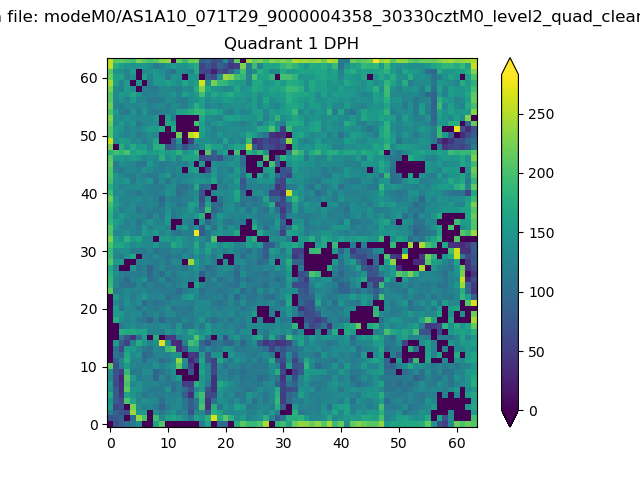 |
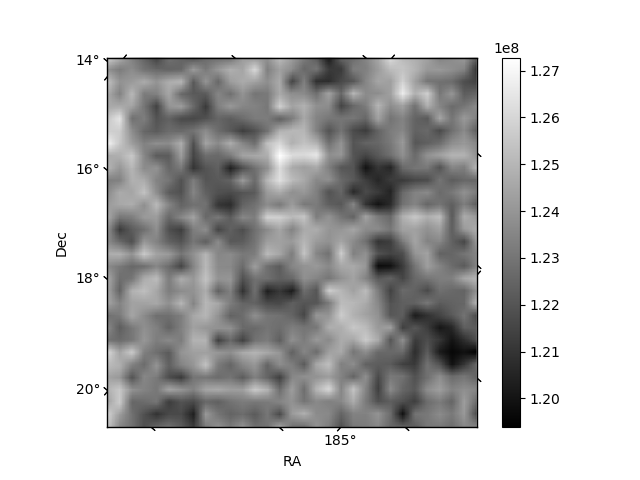
Quadrant B |
|---|---|---|---|
| Quadrant D | 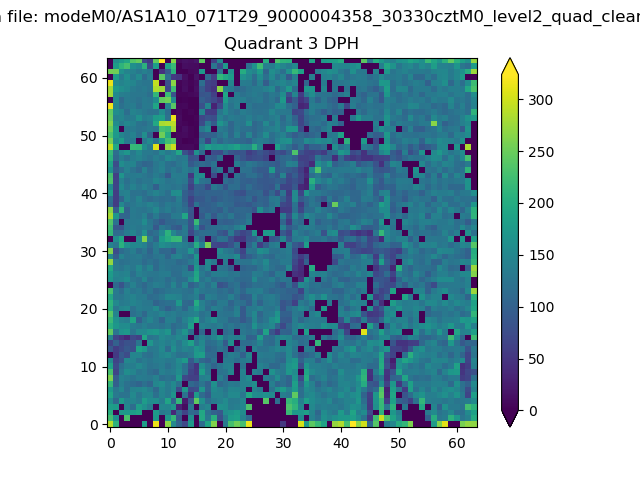 |
 |
Quadrant C |
| Plot type | Count rate plots | Images |
|---|---|---|
| Comparison with Poisson distribution Blue bars denote a histogram of data divided into 1 sec bins. Red curve is a Poisson curve with rate = median count rate of data. |
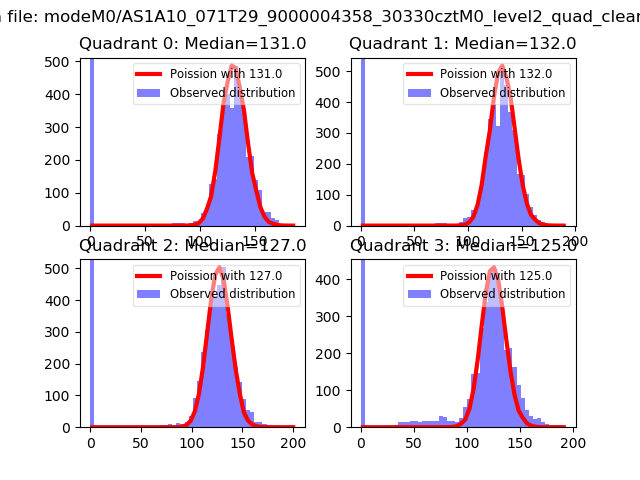 |
 |
| Quadrant-wise count rates Data is divided into 100 sec bins |
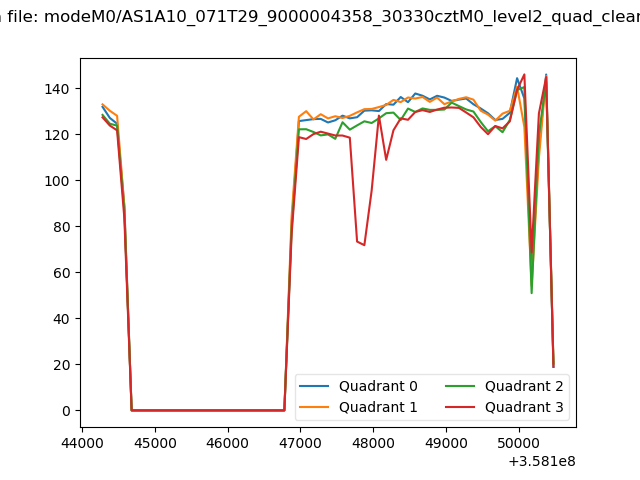 |
|
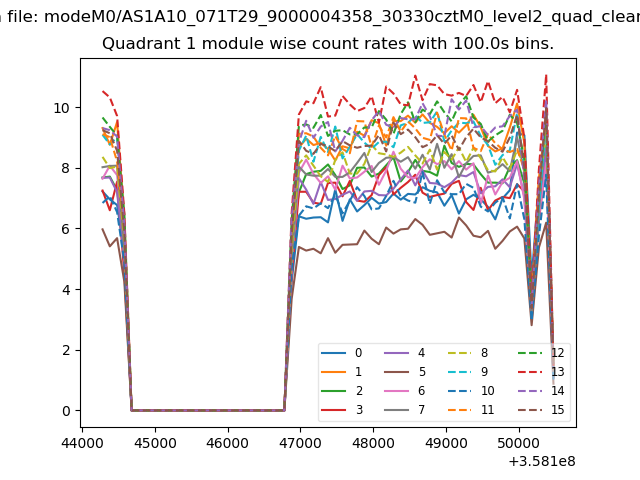
| Module-wise count rates for Quadrant A Data is divided into 100 sec bins |
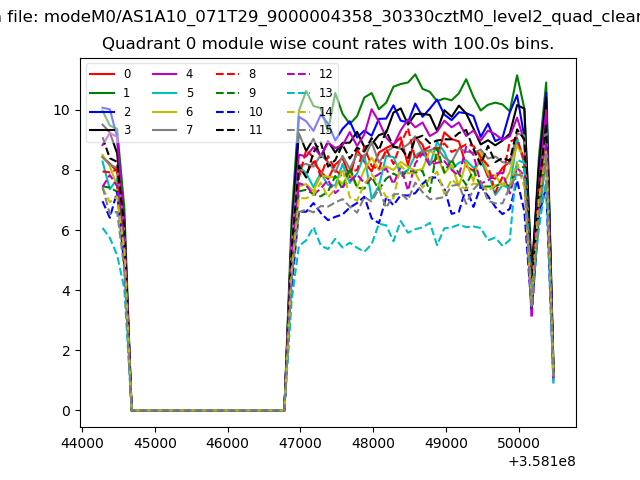 |
 |
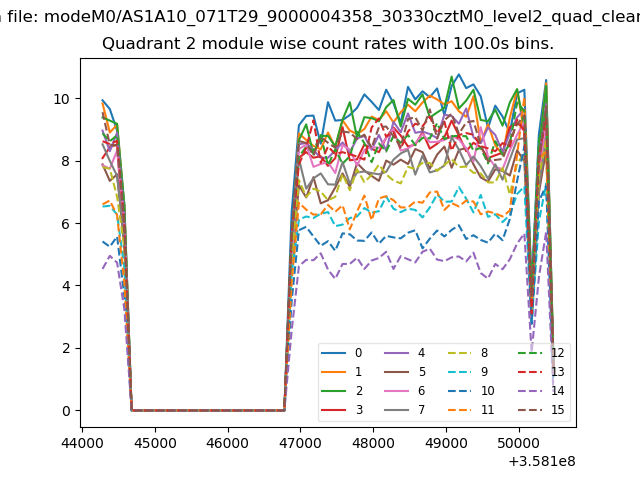
| Module-wise count rates for Quadrant B Data is divided into 100 sec bins |
 |
 |
| Module-wise count rates for Quadrant C Data is divided into 100 sec bins |
 |
 |
| Module-wise count rates for Quadrant D Data is divided into 100 sec bins |
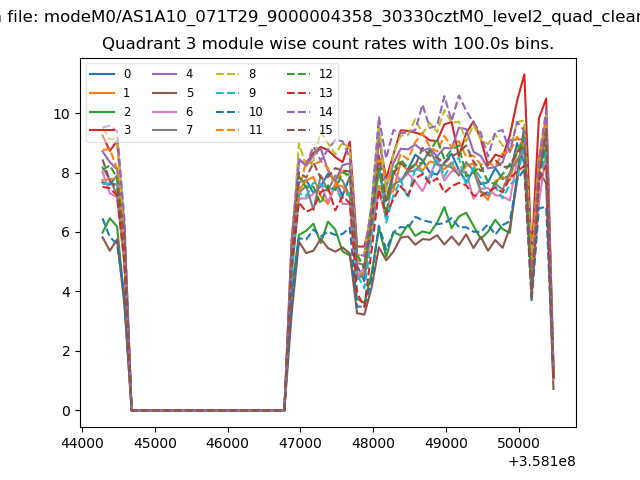 |
 |
| Parameter | Plot |
|---|---|
| CZT HV Monitor | 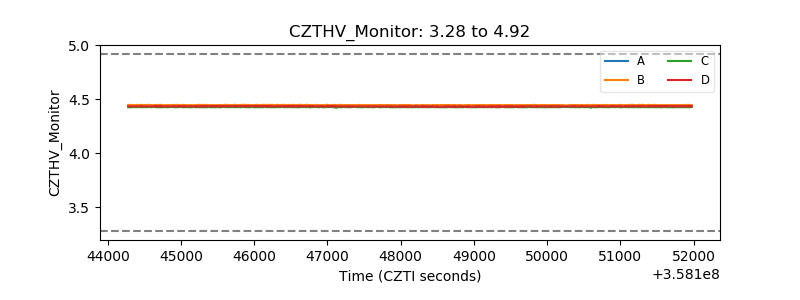 |
| D_VDD | 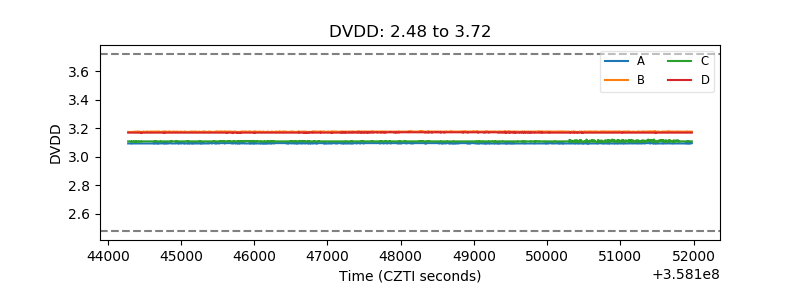 |
| Temperature 1 | 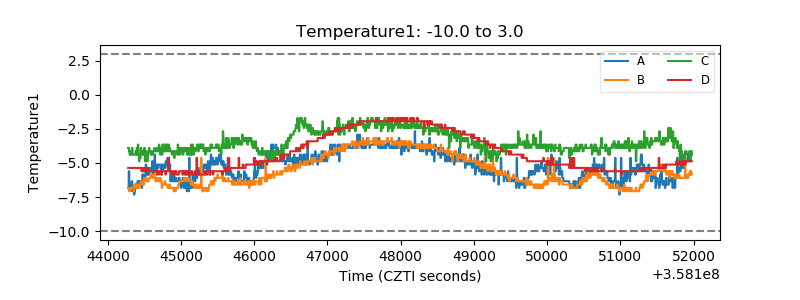 |
| Veto HV Monitor | 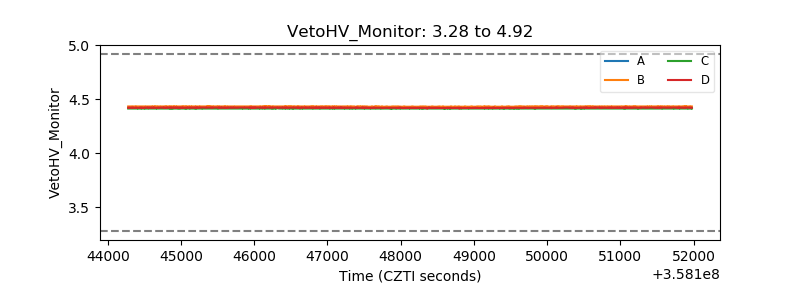 |
| Veto LLD | 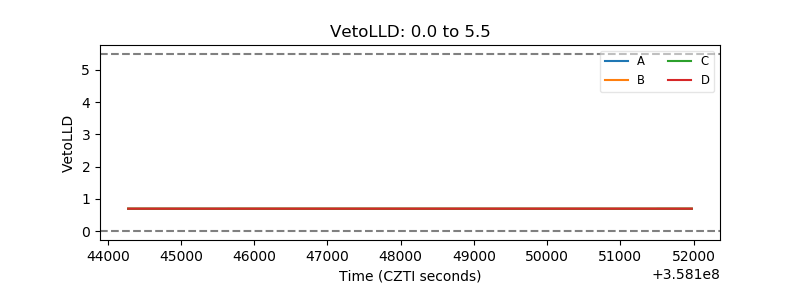 |
| Alpha Counter | 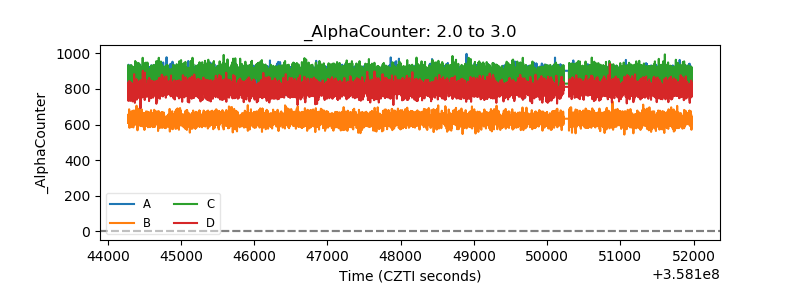 |
| _CPM_Rate | 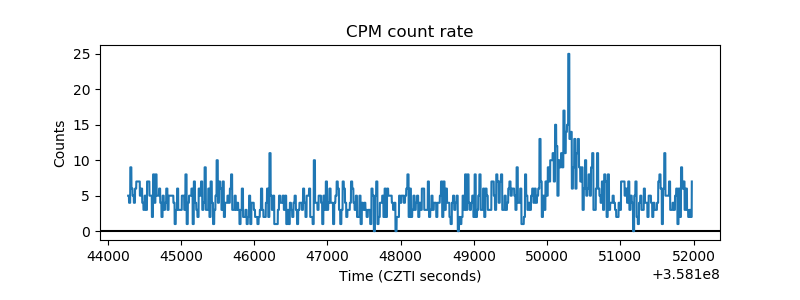 |
| CZT Counter | 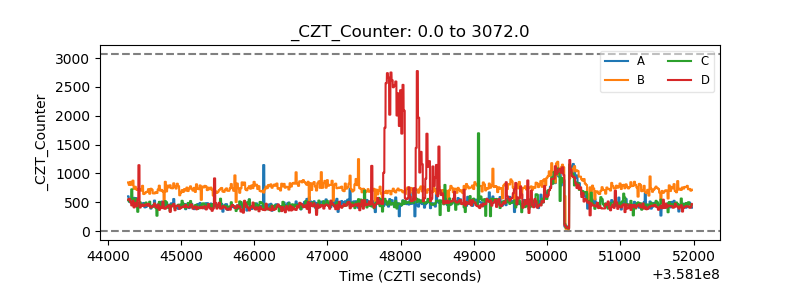 |
| +2.5 Volts monitor |  |
| +5 Volts monitor | 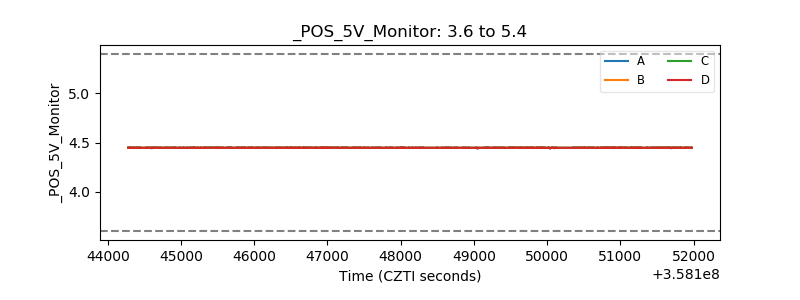 |
| _ROLL_ROT | 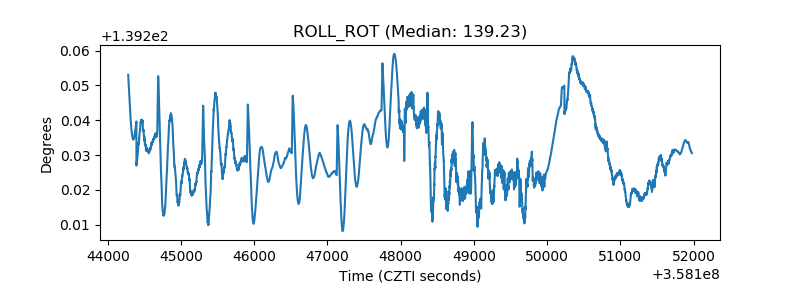 |
| _Roll_DEC | 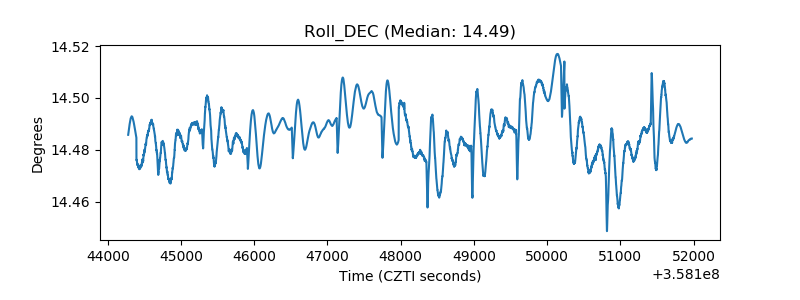 |
| _Roll_RA | 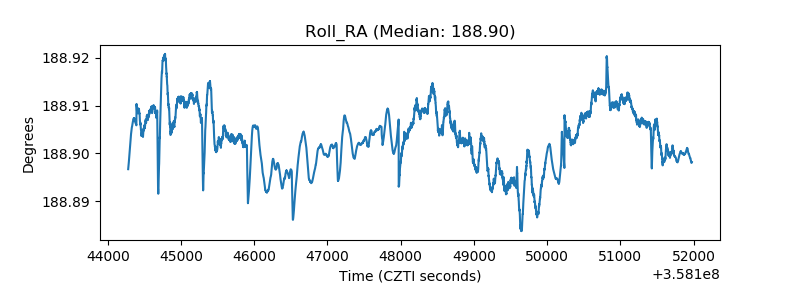 |
| Veto Counter | 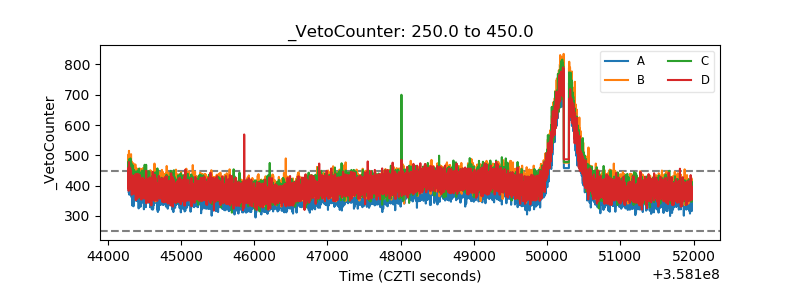 |