| Param | Original file | Final file |
|---|---|---|
| Filename | modeM0/AS1A10_071T29_9000004358_30331cztM0_level2.evt | modeM0/AS1A10_071T29_9000004358_30331cztM0_level2_quad_clean.evt |
| Size (bytes) | 652,783,680 | 98,179,200 |
| Size | 622.5 MB | 93.6 MB |
| Events in quadrant A | 4,218,841 | 605,846 |
| Events in quadrant B | 6,494,910 | 603,658 |
| Events in quadrant C | 4,247,173 | 587,144 |
| Events in quadrant D | 4,233,959 | 587,100 |
| Mode M9 | |||
|---|---|---|---|
| Quadrant | BADHDUFLAG | Total packets | Discarded packets |
| A | 0 | 5 | 0 |
| B | 0 | 5 | 0 |
| C | 0 | 5 | 0 |
| D | 0 | 5 | 0 |
| Mode SS | |||
|---|---|---|---|
| Quadrant | BADHDUFLAG | Total packets | Discarded packets |
| A | 0 | 174 | 0 |
| B | 0 | 174 | 0 |
| C | 0 | 174 | 0 |
| D | 0 | 174 | 0 |
| Mode M0 | |||
|---|---|---|---|
| Quadrant | BADHDUFLAG | Total packets | Discarded packets |
| A | 0 | 17947 | 2 |
| B | 0 | 25879 | 2 |
| C | 0 | 17949 | 2 |
| D | 0 | 18317 | 2 |
| Quadrant | Total seconds | Saturated seconds | Saturation percentage |
|---|---|---|---|
| A | 8486 | 295 | 3.476314% |
| B | 8487 | 415 | 4.889832% |
| C | 8487 | 300 | 3.534818% |
| D | 8487 | 180 | 2.120891% |
Noise dominated data is calculated using 1-second bins in cleaned event files. If a bin has >2000 counts, and if more than 50% of those come from <1% of pixels, then it is considered to be noise-dominated and hence unusable.
| Quadrant | # 1 sec bins | Bins with >0 counts | Bins with >2000 counts | High rate bins dominated by noise | Noise dominated (total time) | Noise dominated (detector-on time) | Marked lightcurve |
|---|---|---|---|---|---|---|---|
| A | 8906 | 8488 | 0 | 0 | 0.00% | 0.00% | 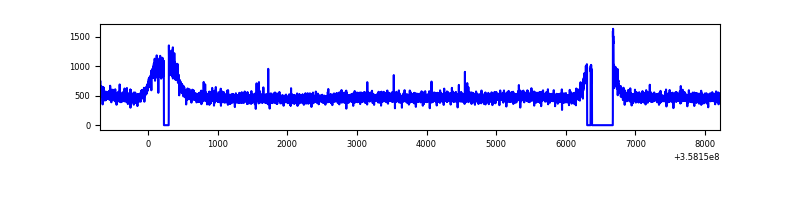 |
| B | 8907 | 8488 | 0 | 0 | 0.00% | 0.00% | 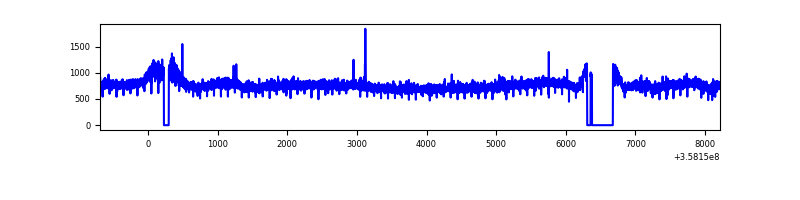 |
| C | 8907 | 8488 | 0 | 0 | 0.00% | 0.00% | 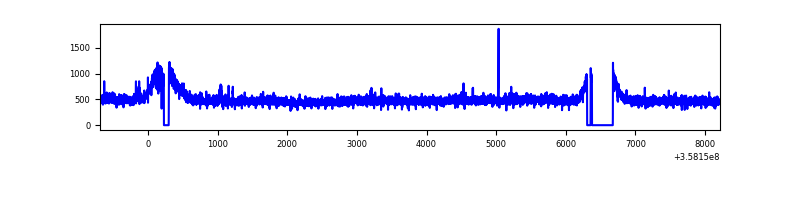 |
| D | 8907 | 8488 | 11 | 11 | 0.12% | 0.13% | 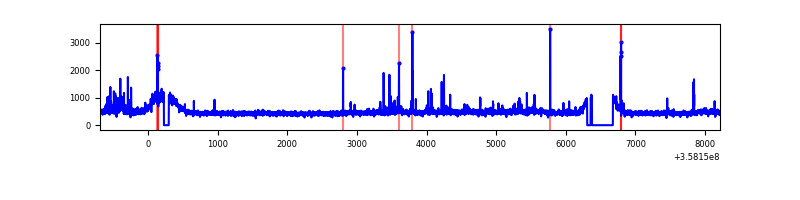 |
Top three noisy pixels from each quadrant. If the there are fewer than three noisy pixels in the level2.evt file, extra rows are filled as -1
| Pixel properties | Quadrant properties | ||||||
|---|---|---|---|---|---|---|---|
| Quadrant | DetID | PixID | Counts | Sigma | Mean | Median | Sigma |
| A | 14 | 239 | 46312 | 207.05 | 1070 | 1043 | 218.6 |
| A | 5 | 203 | 30240 | 133.54 | 1070 | 1043 | 218.6 |
| A | 13 | 254 | 16675 | 71.5 | 1070 | 1043 | 218.6 |
| B | 6 | 159 | 2337897 | 11267.94 | 1051 | 1021 | 207.4 |
| B | 12 | 111 | 27469 | 127.53 | 1051 | 1021 | 207.4 |
| B | 11 | 111 | 24902 | 115.15 | 1051 | 1021 | 207.4 |
| C | 14 | 238 | 169252 | 688.37 | 1024 | 1027 | 244.4 |
| C | 3 | 233 | 50489 | 202.4 | 1024 | 1027 | 244.4 |
| C | 2 | 114 | 20280 | 78.78 | 1024 | 1027 | 244.4 |
| D | 2 | 250 | 123291 | 452.86 | 1032 | 1012 | 270.0 |
| D | 8 | 195 | 120516 | 442.58 | 1032 | 1012 | 270.0 |
| D | 2 | 234 | 34680 | 124.69 | 1032 | 1012 | 270.0 |
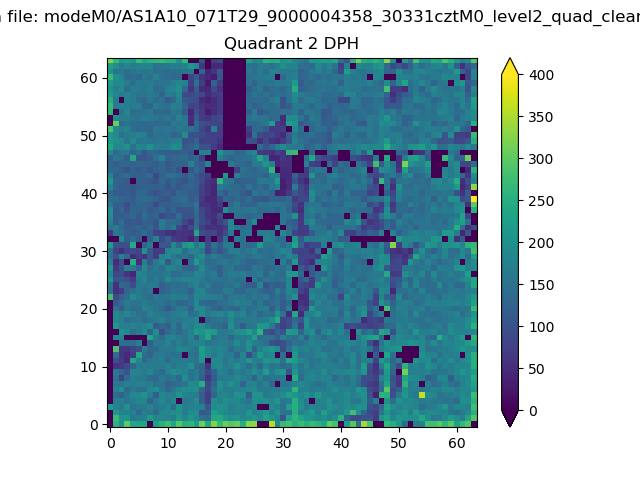
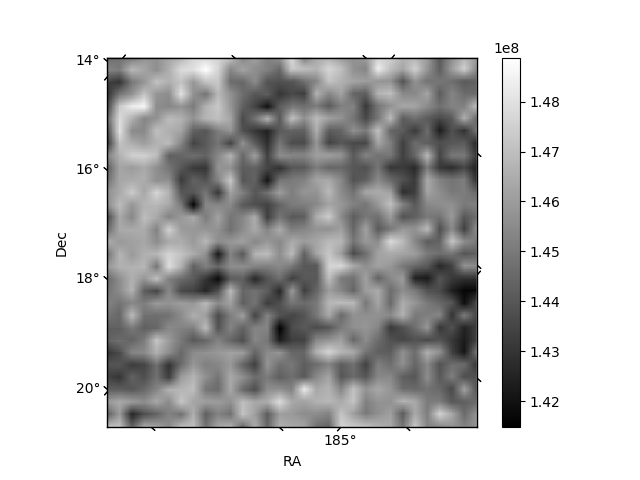
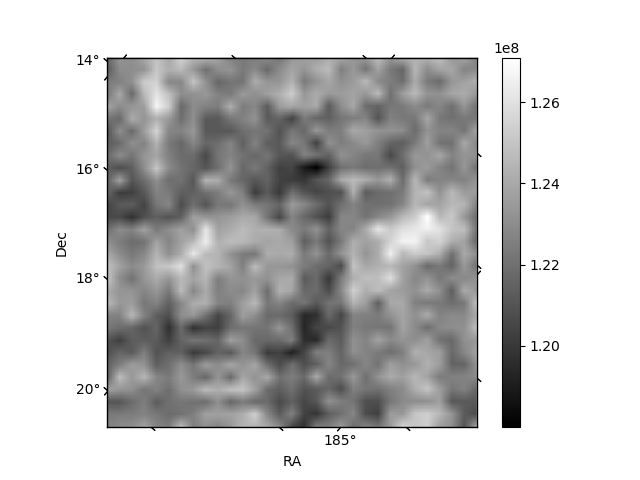
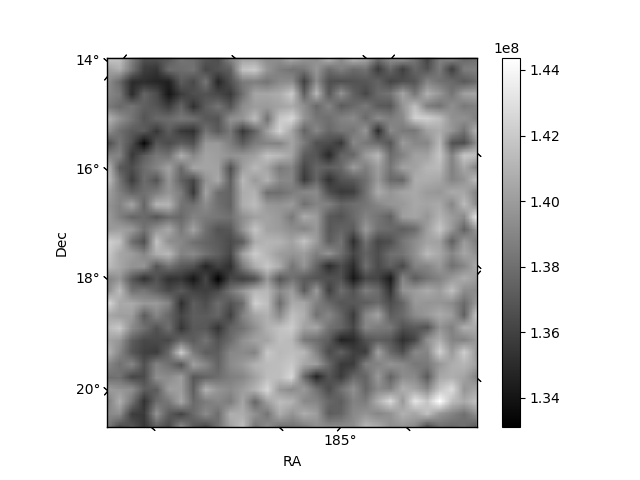
Histogram calculated using DETX and DETY for each event in the final _common_clean file
| Quadrant A |  |
 |
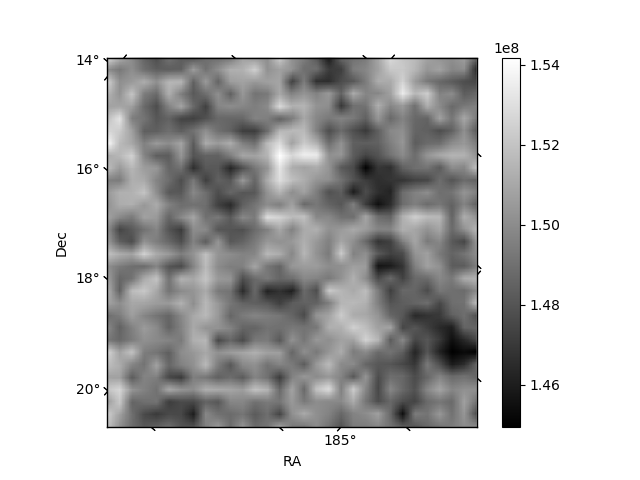
Quadrant B |
|---|---|---|---|
| Quadrant D |  |
 |
Quadrant C |
| Plot type | Count rate plots | Images |
|---|---|---|
| Comparison with Poisson distribution Blue bars denote a histogram of data divided into 1 sec bins. Red curve is a Poisson curve with rate = median count rate of data. |
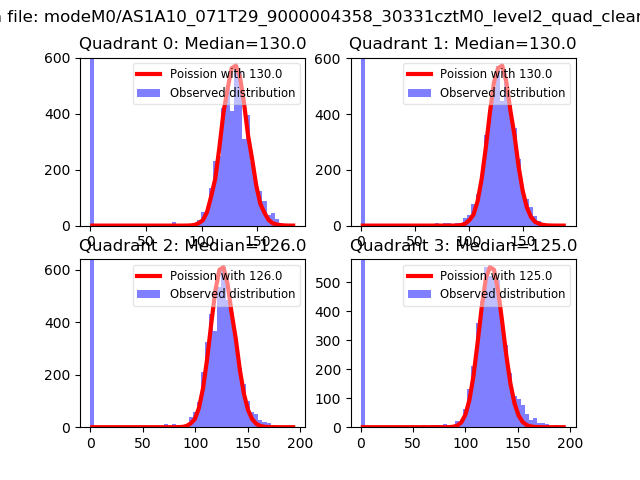 |
 |
| Quadrant-wise count rates Data is divided into 100 sec bins |
 |
|
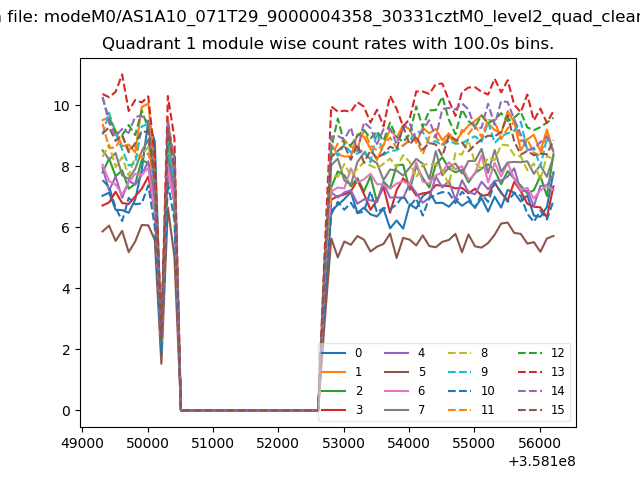
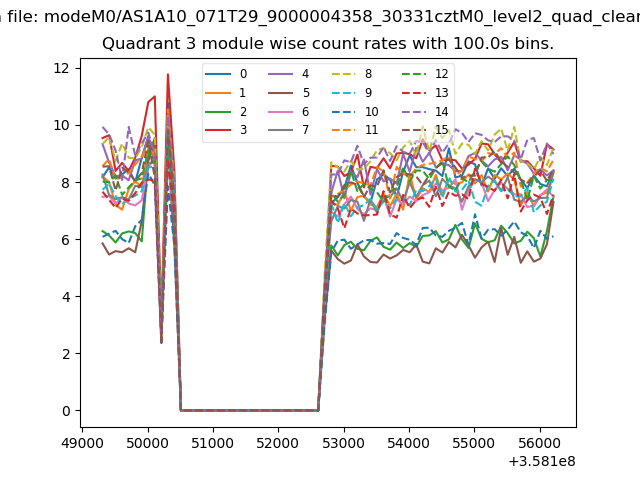
| Module-wise count rates for Quadrant A Data is divided into 100 sec bins |
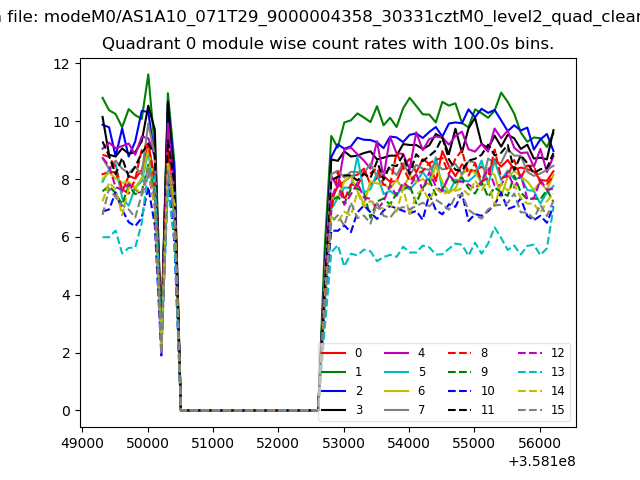 |
 |
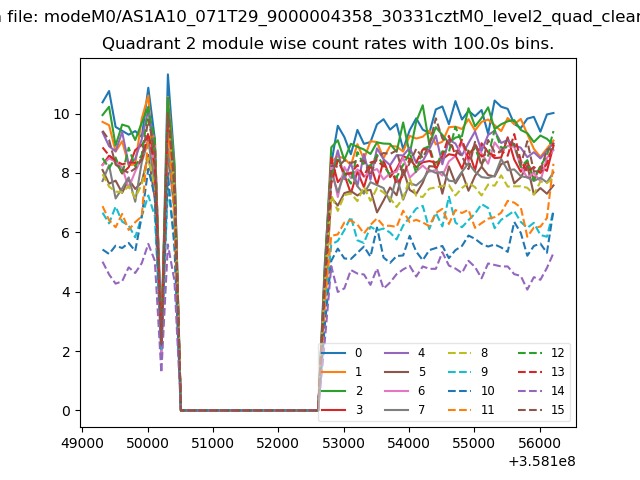
| Module-wise count rates for Quadrant B Data is divided into 100 sec bins |
 |
 |
| Module-wise count rates for Quadrant C Data is divided into 100 sec bins |
 |
 |
| Module-wise count rates for Quadrant D Data is divided into 100 sec bins |
 |
 |
| Parameter | Plot |
|---|---|
| CZT HV Monitor |  |
| D_VDD | 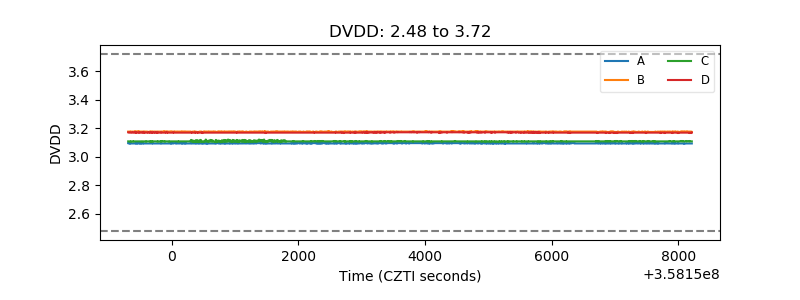 |
| Temperature 1 | 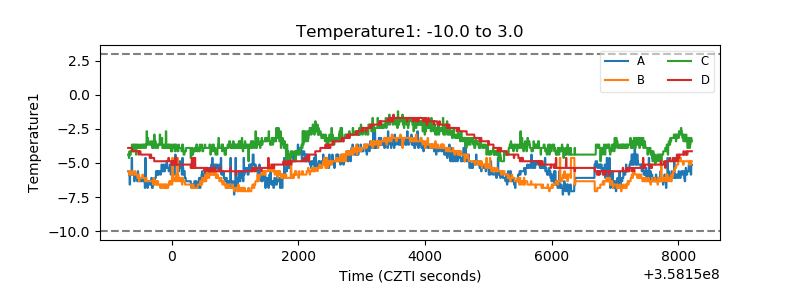 |
| Veto HV Monitor | 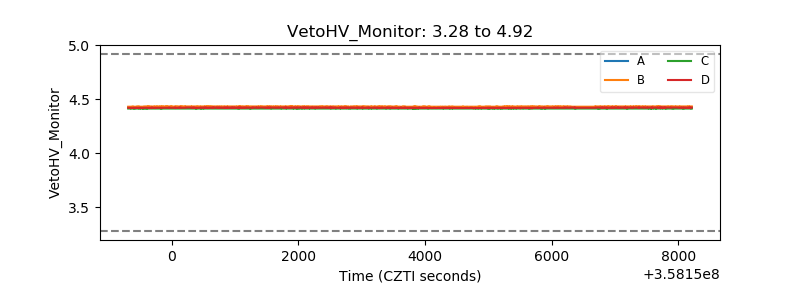 |
| Veto LLD | 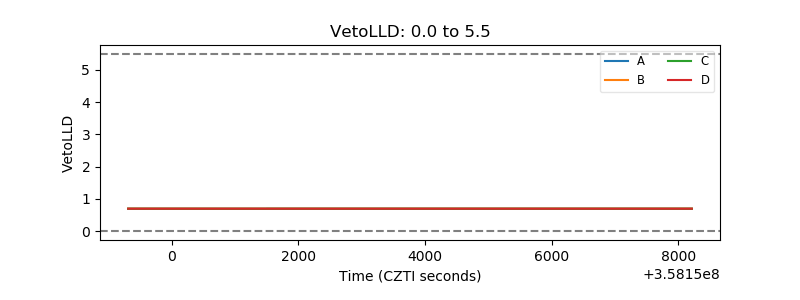 |
| Alpha Counter | 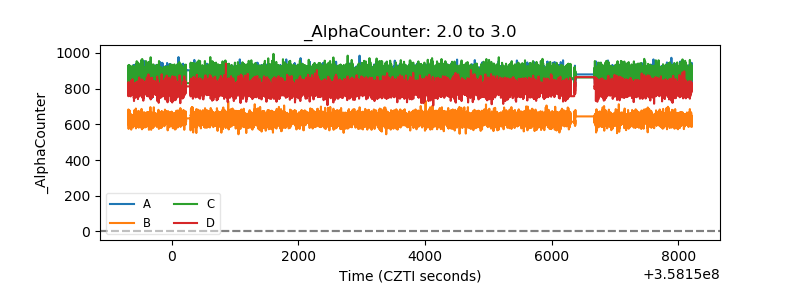 |
| _CPM_Rate | 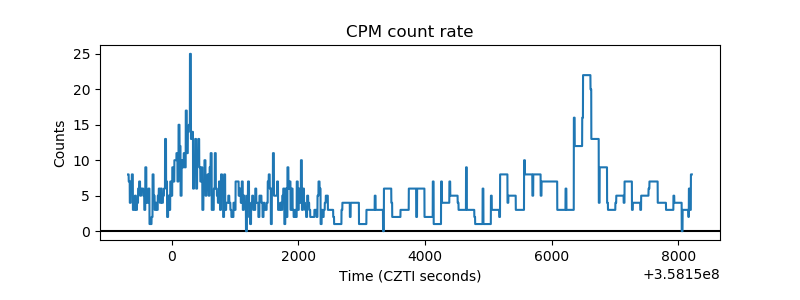 |
| CZT Counter | 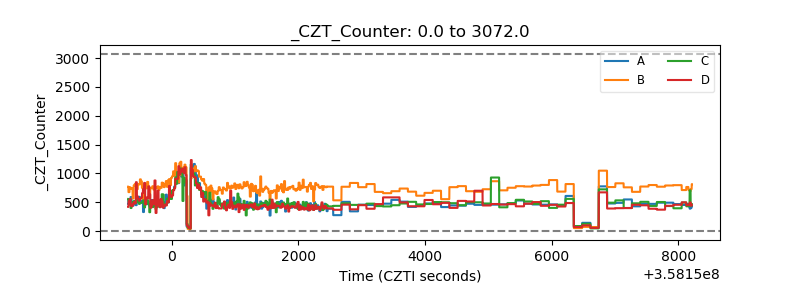 |
| +2.5 Volts monitor | 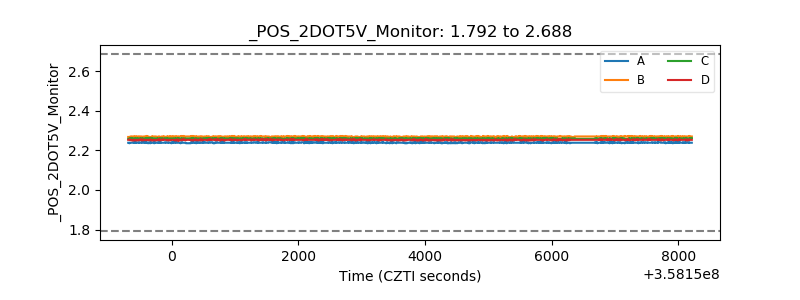 |
| +5 Volts monitor | 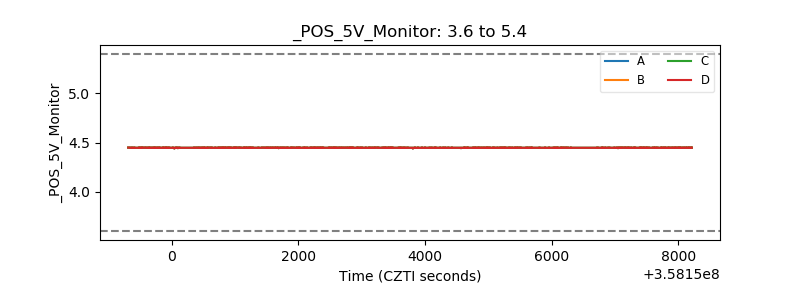 |
| _ROLL_ROT | 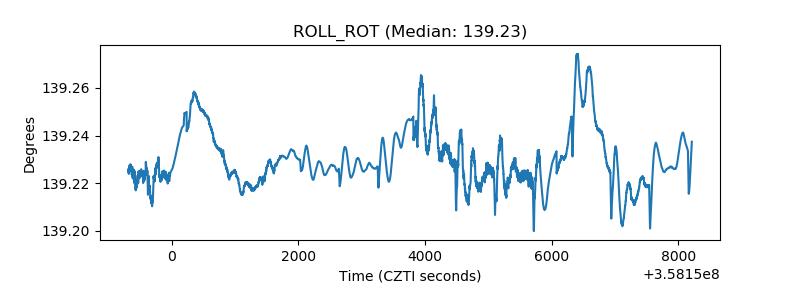 |
| _Roll_DEC | 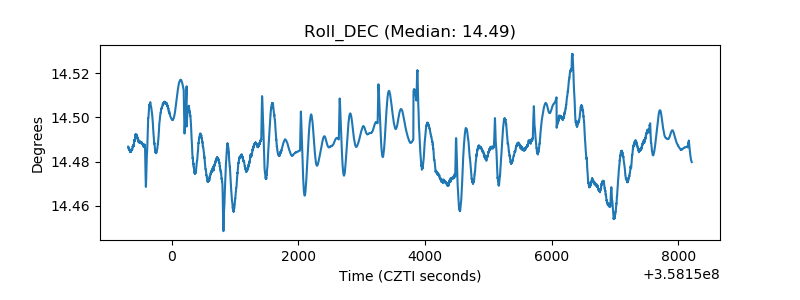 |
| _Roll_RA | 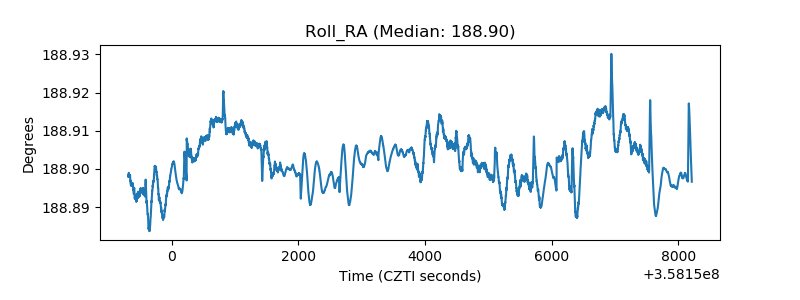 |
| Veto Counter | 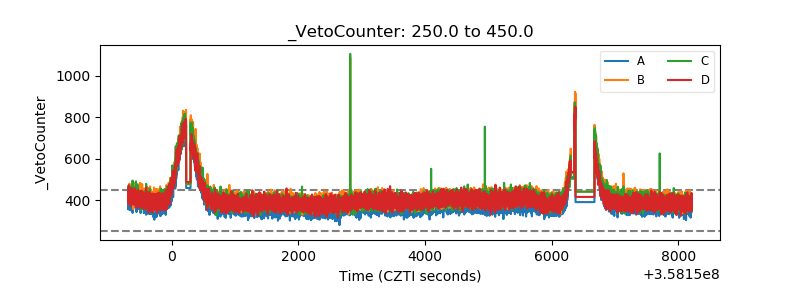 |