| Param | Original file | Final file |
|---|---|---|
| Filename | modeM0/AS1A10_071T29_9000004358_30333cztM0_level2.evt | modeM0/AS1A10_071T29_9000004358_30333cztM0_level2_quad_clean.evt |
| Size (bytes) | 711,408,960 | 114,888,960 |
| Size | 678.5 MB | 109.6 MB |
| Events in quadrant A | 4,553,656 | 720,658 |
| Events in quadrant B | 7,129,005 | 719,896 |
| Events in quadrant C | 4,533,453 | 696,755 |
| Events in quadrant D | 4,689,430 | 687,095 |
| Mode M9 | |||
|---|---|---|---|
| Quadrant | BADHDUFLAG | Total packets | Discarded packets |
| A | 0 | 9 | 0 |
| B | 0 | 9 | 0 |
| C | 0 | 9 | 0 |
| D | 0 | 9 | 0 |
| Mode SS | |||
|---|---|---|---|
| Quadrant | BADHDUFLAG | Total packets | Discarded packets |
| A | 0 | 192 | 0 |
| B | 0 | 192 | 0 |
| C | 0 | 192 | 0 |
| D | 0 | 192 | 0 |
| Mode M0 | |||
|---|---|---|---|
| Quadrant | BADHDUFLAG | Total packets | Discarded packets |
| A | 0 | 19547 | 2 |
| B | 0 | 28639 | 2 |
| C | 0 | 19383 | 2 |
| D | 0 | 20133 | 2 |
| Quadrant | Total seconds | Saturated seconds | Saturation percentage |
|---|---|---|---|
| A | 9455 | 163 | 1.723956% |
| B | 9456 | 263 | 2.781303% |
| C | 9456 | 194 | 2.051607% |
| D | 9456 | 132 | 1.395939% |
Noise dominated data is calculated using 1-second bins in cleaned event files. If a bin has >2000 counts, and if more than 50% of those come from <1% of pixels, then it is considered to be noise-dominated and hence unusable.
| Quadrant | # 1 sec bins | Bins with >0 counts | Bins with >2000 counts | High rate bins dominated by noise | Noise dominated (total time) | Noise dominated (detector-on time) | Marked lightcurve |
|---|---|---|---|---|---|---|---|
| A | 10285 | 9456 | 3 | 3 | 0.03% | 0.03% | 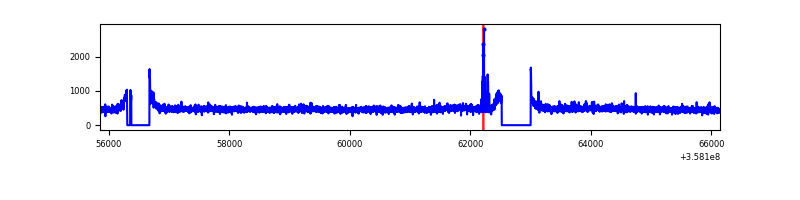 |
| B | 10286 | 9457 | 8 | 8 | 0.08% | 0.08% | 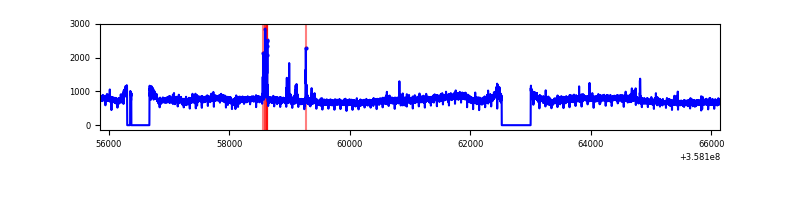 |
| C | 10286 | 9457 | 0 | 0 | 0.00% | 0.00% | 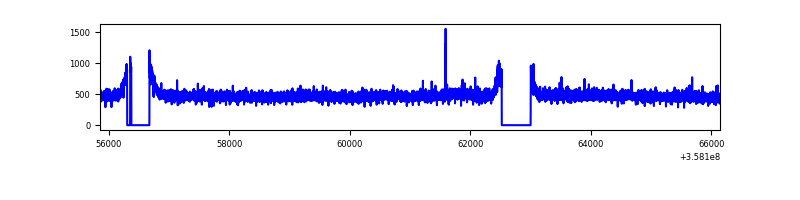 |
| D | 10286 | 9457 | 23 | 23 | 0.22% | 0.24% | 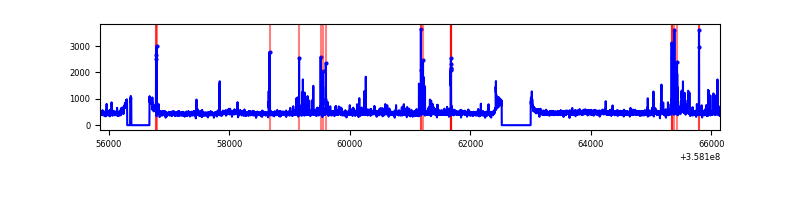 |
Top three noisy pixels from each quadrant. If the there are fewer than three noisy pixels in the level2.evt file, extra rows are filled as -1
| Pixel properties | Quadrant properties | ||||||
|---|---|---|---|---|---|---|---|
| Quadrant | DetID | PixID | Counts | Sigma | Mean | Median | Sigma |
| A | 12 | 96 | 39275 | 164.33 | 1154 | 1126 | 232.1 |
| A | 5 | 203 | 27793 | 114.87 | 1154 | 1126 | 232.1 |
| A | 8 | 192 | 20412 | 83.08 | 1154 | 1126 | 232.1 |
| B | 6 | 159 | 2558750 | 11452.51 | 1135 | 1104 | 223.3 |
| B | 6 | 36 | 74598 | 329.09 | 1135 | 1104 | 223.3 |
| B | 12 | 111 | 28589 | 123.07 | 1135 | 1104 | 223.3 |
| C | 14 | 238 | 174663 | 662.18 | 1106 | 1111 | 262.1 |
| C | 3 | 233 | 30106 | 110.63 | 1106 | 1111 | 262.1 |
| C | 2 | 114 | 21919 | 79.39 | 1106 | 1111 | 262.1 |
| D | 2 | 250 | 168351 | 570.91 | 1111 | 1090 | 293.0 |
| D | 8 | 195 | 139705 | 473.13 | 1111 | 1090 | 293.0 |
| D | 13 | 104 | 72309 | 243.09 | 1111 | 1090 | 293.0 |
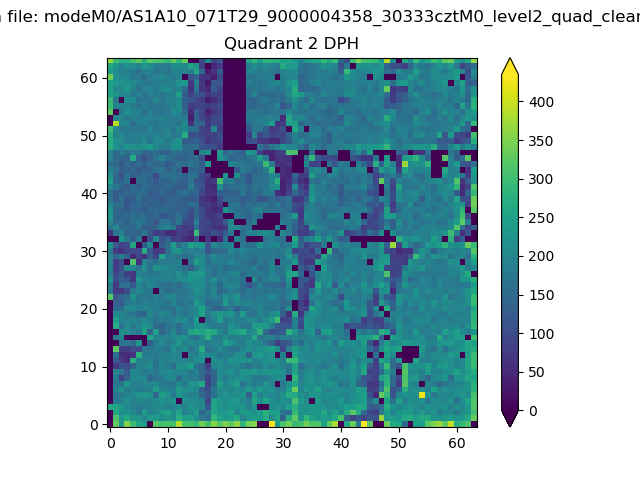
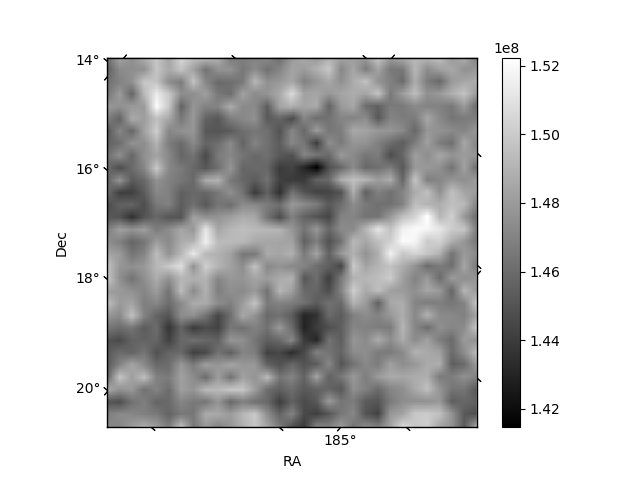
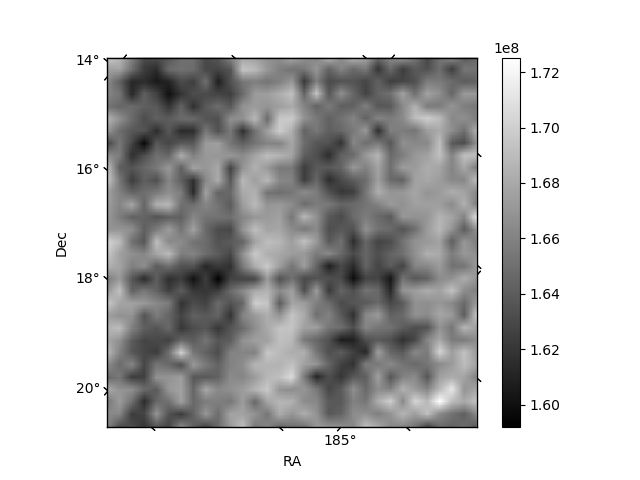
Histogram calculated using DETX and DETY for each event in the final _common_clean file
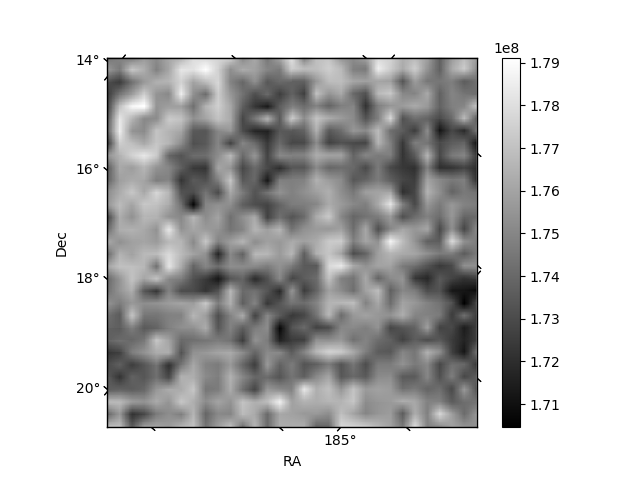
| Quadrant A |  |
 |
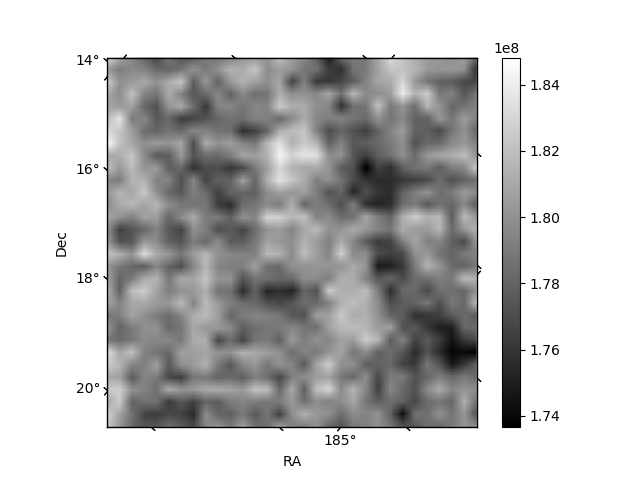
Quadrant B |
|---|---|---|---|
| Quadrant D | 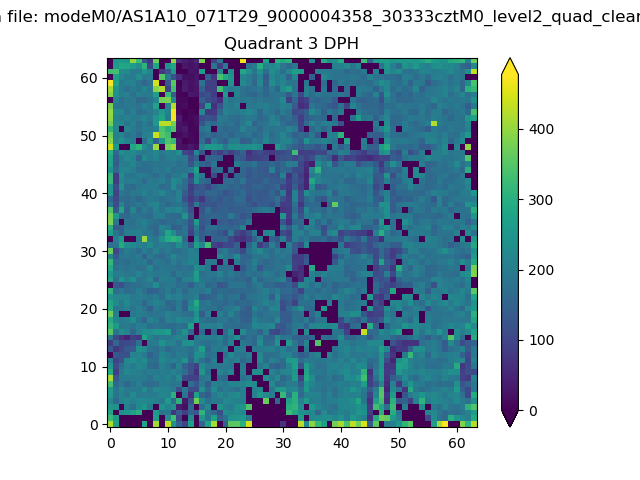 |
 |
Quadrant C |
| Plot type | Count rate plots | Images |
|---|---|---|
| Comparison with Poisson distribution Blue bars denote a histogram of data divided into 1 sec bins. Red curve is a Poisson curve with rate = median count rate of data. |
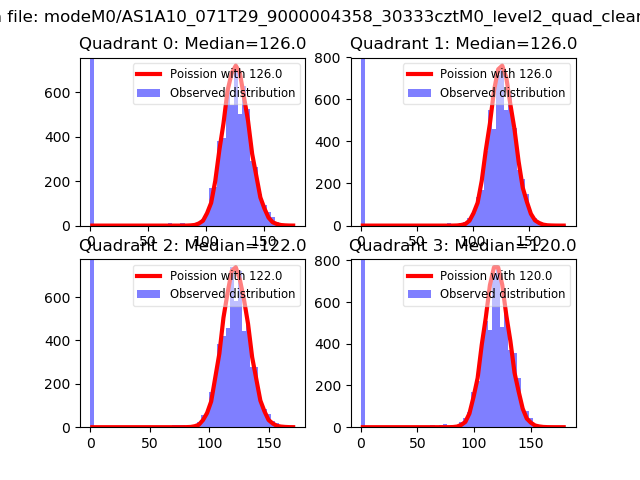 |
 |
| Quadrant-wise count rates Data is divided into 100 sec bins |
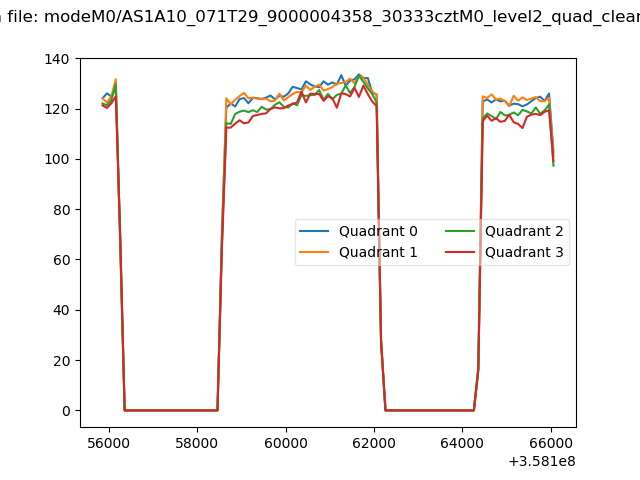 |
|
| Module-wise count rates for Quadrant A Data is divided into 100 sec bins |
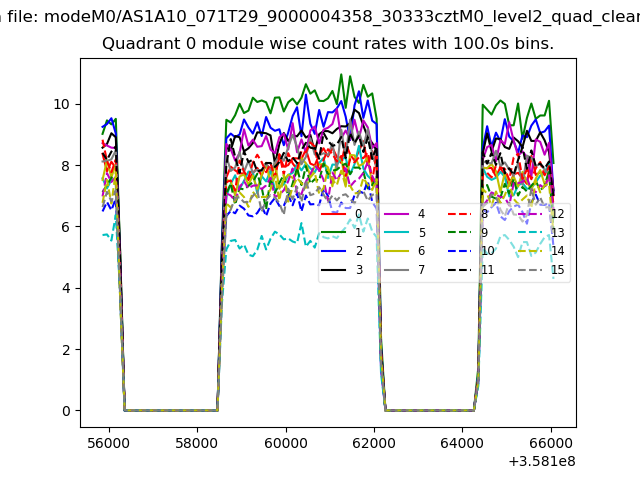 |
 |
| Module-wise count rates for Quadrant B Data is divided into 100 sec bins |
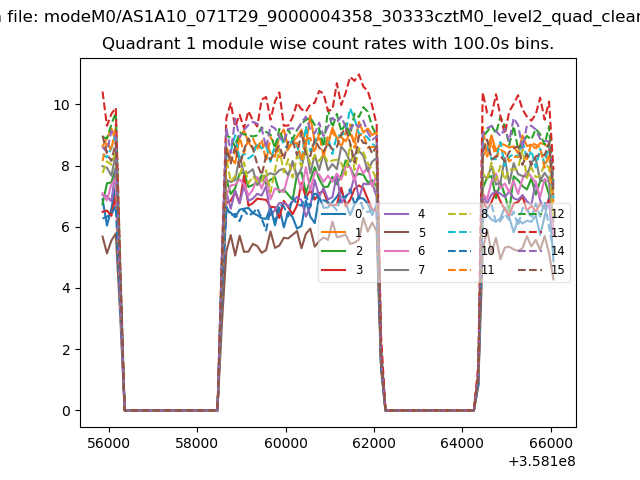 |
 |
| Module-wise count rates for Quadrant C Data is divided into 100 sec bins |
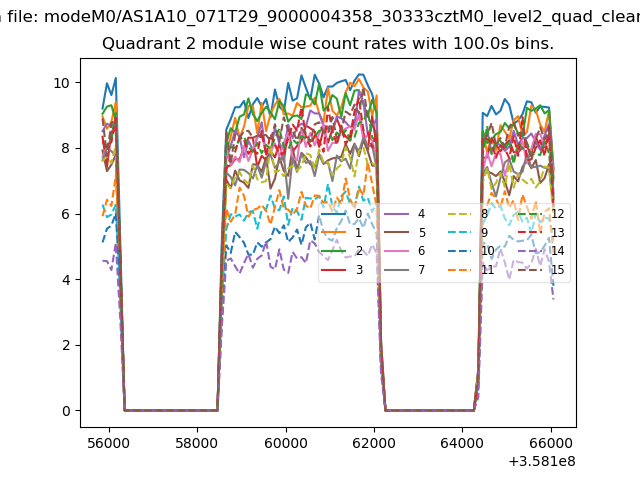 |
 |
| Module-wise count rates for Quadrant D Data is divided into 100 sec bins |
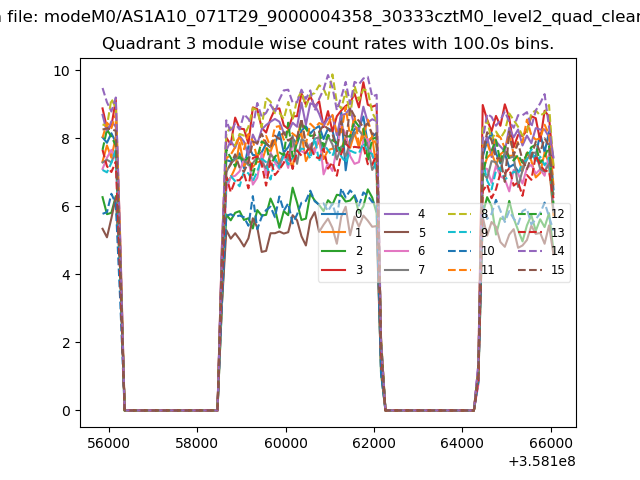 |
 |
| Parameter | Plot |
|---|---|
| CZT HV Monitor | 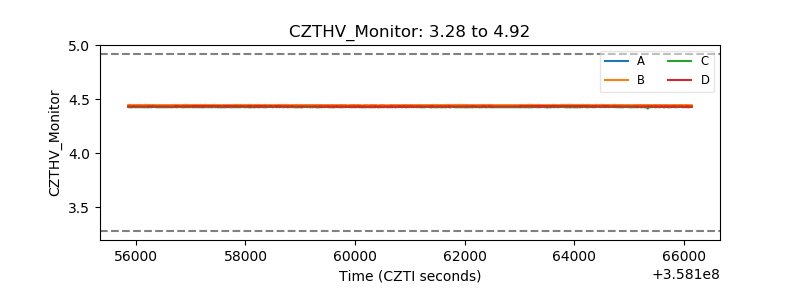 |
| D_VDD | 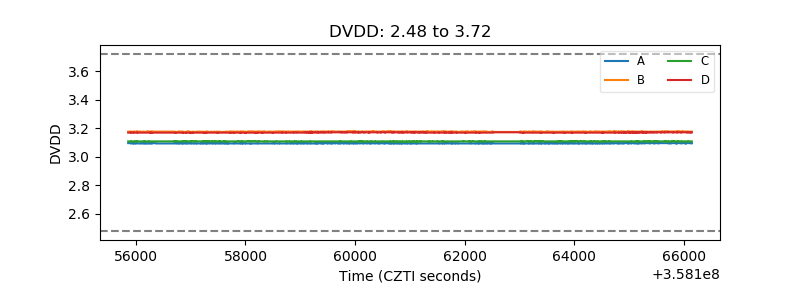 |
| Temperature 1 | 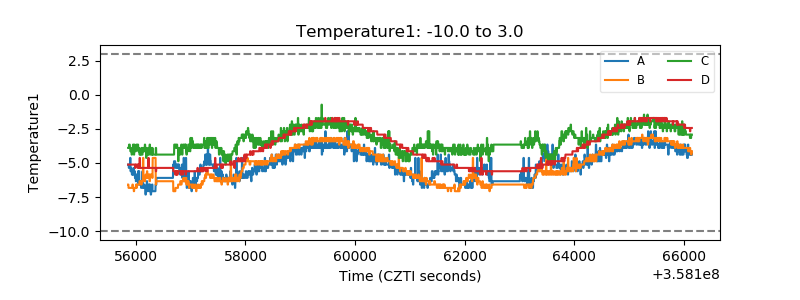 |
| Veto HV Monitor |  |
| Veto LLD |  |
| Alpha Counter |  |
| _CPM_Rate | 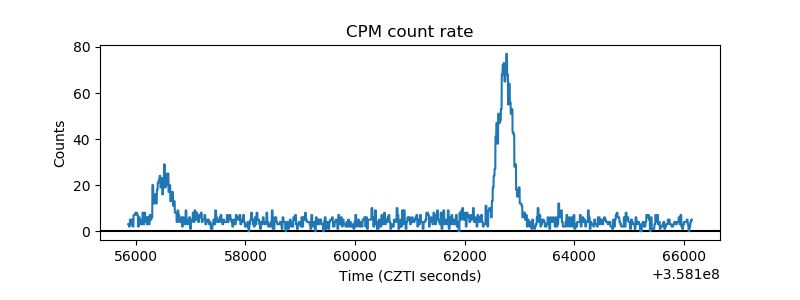 |
| CZT Counter | 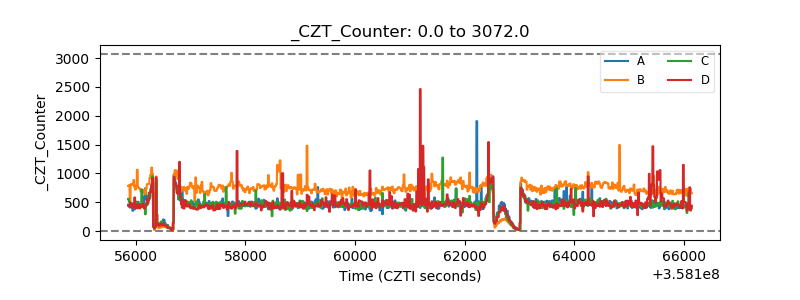 |
| +2.5 Volts monitor |  |
| +5 Volts monitor |  |
| _ROLL_ROT | 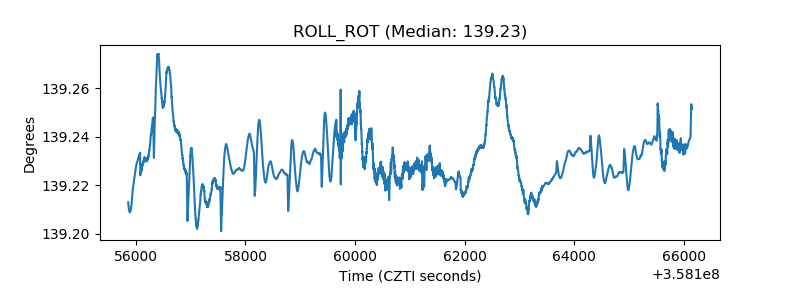 |
| _Roll_DEC | 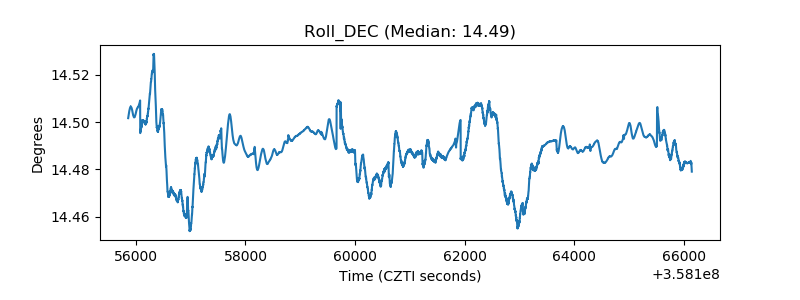 |
| _Roll_RA | 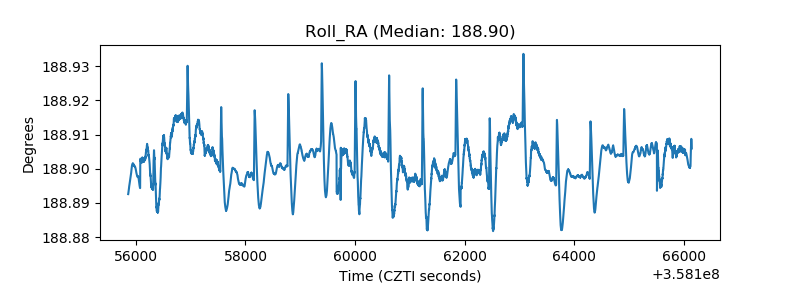 |
| Veto Counter | 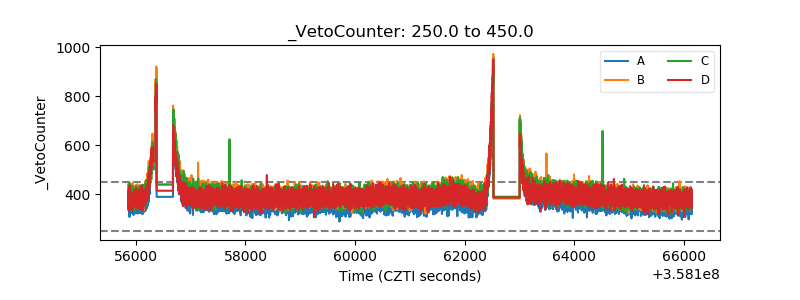 |