| Param | Original file | Final file |
|---|---|---|
| Filename | modeM0/AS1A10_053T13_9000004360cztM0_level2.fits | modeM0/AS1A10_053T13_9000004360cztM0_level2_quad_clean.evt |
| Size (bytes) | 249,710,400 | 192,265,920 |
| Size | 238.1 MB | 183.4 MB |
| Events in quadrant A | 1,572,952 | 1,096,314 |
| Events in quadrant B | 1,484,014 | 1,080,754 |
| Events in quadrant C | 1,506,376 | 1,024,127 |
| Events in quadrant D | 1,337,142 | 958,288 |
| Mode SS | |||
|---|---|---|---|
| Quadrant | BADHDUFLAG | Total packets | Discarded packets |
| A | 0 | 494 | 0 |
| B | 0 | 494 | 0 |
| C | 0 | 494 | 0 |
| D | 0 | 494 | 0 |
| Mode M9 | |||
|---|---|---|---|
| Quadrant | BADHDUFLAG | Total packets | Discarded packets |
| A | 0 | 49 | 0 |
| B | 0 | 49 | 0 |
| C | 0 | 49 | 0 |
| D | 0 | 49 | 0 |
| Mode M0 | |||
|---|---|---|---|
| Quadrant | BADHDUFLAG | Total packets | Discarded packets |
| A | 0 | 52373 | 0 |
| B | 0 | 74135 | 0 |
| C | 0 | 52344 | 0 |
| D | 0 | 55405 | 0 |
| Quadrant | Total seconds | Saturated seconds | Saturation percentage |
|---|---|---|---|
| A | 24156 | 304 | 1.258487% |
| B | 24156 | 541 | 2.239609% |
| C | 24156 | 466 | 1.929127% |
| D | 24156 | 534 | 2.210631% |
Noise dominated data is calculated using 1-second bins in cleaned event files. If a bin has >2000 counts, and if more than 50% of those come from <1% of pixels, then it is considered to be noise-dominated and hence unusable.
| Quadrant | # 1 sec bins | Bins with >0 counts | Bins with >2000 counts | High rate bins dominated by noise | Noise dominated (total time) | Noise dominated (detector-on time) | Marked lightcurve |
|---|---|---|---|---|---|---|---|
| A | 29106 | 24151 | 0 | 0 | 0.00% | 0.00% |  |
| B | 29106 | 24150 | 0 | 0 | 0.00% | 0.00% |  |
| C | 29106 | 24151 | 0 | 0 | 0.00% | 0.00% |  |
| D | 29106 | 24144 | 0 | 0 | 0.00% | 0.00% |  |
Top three noisy pixels from each quadrant. If the there are fewer than three noisy pixels in the level2.evt file, extra rows are filled as -1
| Pixel properties | Quadrant properties | ||||||
|---|---|---|---|---|---|---|---|
| Quadrant | DetID | PixID | Counts | Sigma | Mean | Median | Sigma |
| A | 0 | 29 | 1464 | 10.62 | 410 | 388 | 101.4 |
| A | 7 | 110 | 1183 | 7.84 | 410 | 388 | 101.4 |
| A | 9 | 19 | 1163 | 7.65 | 410 | 388 | 101.4 |
| B | 2 | 9 | 1261 | 11.16 | 392 | 376 | 79.3 |
| B | 2 | 8 | 1028 | 8.22 | 392 | 376 | 79.3 |
| B | 14 | 254 | 988 | 7.71 | 392 | 376 | 79.3 |
| C | 1 | 80 | 1152 | 7.62 | 398 | 374 | 102.0 |
| C | 1 | 81 | 1138 | 7.49 | 398 | 374 | 102.0 |
| C | 3 | 203 | 1079 | 6.91 | 398 | 374 | 102.0 |
| D | 15 | 46 | 995 | 6.34 | 381 | 349 | 101.9 |
| D | 3 | 14 | 982 | 6.21 | 381 | 349 | 101.9 |
| D | 10 | 189 | 956 | 5.96 | 381 | 349 | 101.9 |
Histogram calculated using DETX and DETY for each event in the final _common_clean file
| Quadrant A |  |
 |
Quadrant B |
|---|---|---|---|
| Quadrant D |  |
 |
Quadrant C |
| Plot type | Count rate plots | Images |
|---|---|---|
| Comparison with Poisson distribution Blue bars denote a histogram of data divided into 1 sec bins. Red curve is a Poisson curve with rate = median count rate of data. |
 |
 |
| Quadrant-wise count rates Data is divided into 100 sec bins |
 |
|
| Module-wise count rates for Quadrant A Data is divided into 100 sec bins |
 |
 |
| Module-wise count rates for Quadrant B Data is divided into 100 sec bins |
 |
 |
| Module-wise count rates for Quadrant C Data is divided into 100 sec bins |
 |
 |
| Module-wise count rates for Quadrant D Data is divided into 100 sec bins |
 |
 |
| Parameter | Plot |
|---|---|
| CZT HV Monitor |  |
| D_VDD | 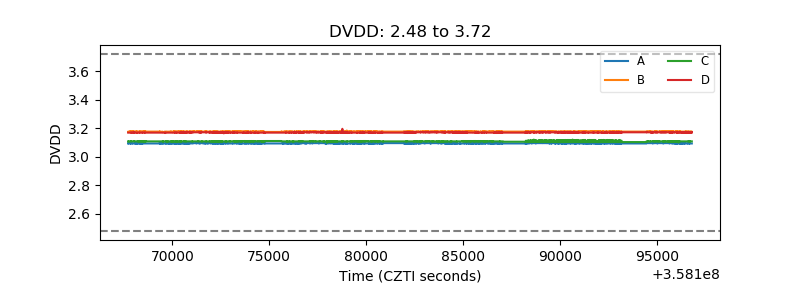 |
| Temperature 1 |  |
| Veto HV Monitor |  |
| Veto LLD |  |
| Alpha Counter |  |
| _CPM_Rate |  |
| CZT Counter |  |
| +2.5 Volts monitor |  |
| +5 Volts monitor |  |
| _ROLL_ROT |  |
| _Roll_DEC |  |
| _Roll_RA |  |
| Veto Counter |  |