| Param | Original file | Final file |
|---|---|---|
| Filename | modeM0/AS1A10_053T13_9000004360_30333cztM0_level2.evt | modeM0/AS1A10_053T13_9000004360_30333cztM0_level2_quad_clean.evt |
| Size (bytes) | 195,698,880 | 47,419,200 |
| Size | 186.6 MB | 45.2 MB |
| Events in quadrant A | 1,250,421 | 317,900 |
| Events in quadrant B | 1,935,800 | 317,509 |
| Events in quadrant C | 1,253,369 | 312,540 |
| Events in quadrant D | 1,315,901 | 308,791 |
| Mode SS | |||
|---|---|---|---|
| Quadrant | BADHDUFLAG | Total packets | Discarded packets |
| A | 0 | 52 | 0 |
| B | 0 | 52 | 0 |
| C | 0 | 52 | 0 |
| D | 0 | 52 | 0 |
| Mode M9 | |||
|---|---|---|---|
| Quadrant | BADHDUFLAG | Total packets | Discarded packets |
| A | 0 | 7 | 0 |
| B | 0 | 7 | 0 |
| C | 0 | 7 | 0 |
| D | 0 | 7 | 0 |
| Mode M0 | |||
|---|---|---|---|
| Quadrant | BADHDUFLAG | Total packets | Discarded packets |
| A | 0 | 5233 | 1 |
| B | 0 | 7506 | 1 |
| C | 0 | 5157 | 1 |
| D | 0 | 5429 | 1 |
| Quadrant | Total seconds | Saturated seconds | Saturation percentage |
|---|---|---|---|
| A | 2490 | 57 | 2.289157% |
| B | 2490 | 79 | 3.172691% |
| C | 2490 | 72 | 2.891566% |
| D | 2490 | 44 | 1.767068% |
Noise dominated data is calculated using 1-second bins in cleaned event files. If a bin has >2000 counts, and if more than 50% of those come from <1% of pixels, then it is considered to be noise-dominated and hence unusable.
| Quadrant | # 1 sec bins | Bins with >0 counts | Bins with >2000 counts | High rate bins dominated by noise | Noise dominated (total time) | Noise dominated (detector-on time) | Marked lightcurve |
|---|---|---|---|---|---|---|---|
| A | 3160 | 2490 | 0 | 0 | 0.00% | 0.00% | 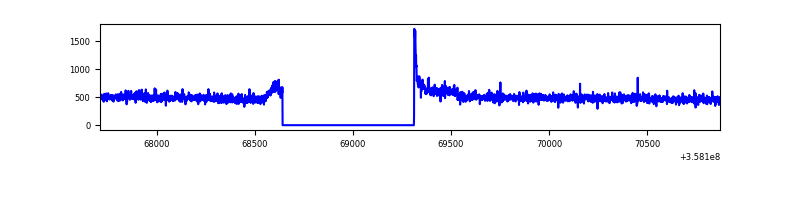 |
| B | 3160 | 2490 | 0 | 0 | 0.00% | 0.00% | 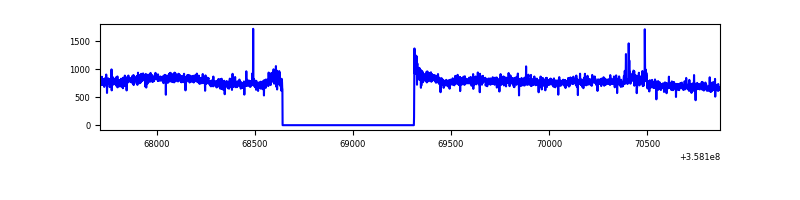 |
| C | 3160 | 2491 | 0 | 0 | 0.00% | 0.00% | 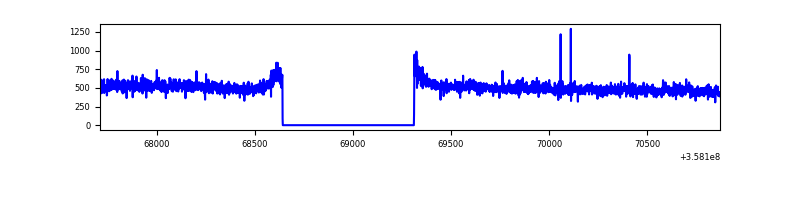 |
| D | 3160 | 2490 | 4 | 4 | 0.13% | 0.16% | 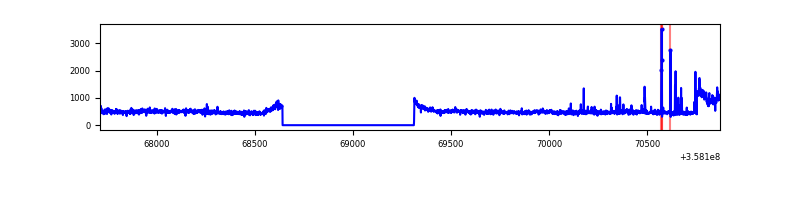 |
Top three noisy pixels from each quadrant. If the there are fewer than three noisy pixels in the level2.evt file, extra rows are filled as -1
| Pixel properties | Quadrant properties | ||||||
|---|---|---|---|---|---|---|---|
| Quadrant | DetID | PixID | Counts | Sigma | Mean | Median | Sigma |
| A | 5 | 203 | 23153 | 353.14 | 314 | 306 | 64.7 |
| A | 8 | 192 | 9718 | 145.48 | 314 | 306 | 64.7 |
| A | 13 | 254 | 4370 | 62.82 | 314 | 306 | 64.7 |
| B | 6 | 159 | 696316 | 11076.2 | 309 | 300 | 62.8 |
| B | 0 | 190 | 8815 | 135.5 | 309 | 300 | 62.8 |
| B | 12 | 111 | 7875 | 120.54 | 309 | 300 | 62.8 |
| C | 14 | 238 | 48268 | 651.18 | 306 | 307 | 73.7 |
| C | 3 | 233 | 6263 | 80.87 | 306 | 307 | 73.7 |
| C | 2 | 114 | 5844 | 75.18 | 306 | 307 | 73.7 |
| D | 13 | 168 | 83294 | 1046.4 | 308 | 301 | 79.3 |
| D | 8 | 195 | 34704 | 433.76 | 308 | 301 | 79.3 |
| D | 2 | 250 | 18206 | 225.75 | 308 | 301 | 79.3 |
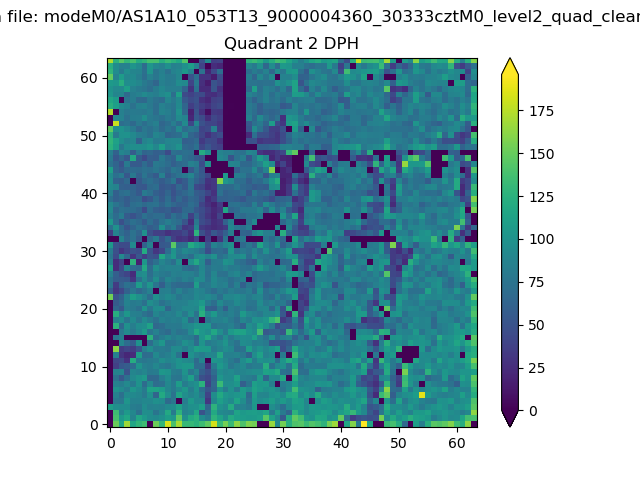
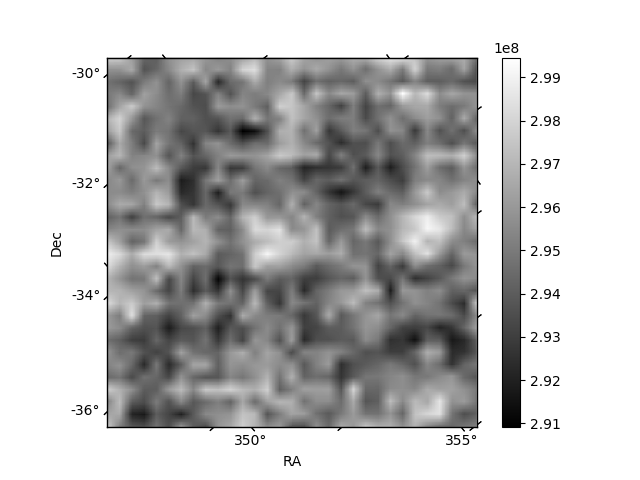
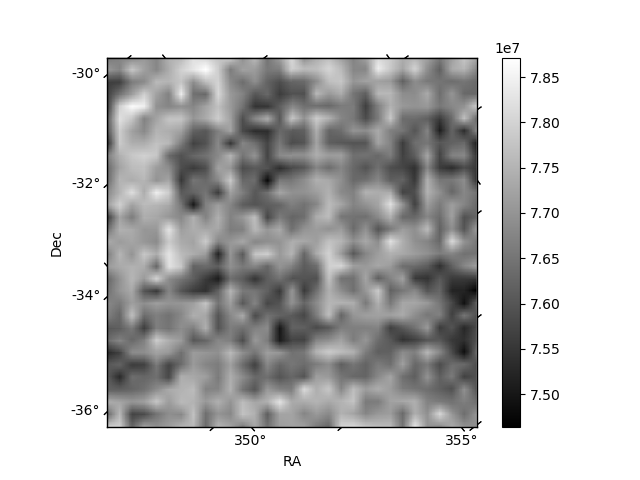
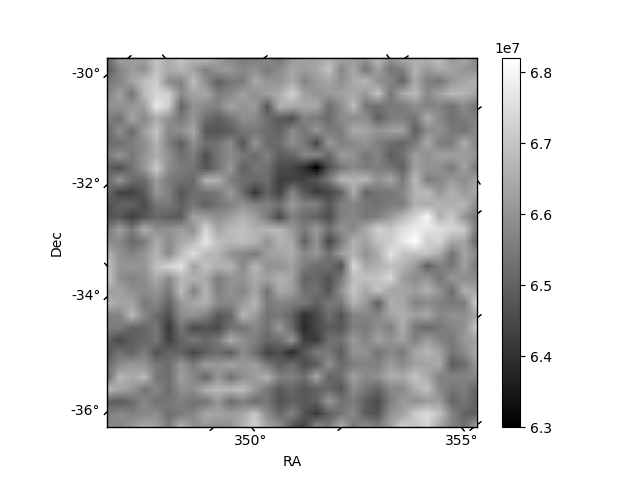
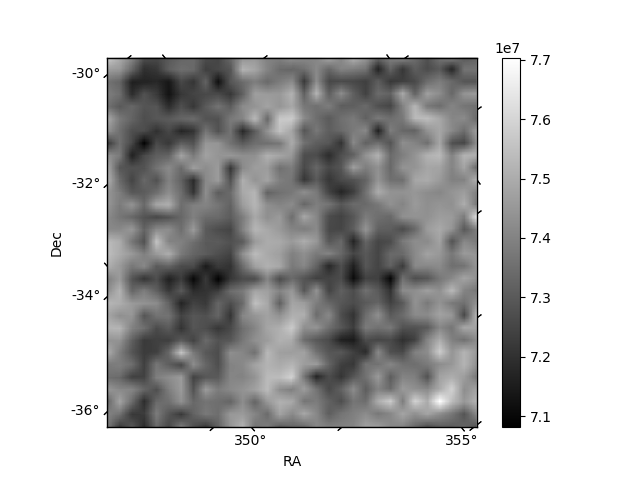
Histogram calculated using DETX and DETY for each event in the final _common_clean file
| Quadrant A | 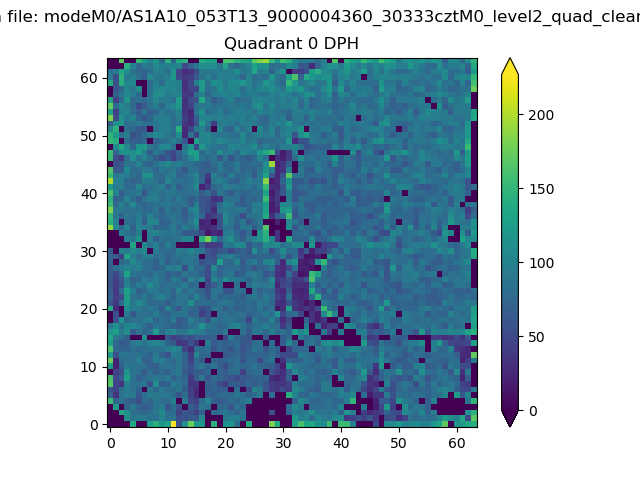 |
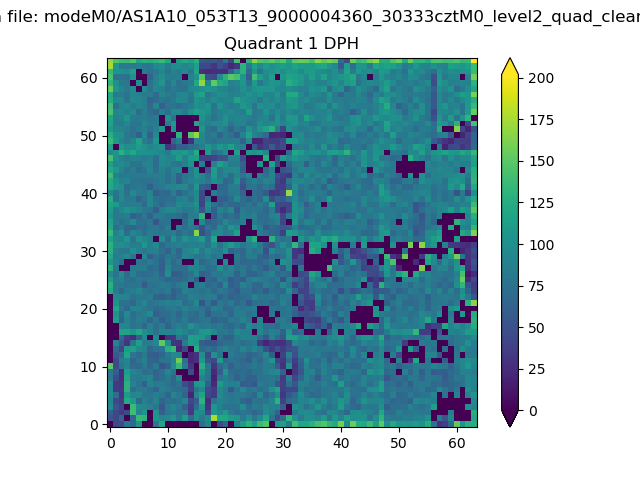 |
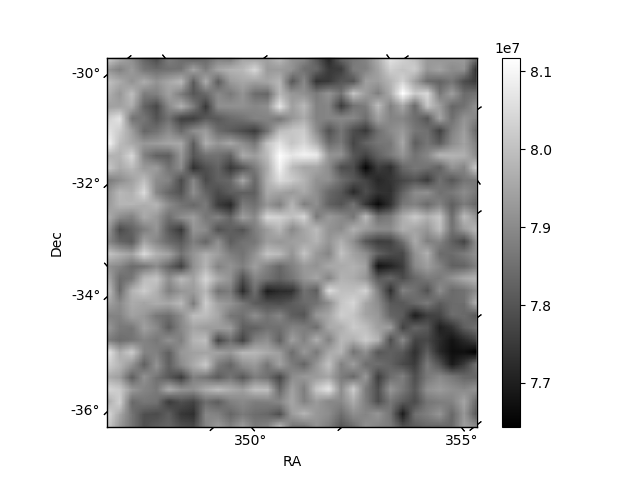
Quadrant B |
|---|---|---|---|
| Quadrant D | 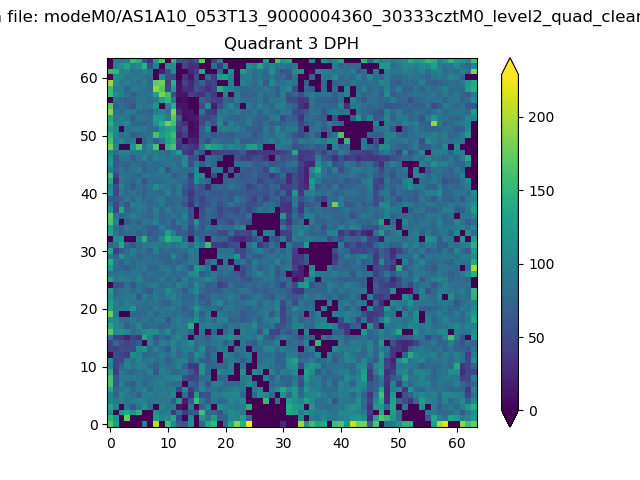 |
 |
Quadrant C |
| Plot type | Count rate plots | Images |
|---|---|---|
| Comparison with Poisson distribution Blue bars denote a histogram of data divided into 1 sec bins. Red curve is a Poisson curve with rate = median count rate of data. |
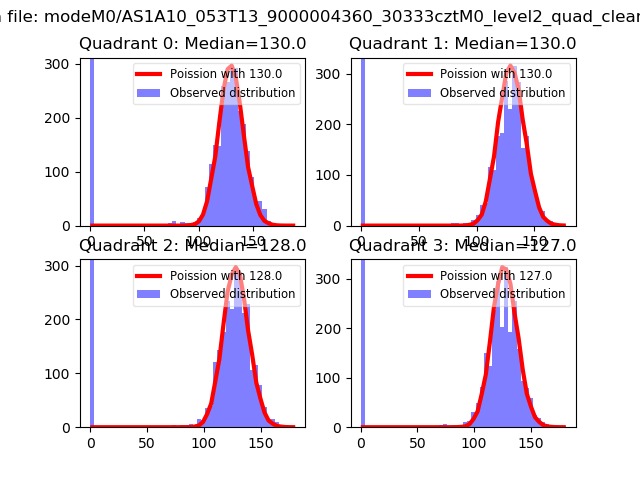 |
 |
| Quadrant-wise count rates Data is divided into 100 sec bins |
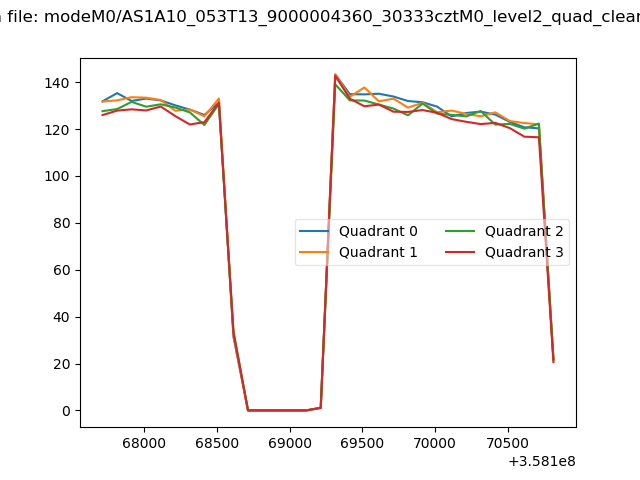 |
|
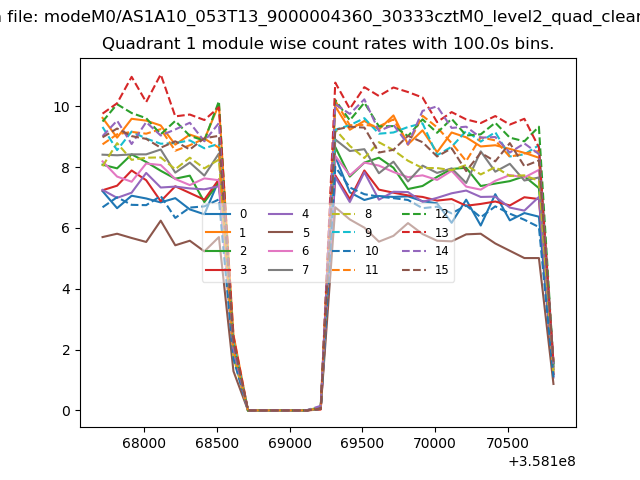
| Module-wise count rates for Quadrant A Data is divided into 100 sec bins |
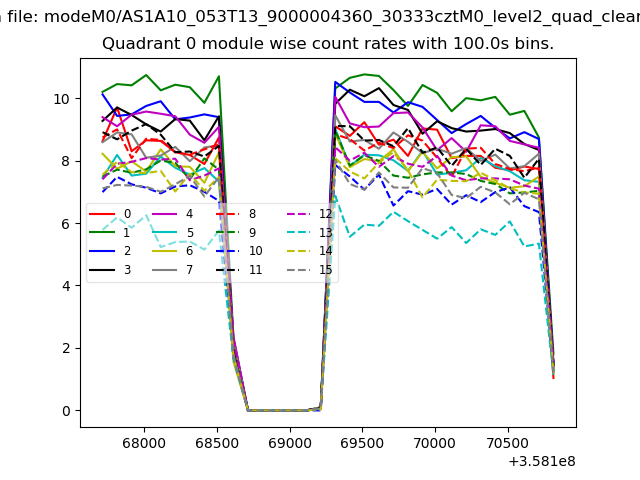 |
 |
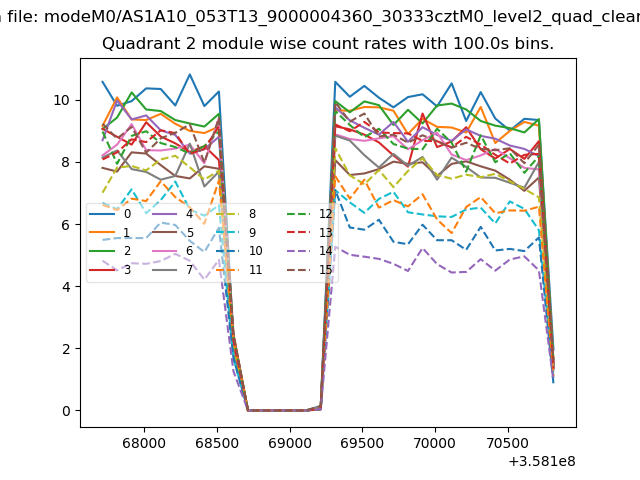
| Module-wise count rates for Quadrant B Data is divided into 100 sec bins |
 |
 |
| Module-wise count rates for Quadrant C Data is divided into 100 sec bins |
 |
 |
| Module-wise count rates for Quadrant D Data is divided into 100 sec bins |
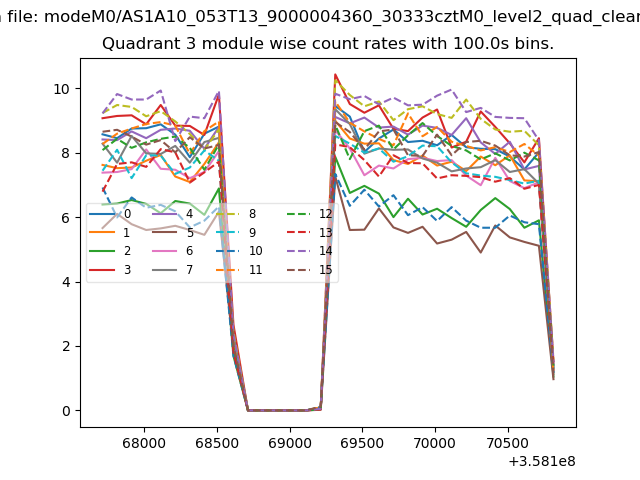 |
 |
| Parameter | Plot |
|---|---|
| CZT HV Monitor | 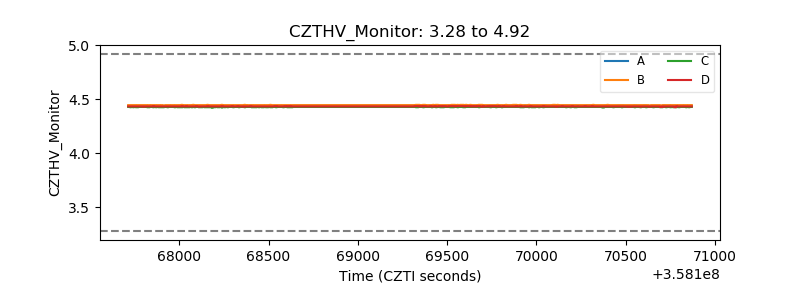 |
| D_VDD | 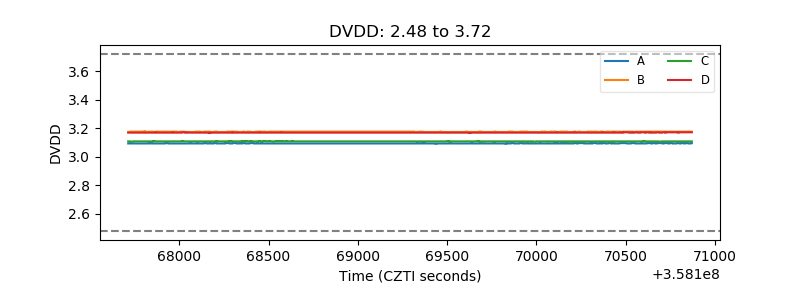 |
| Temperature 1 | 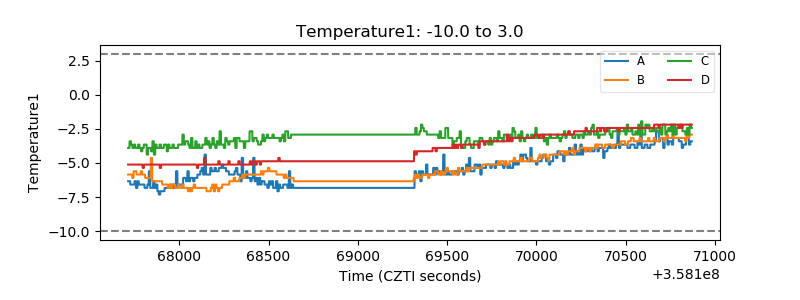 |
| Veto HV Monitor | 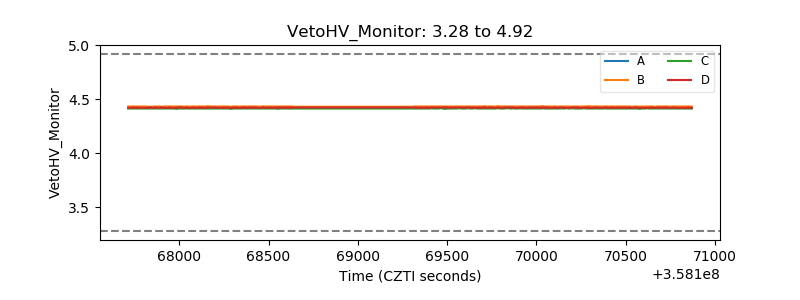 |
| Veto LLD | 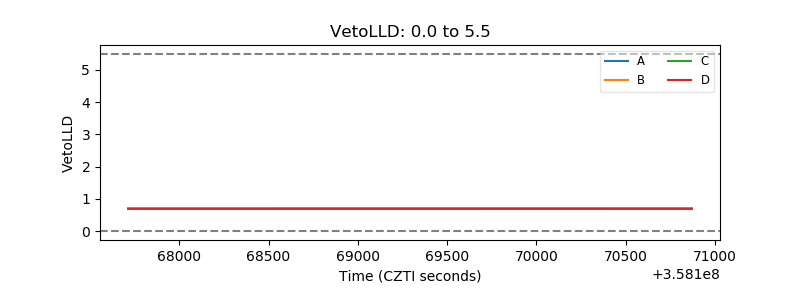 |
| Alpha Counter | 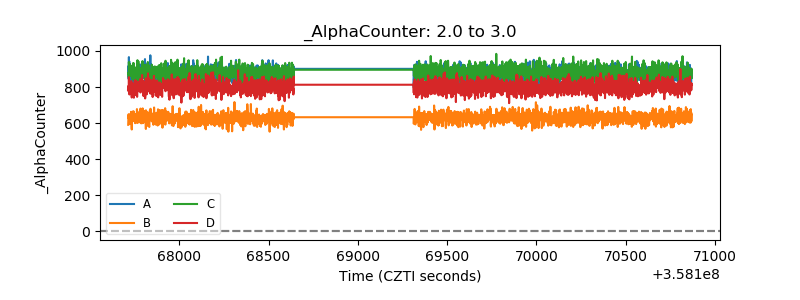 |
| _CPM_Rate | 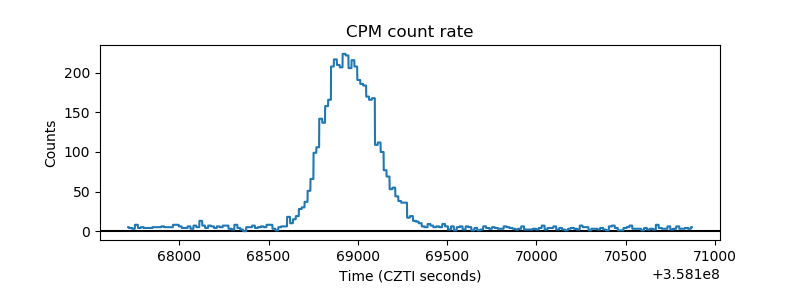 |
| CZT Counter | 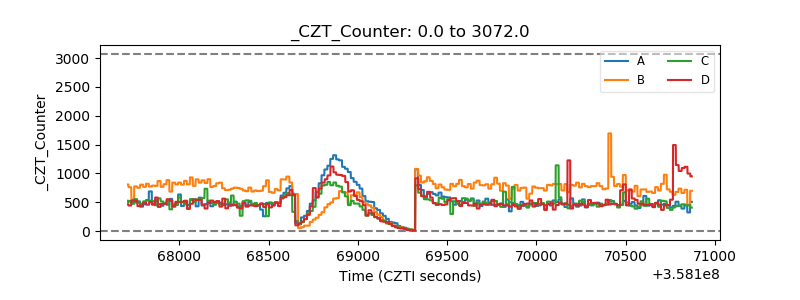 |
| +2.5 Volts monitor |  |
| +5 Volts monitor |  |
| _ROLL_ROT |  |
| _Roll_DEC | 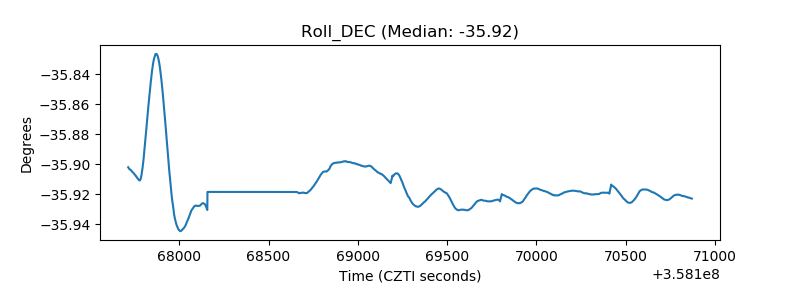 |
| _Roll_RA | 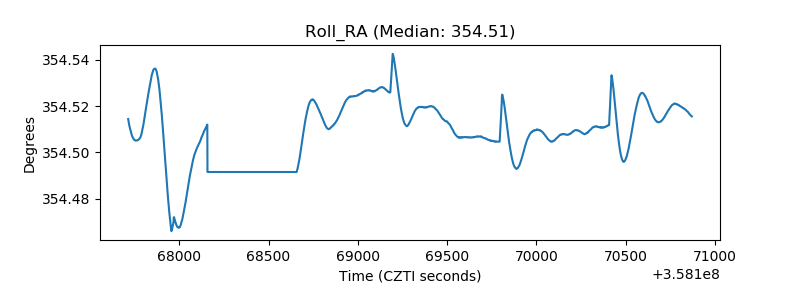 |
| Veto Counter | 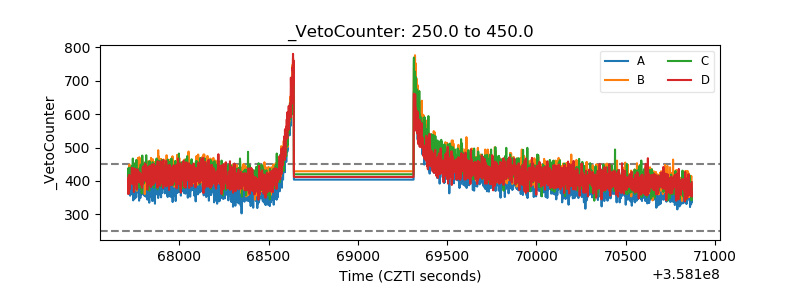 |