| Param | Original file | Final file |
|---|---|---|
| Filename | modeM0/AS1A10_053T13_9000004360_30334cztM0_level2.evt | modeM0/AS1A10_053T13_9000004360_30334cztM0_level2_quad_clean.evt |
| Size (bytes) | 516,761,280 | 87,451,200 |
| Size | 492.8 MB | 83.4 MB |
| Events in quadrant A | 3,280,048 | 552,737 |
| Events in quadrant B | 5,067,841 | 554,732 |
| Events in quadrant C | 3,361,923 | 539,460 |
| Events in quadrant D | 3,482,340 | 530,447 |
| Mode SS | |||
|---|---|---|---|
| Quadrant | BADHDUFLAG | Total packets | Discarded packets |
| A | 0 | 138 | 0 |
| B | 0 | 138 | 0 |
| C | 0 | 138 | 0 |
| D | 0 | 138 | 0 |
| Mode M9 | |||
|---|---|---|---|
| Quadrant | BADHDUFLAG | Total packets | Discarded packets |
| A | 0 | 8 | 0 |
| B | 0 | 8 | 0 |
| C | 0 | 8 | 0 |
| D | 0 | 8 | 0 |
| Mode M0 | |||
|---|---|---|---|
| Quadrant | BADHDUFLAG | Total packets | Discarded packets |
| A | 0 | 13981 | 1 |
| B | 0 | 20302 | 1 |
| C | 0 | 14143 | 1 |
| D | 0 | 14505 | 1 |
| Quadrant | Total seconds | Saturated seconds | Saturation percentage |
|---|---|---|---|
| A | 6751 | 59 | 0.873945% |
| B | 6752 | 111 | 1.643957% |
| C | 6752 | 90 | 1.332938% |
| D | 6752 | 67 | 0.992299% |
Noise dominated data is calculated using 1-second bins in cleaned event files. If a bin has >2000 counts, and if more than 50% of those come from <1% of pixels, then it is considered to be noise-dominated and hence unusable.
| Quadrant | # 1 sec bins | Bins with >0 counts | Bins with >2000 counts | High rate bins dominated by noise | Noise dominated (total time) | Noise dominated (detector-on time) | Marked lightcurve |
|---|---|---|---|---|---|---|---|
| A | 7591 | 6751 | 0 | 0 | 0.00% | 0.00% | 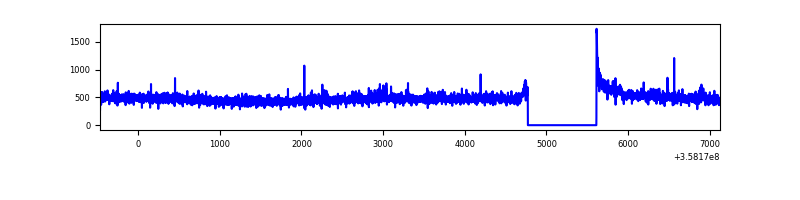 |
| B | 7592 | 6752 | 1 | 1 | 0.01% | 0.01% | 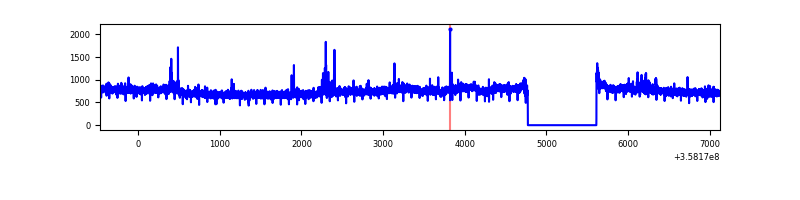 |
| C | 7592 | 6752 | 1 | 1 | 0.01% | 0.01% | 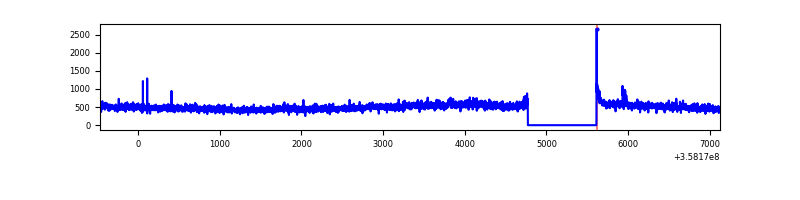 |
| D | 7592 | 6752 | 21 | 21 | 0.28% | 0.31% | 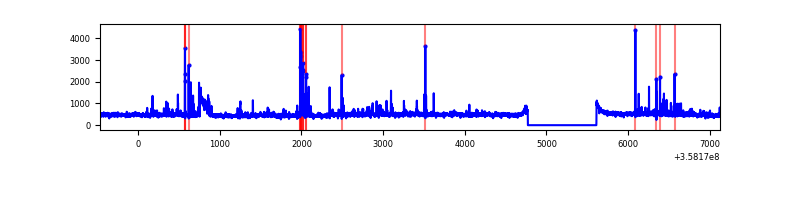 |
Top three noisy pixels from each quadrant. If the there are fewer than three noisy pixels in the level2.evt file, extra rows are filled as -1
| Pixel properties | Quadrant properties | ||||||
|---|---|---|---|---|---|---|---|
| Quadrant | DetID | PixID | Counts | Sigma | Mean | Median | Sigma |
| A | 5 | 203 | 58842 | 349.88 | 825 | 806 | 165.9 |
| A | 14 | 239 | 22707 | 132.03 | 825 | 806 | 165.9 |
| A | 13 | 254 | 12684 | 71.61 | 825 | 806 | 165.9 |
| B | 6 | 159 | 1808456 | 11593.93 | 809 | 787 | 155.9 |
| B | 0 | 190 | 33009 | 206.66 | 809 | 787 | 155.9 |
| B | 6 | 36 | 25603 | 159.16 | 809 | 787 | 155.9 |
| C | 3 | 233 | 153388 | 828.45 | 785 | 791 | 184.2 |
| C | 14 | 238 | 126723 | 683.69 | 785 | 791 | 184.2 |
| C | 2 | 114 | 15448 | 79.57 | 785 | 791 | 184.2 |
| D | 2 | 250 | 155191 | 818.07 | 800 | 779 | 188.8 |
| D | 8 | 195 | 143870 | 758.09 | 800 | 779 | 188.8 |
| D | 13 | 168 | 96663 | 507.99 | 800 | 779 | 188.8 |
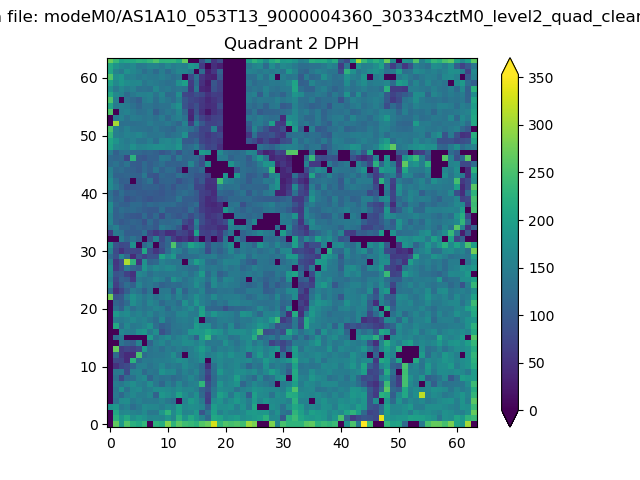
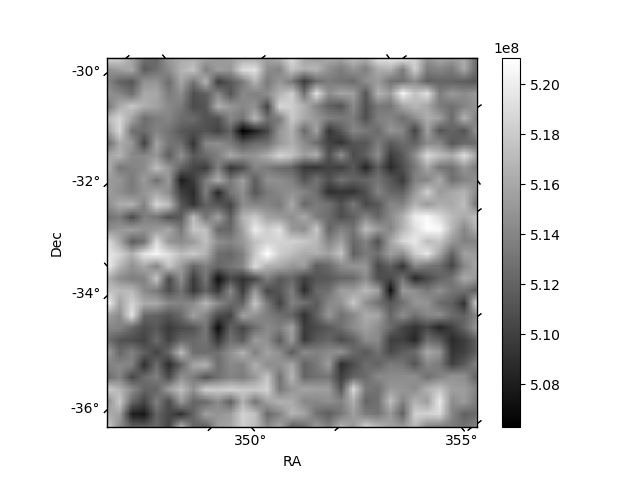
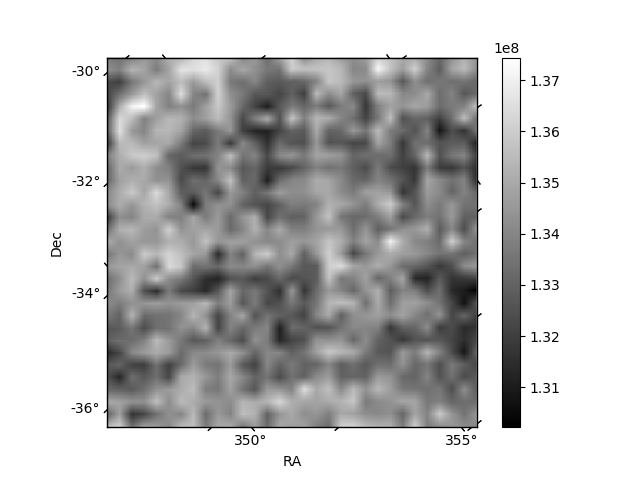
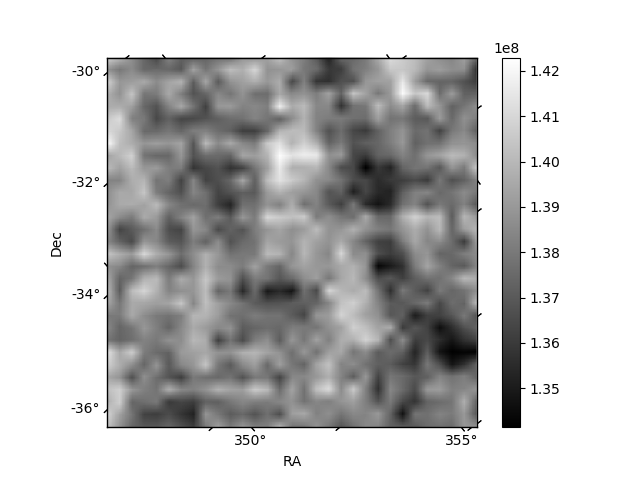
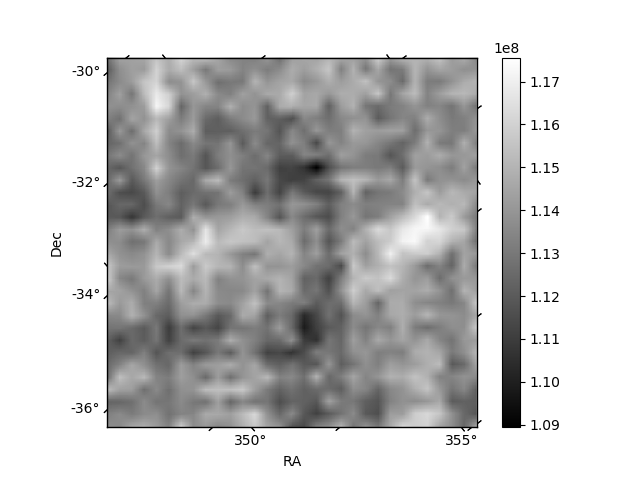
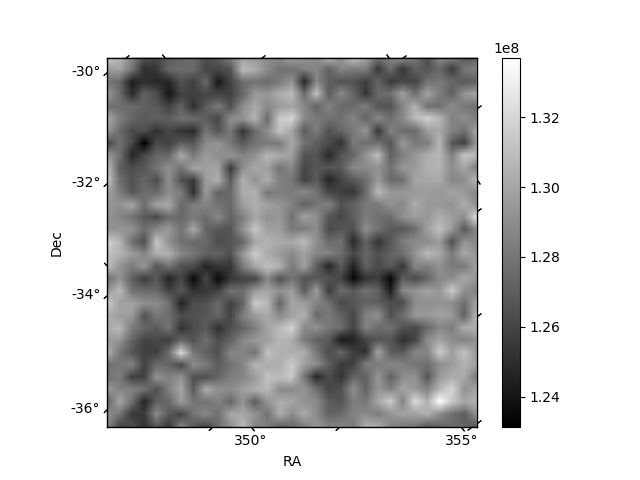
Histogram calculated using DETX and DETY for each event in the final _common_clean file
| Quadrant A | 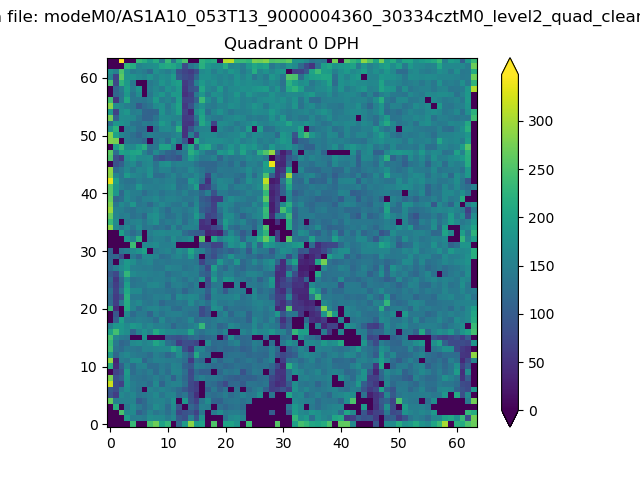 |
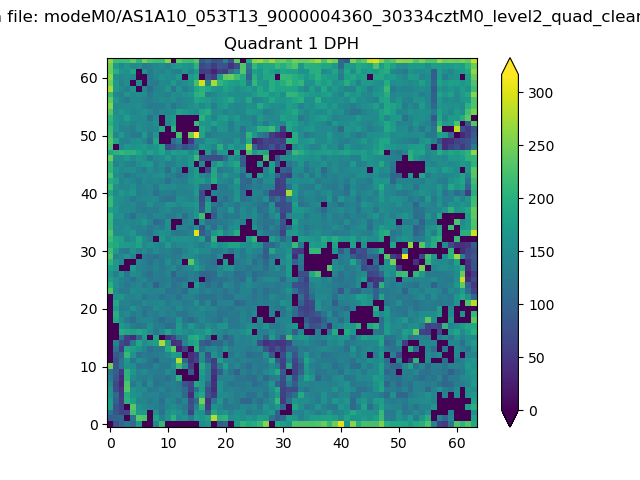 |
Quadrant B |
|---|---|---|---|
| Quadrant D | 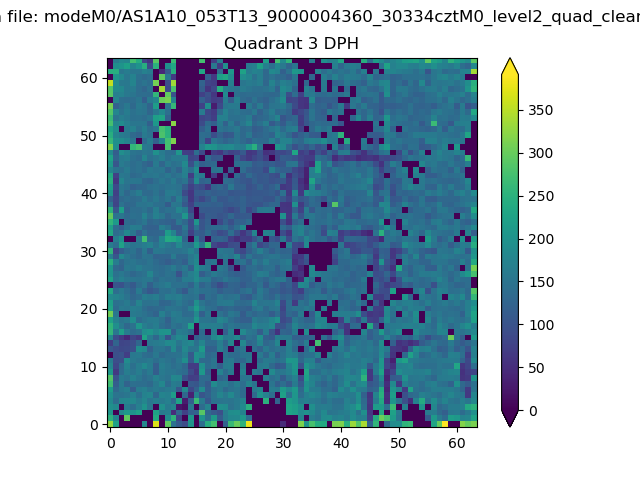 |
 |
Quadrant C |
| Plot type | Count rate plots | Images |
|---|---|---|
| Comparison with Poisson distribution Blue bars denote a histogram of data divided into 1 sec bins. Red curve is a Poisson curve with rate = median count rate of data. |
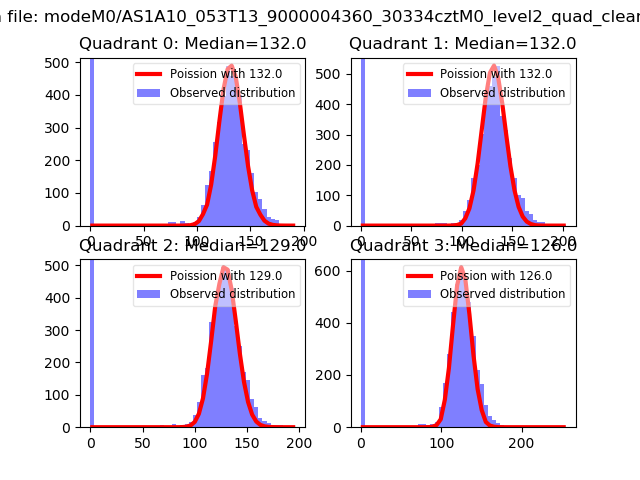 |
 |
| Quadrant-wise count rates Data is divided into 100 sec bins |
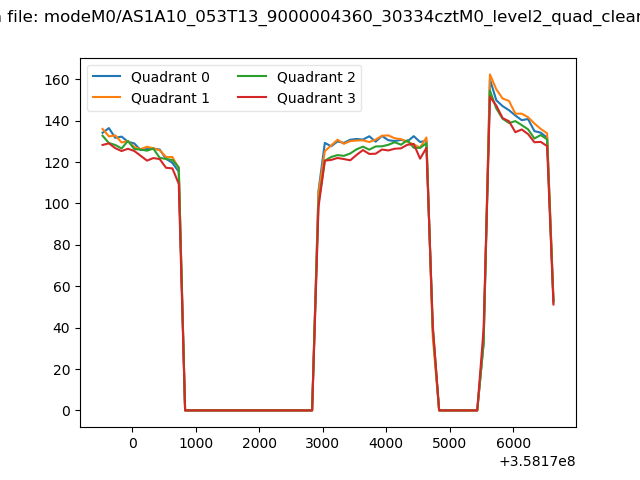 |
|
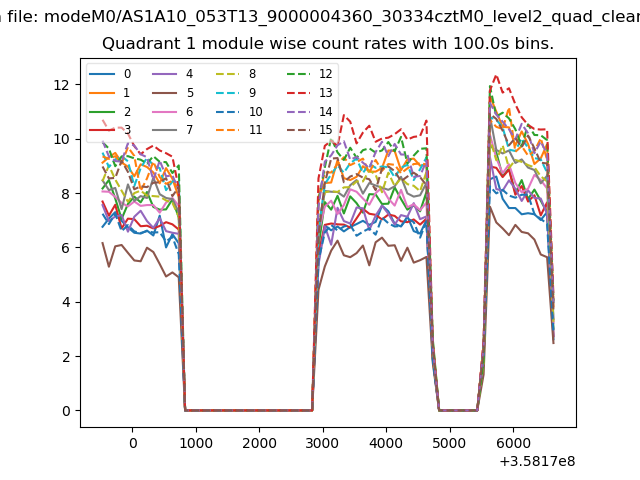
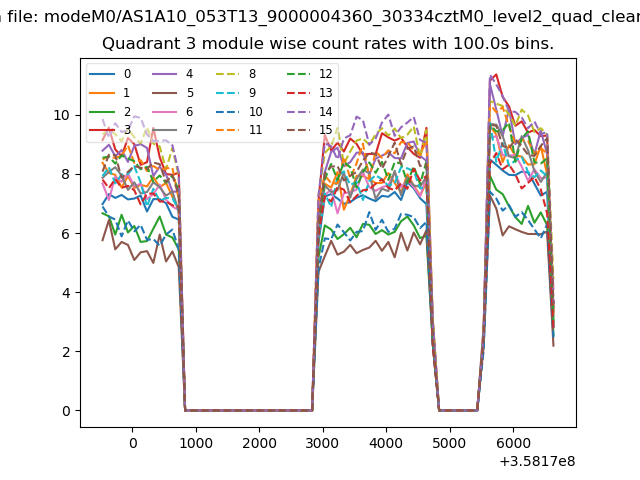
| Module-wise count rates for Quadrant A Data is divided into 100 sec bins |
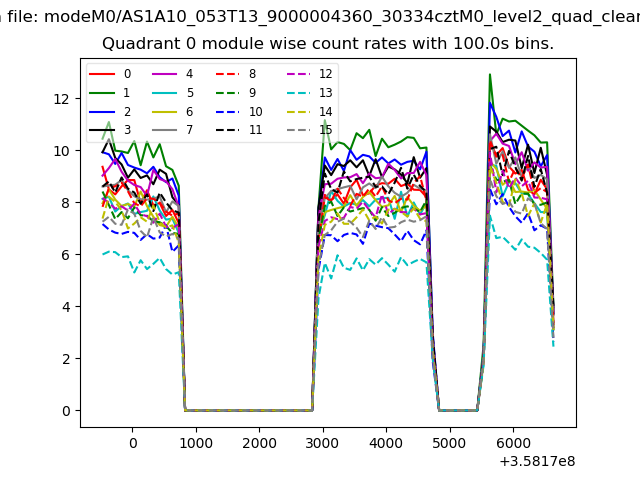 |
 |
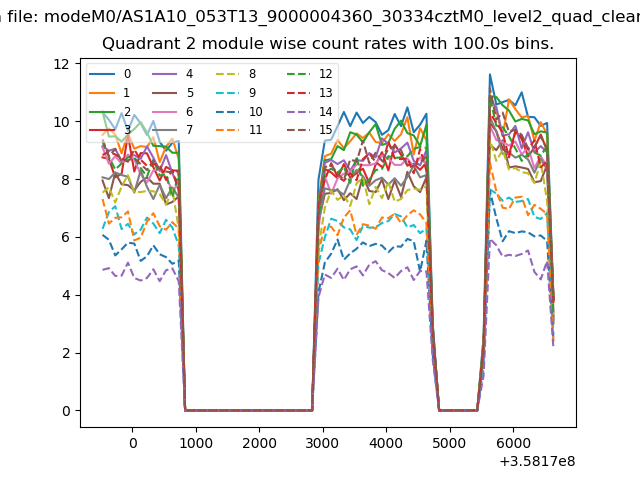
| Module-wise count rates for Quadrant B Data is divided into 100 sec bins |
 |
 |
| Module-wise count rates for Quadrant C Data is divided into 100 sec bins |
 |
 |
| Module-wise count rates for Quadrant D Data is divided into 100 sec bins |
 |
 |
| Parameter | Plot |
|---|---|
| CZT HV Monitor | 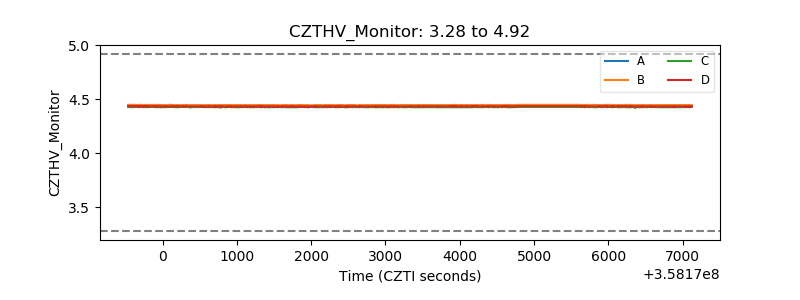 |
| D_VDD | 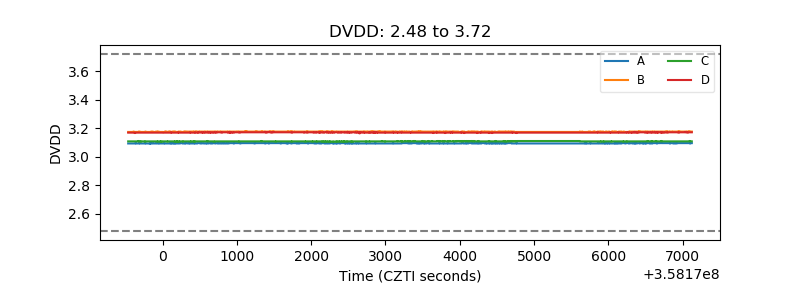 |
| Temperature 1 | 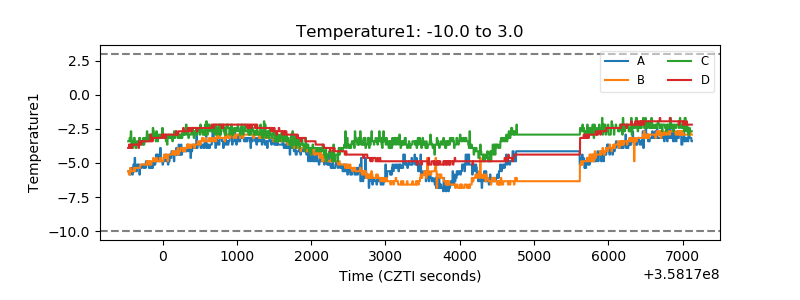 |
| Veto HV Monitor | 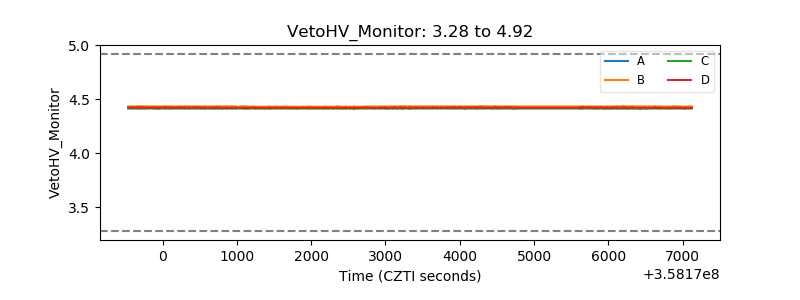 |
| Veto LLD | 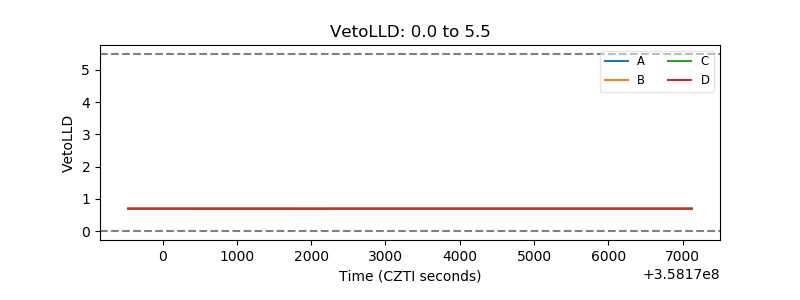 |
| Alpha Counter | 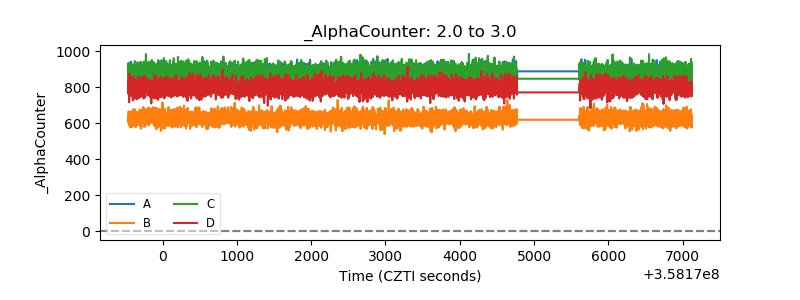 |
| _CPM_Rate | 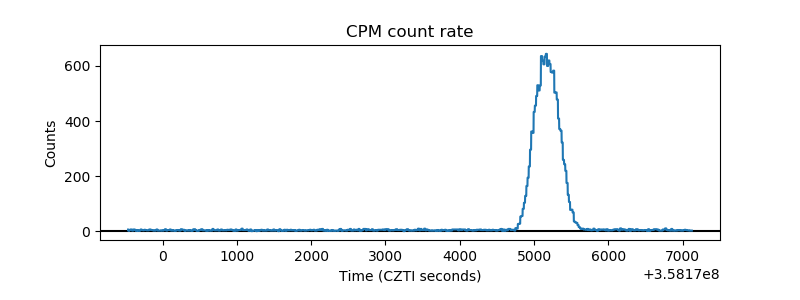 |
| CZT Counter | 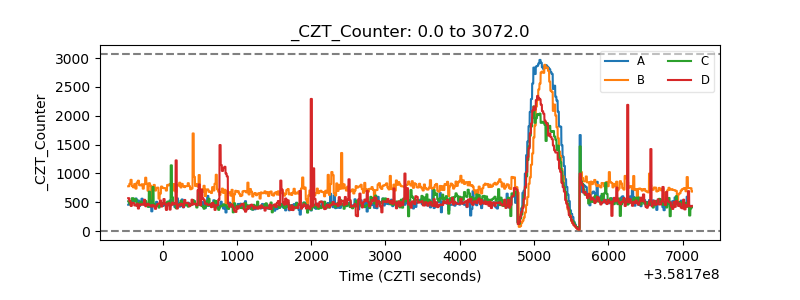 |
| +2.5 Volts monitor |  |
| +5 Volts monitor |  |
| _ROLL_ROT | 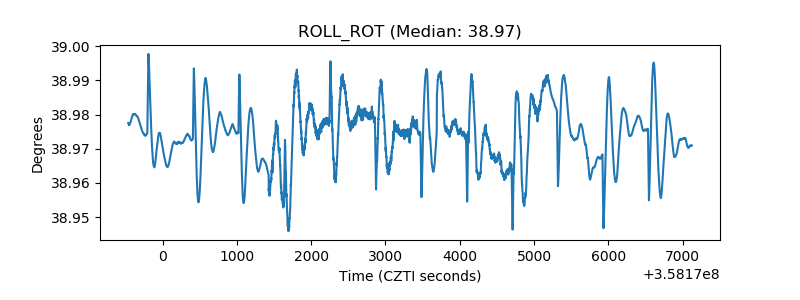 |
| _Roll_DEC | 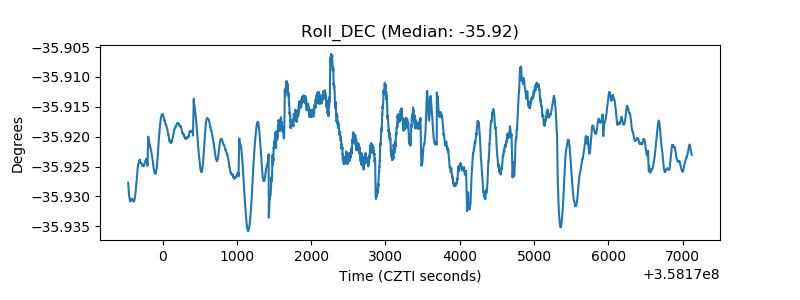 |
| _Roll_RA | 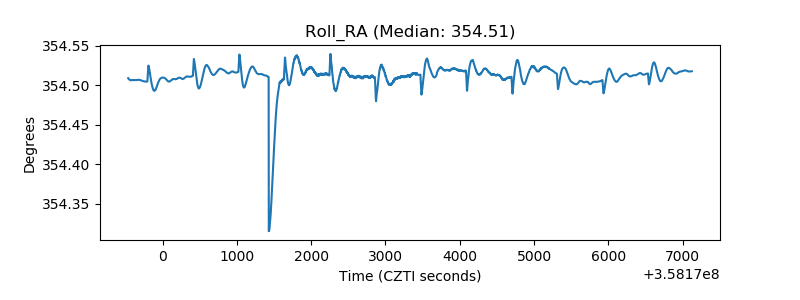 |
| Veto Counter | 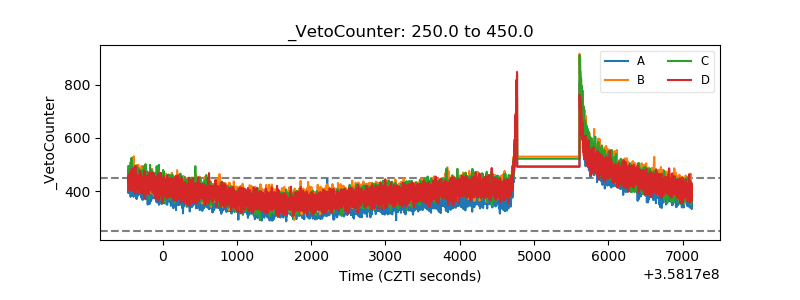 |