| Param | Original file | Final file |
|---|---|---|
| Filename | modeM0/AS1A10_053T13_9000004360_30337cztM0_level2.evt | modeM0/AS1A10_053T13_9000004360_30337cztM0_level2_quad_clean.evt |
| Size (bytes) | 501,802,560 | 68,207,040 |
| Size | 478.6 MB | 65.0 MB |
| Events in quadrant A | 3,233,118 | 420,646 |
| Events in quadrant B | 4,864,274 | 421,829 |
| Events in quadrant C | 3,271,442 | 397,471 |
| Events in quadrant D | 3,413,372 | 397,875 |
| Mode SS | |||
|---|---|---|---|
| Quadrant | BADHDUFLAG | Total packets | Discarded packets |
| A | 0 | 124 | 0 |
| B | 0 | 124 | 0 |
| C | 0 | 124 | 0 |
| D | 0 | 124 | 0 |
| Mode M9 | |||
|---|---|---|---|
| Quadrant | BADHDUFLAG | Total packets | Discarded packets |
| A | 0 | 11 | 0 |
| B | 0 | 11 | 0 |
| C | 0 | 11 | 0 |
| D | 0 | 11 | 0 |
| Mode M0 | |||
|---|---|---|---|
| Quadrant | BADHDUFLAG | Total packets | Discarded packets |
| A | 0 | 13484 | 1 |
| B | 0 | 18690 | 1 |
| C | 0 | 13504 | 1 |
| D | 0 | 13946 | 1 |
| Quadrant | Total seconds | Saturated seconds | Saturation percentage |
|---|---|---|---|
| A | 6122 | 69 | 1.127083% |
| B | 6123 | 112 | 1.829169% |
| C | 6122 | 144 | 2.352172% |
| D | 6122 | 87 | 1.421104% |
Noise dominated data is calculated using 1-second bins in cleaned event files. If a bin has >2000 counts, and if more than 50% of those come from <1% of pixels, then it is considered to be noise-dominated and hence unusable.
| Quadrant | # 1 sec bins | Bins with >0 counts | Bins with >2000 counts | High rate bins dominated by noise | Noise dominated (total time) | Noise dominated (detector-on time) | Marked lightcurve |
|---|---|---|---|---|---|---|---|
| A | 7262 | 6122 | 1 | 1 | 0.01% | 0.02% | 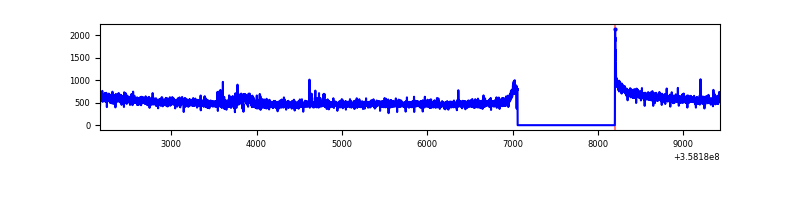 |
| B | 7263 | 6123 | 0 | 0 | 0.00% | 0.00% | 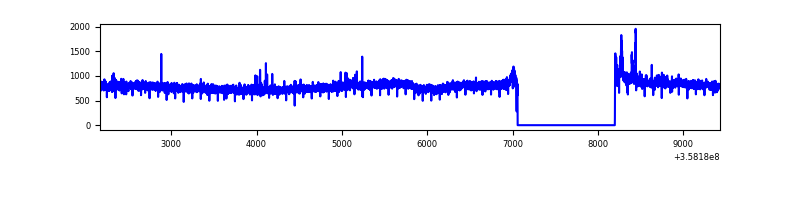 |
| C | 7262 | 6122 | 0 | 0 | 0.00% | 0.00% |  |
| D | 7262 | 6122 | 36 | 36 | 0.50% | 0.59% | 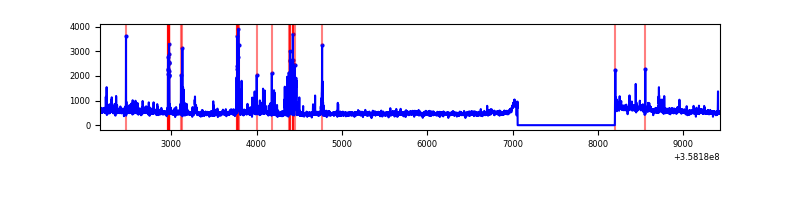 |
Top three noisy pixels from each quadrant. If the there are fewer than three noisy pixels in the level2.evt file, extra rows are filled as -1
| Pixel properties | Quadrant properties | ||||||
|---|---|---|---|---|---|---|---|
| Quadrant | DetID | PixID | Counts | Sigma | Mean | Median | Sigma |
| A | 5 | 203 | 81611 | 500.64 | 812 | 797 | 161.4 |
| A | 13 | 254 | 11014 | 63.29 | 812 | 797 | 161.4 |
| A | 14 | 239 | 10909 | 62.64 | 812 | 797 | 161.4 |
| B | 6 | 159 | 1674239 | 11070.13 | 798 | 780 | 151.2 |
| B | 6 | 36 | 40816 | 264.84 | 798 | 780 | 151.2 |
| B | 0 | 190 | 23624 | 151.12 | 798 | 780 | 151.2 |
| C | 14 | 238 | 146921 | 828.5 | 761 | 767 | 176.4 |
| C | 3 | 233 | 108959 | 613.31 | 761 | 767 | 176.4 |
| C | 14 | 254 | 30602 | 169.13 | 761 | 767 | 176.4 |
| D | 2 | 250 | 187930 | 1016.74 | 777 | 758 | 184.1 |
| D | 8 | 195 | 141769 | 765.99 | 777 | 758 | 184.1 |
| D | 13 | 249 | 82095 | 441.83 | 777 | 758 | 184.1 |
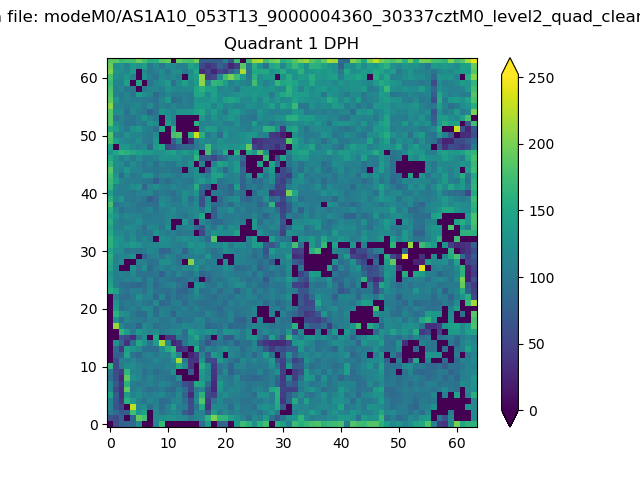
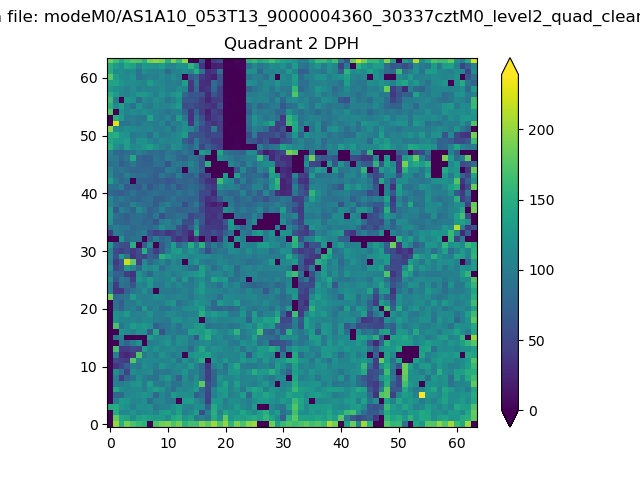
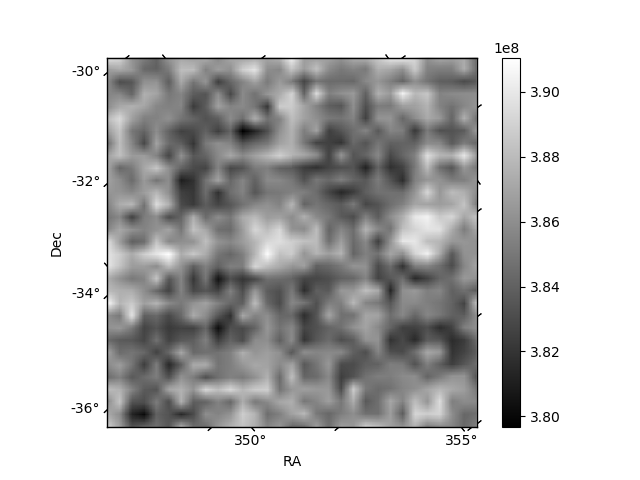
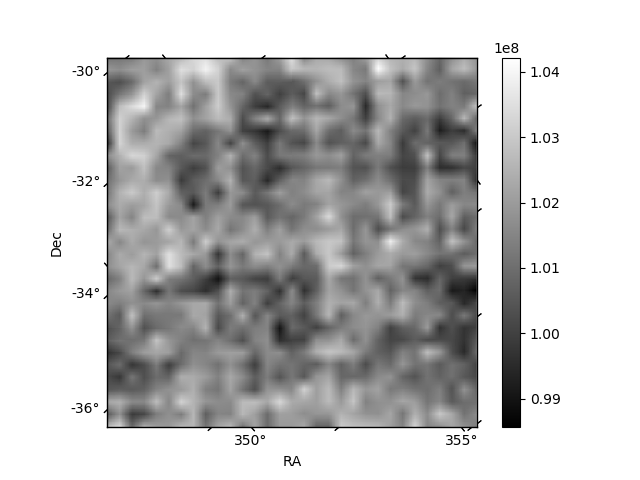
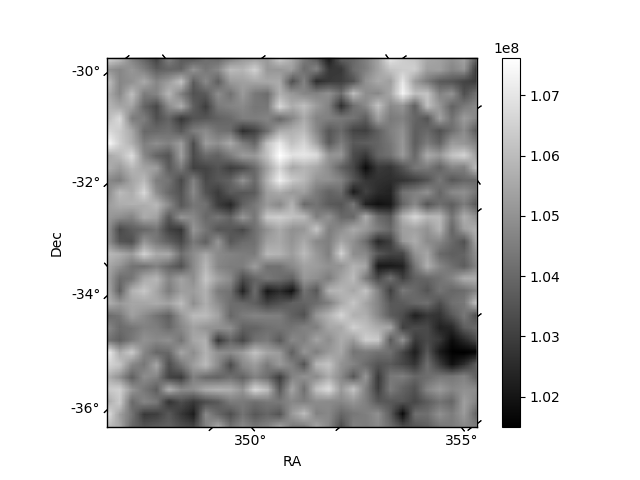
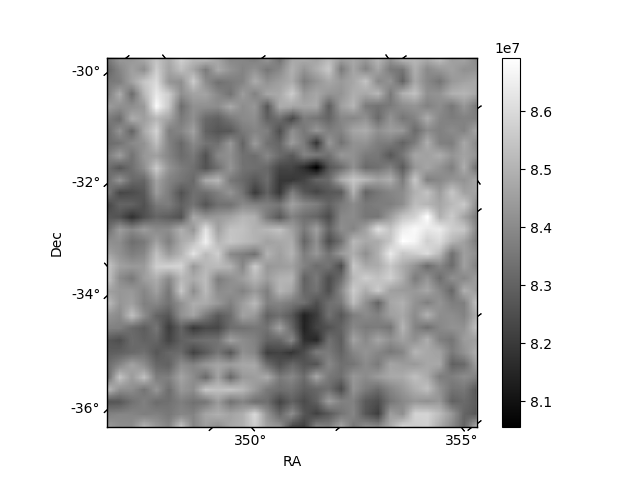
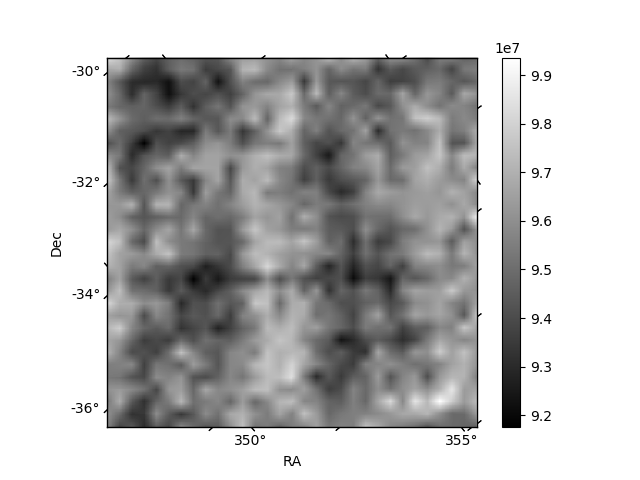
Histogram calculated using DETX and DETY for each event in the final _common_clean file
| Quadrant A | 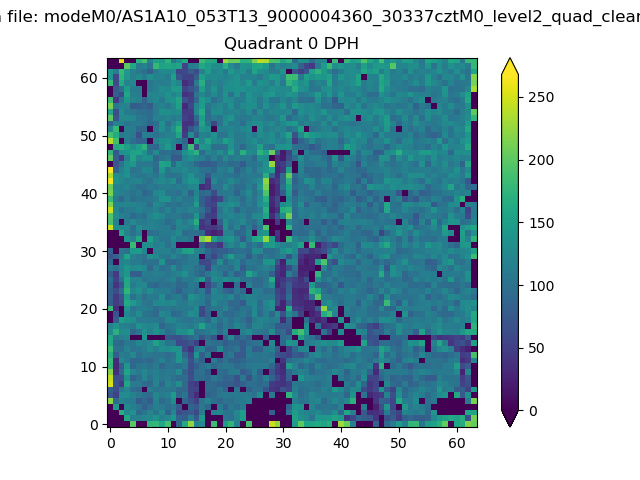 |
 |
Quadrant B |
|---|---|---|---|
| Quadrant D | 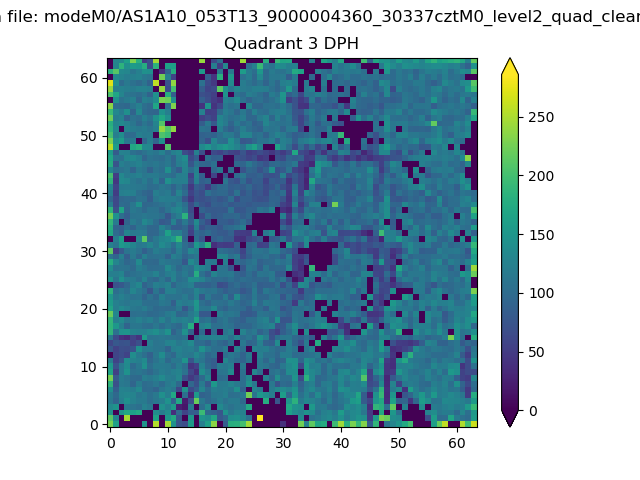 |
 |
Quadrant C |
| Plot type | Count rate plots | Images |
|---|---|---|
| Comparison with Poisson distribution Blue bars denote a histogram of data divided into 1 sec bins. Red curve is a Poisson curve with rate = median count rate of data. |
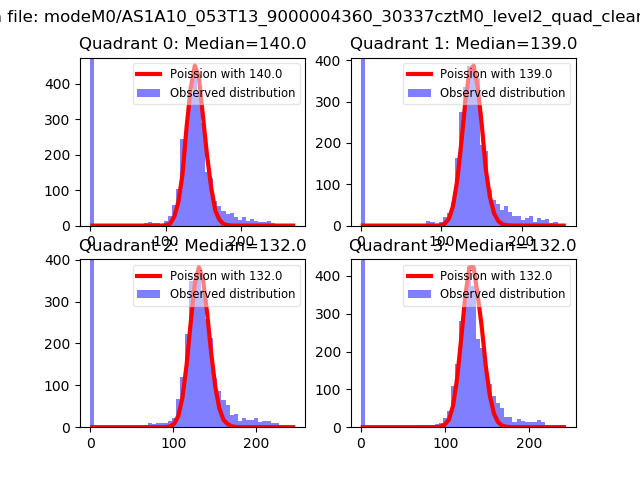 |
 |
| Quadrant-wise count rates Data is divided into 100 sec bins |
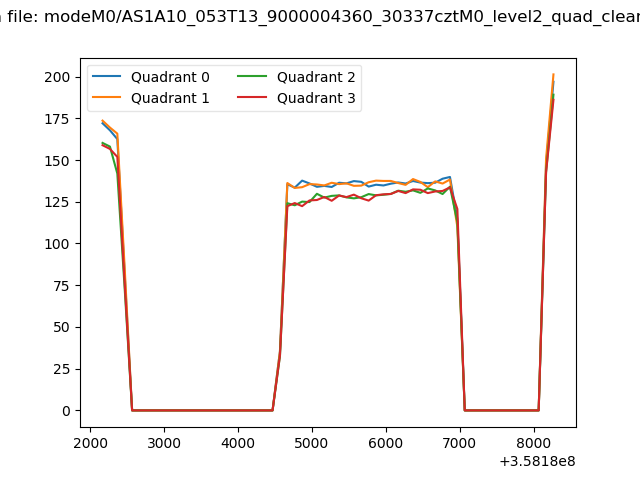 |
|
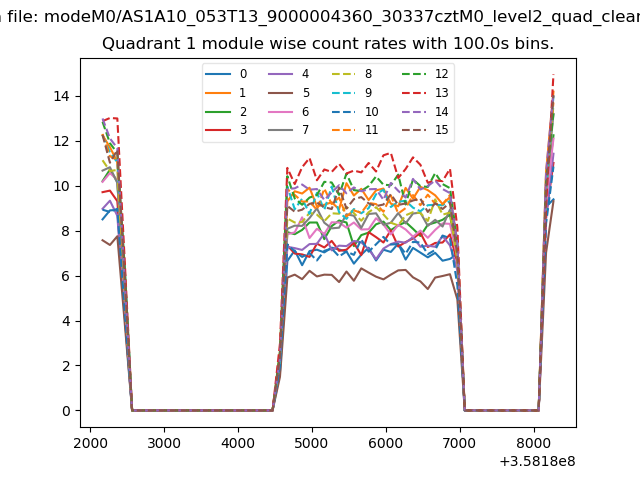
| Module-wise count rates for Quadrant A Data is divided into 100 sec bins |
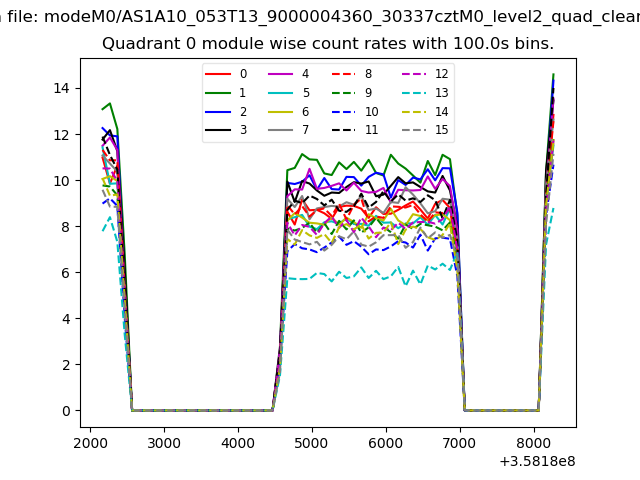 |
 |
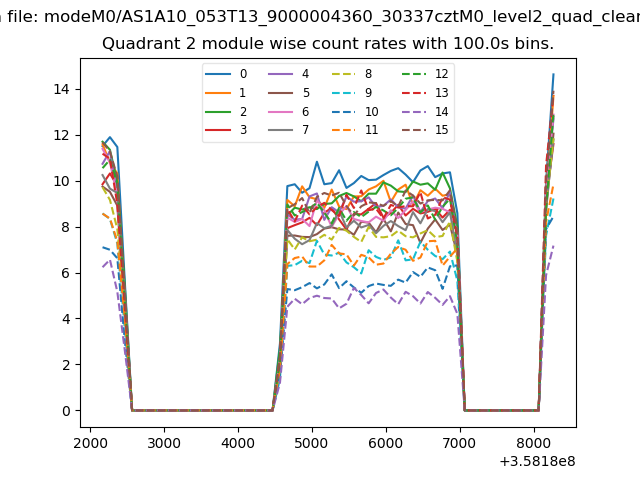
| Module-wise count rates for Quadrant B Data is divided into 100 sec bins |
 |
 |
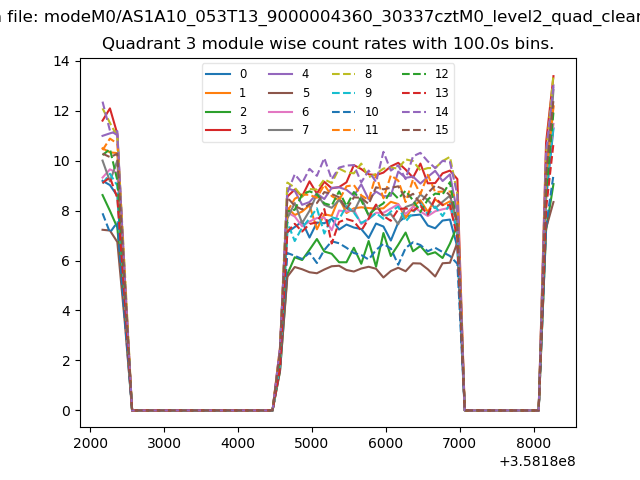
| Module-wise count rates for Quadrant C Data is divided into 100 sec bins |
 |
 |
| Module-wise count rates for Quadrant D Data is divided into 100 sec bins |
 |
 |
| Parameter | Plot |
|---|---|
| CZT HV Monitor |  |
| D_VDD | 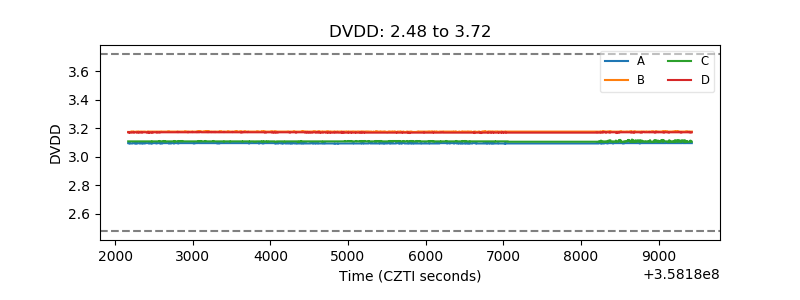 |
| Temperature 1 | 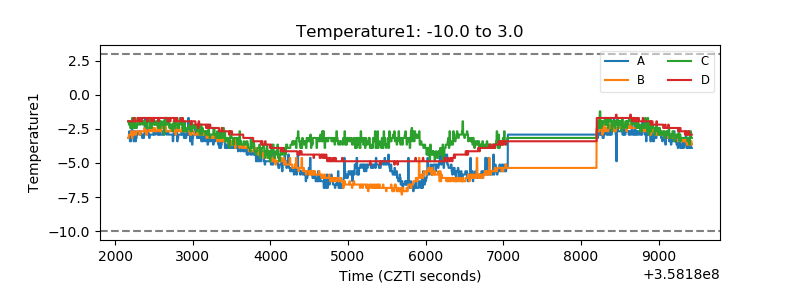 |
| Veto HV Monitor | 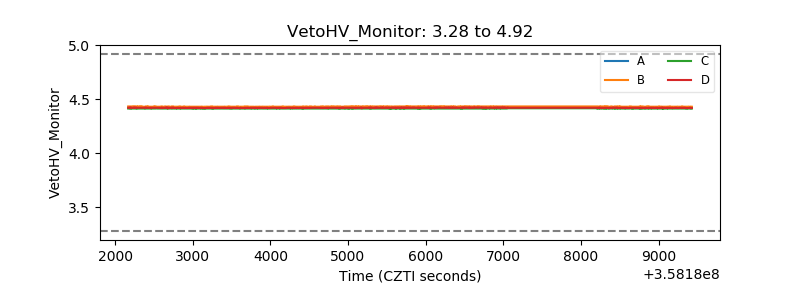 |
| Veto LLD | 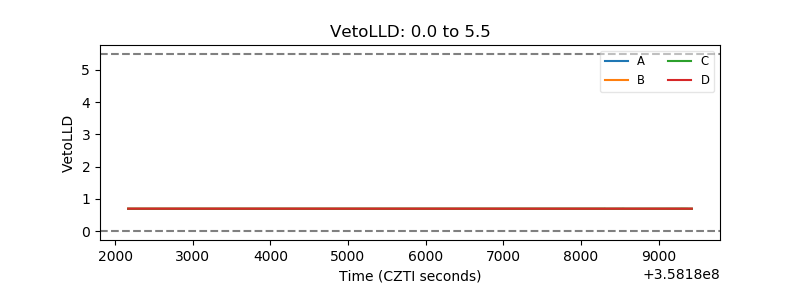 |
| Alpha Counter | 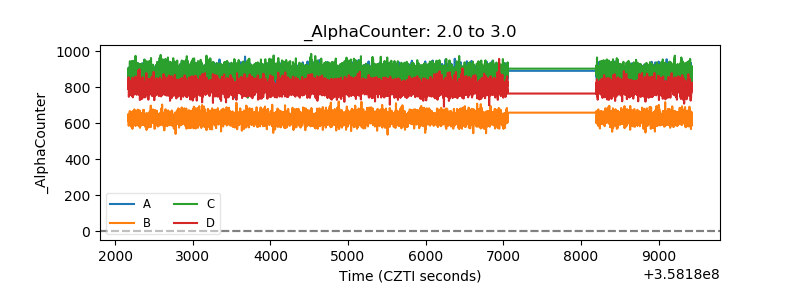 |
| _CPM_Rate | 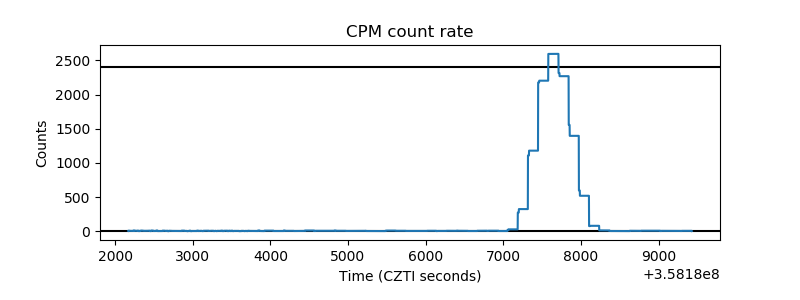 |
| CZT Counter | 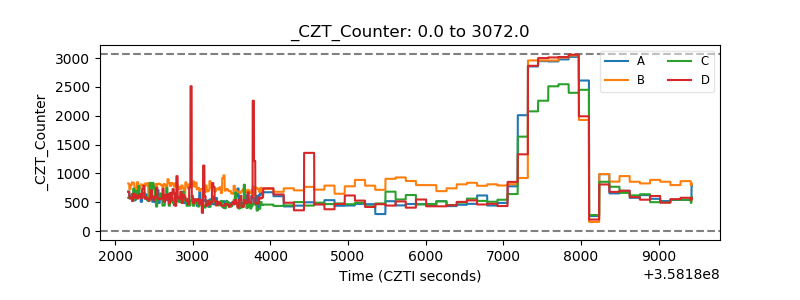 |
| +2.5 Volts monitor |  |
| +5 Volts monitor |  |
| _ROLL_ROT |  |
| _Roll_DEC | 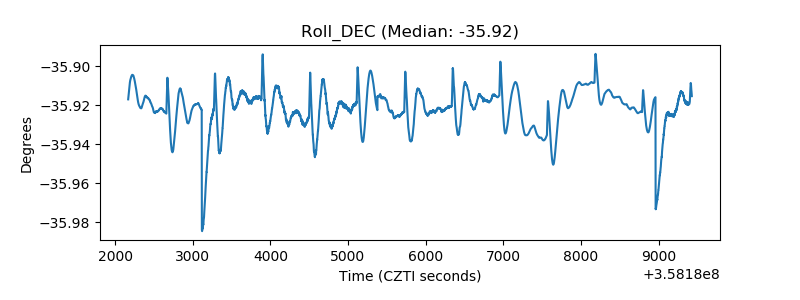 |
| _Roll_RA | 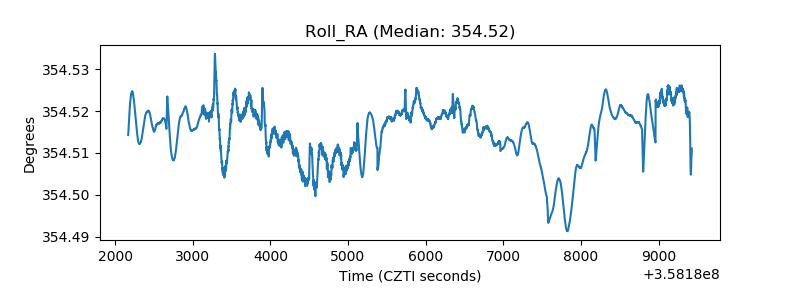 |
| Veto Counter | 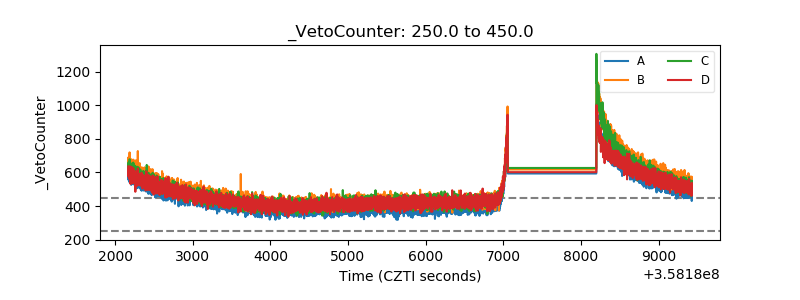 |