| Param | Original file | Final file |
|---|---|---|
| Filename | modeM0/AS1A10_053T13_9000004360_30338cztM0_level2.evt | modeM0/AS1A10_053T13_9000004360_30338cztM0_level2_quad_clean.evt |
| Size (bytes) | 567,129,600 | 68,961,600 |
| Size | 540.9 MB | 65.8 MB |
| Events in quadrant A | 3,579,907 | 422,868 |
| Events in quadrant B | 5,490,006 | 422,359 |
| Events in quadrant C | 3,567,827 | 402,614 |
| Events in quadrant D | 4,111,826 | 400,685 |
| Mode SS | |||
|---|---|---|---|
| Quadrant | BADHDUFLAG | Total packets | Discarded packets |
| A | 0 | 128 | 0 |
| B | 0 | 128 | 0 |
| C | 0 | 128 | 0 |
| D | 0 | 128 | 0 |
| Mode M9 | |||
|---|---|---|---|
| Quadrant | BADHDUFLAG | Total packets | Discarded packets |
| A | 0 | 13 | 0 |
| B | 0 | 14 | 0 |
| C | 0 | 14 | 0 |
| D | 0 | 14 | 0 |
| Mode M0 | |||
|---|---|---|---|
| Quadrant | BADHDUFLAG | Total packets | Discarded packets |
| A | 0 | 14672 | 2 |
| B | 0 | 20329 | 2 |
| C | 0 | 14582 | 2 |
| D | 0 | 16274 | 2 |
| Quadrant | Total seconds | Saturated seconds | Saturation percentage |
|---|---|---|---|
| A | 6296 | 83 | 1.318297% |
| B | 6296 | 212 | 3.367217% |
| C | 6296 | 111 | 1.763024% |
| D | 6295 | 282 | 4.479746% |
Noise dominated data is calculated using 1-second bins in cleaned event files. If a bin has >2000 counts, and if more than 50% of those come from <1% of pixels, then it is considered to be noise-dominated and hence unusable.
| Quadrant | # 1 sec bins | Bins with >0 counts | Bins with >2000 counts | High rate bins dominated by noise | Noise dominated (total time) | Noise dominated (detector-on time) | Marked lightcurve |
|---|---|---|---|---|---|---|---|
| A | 7561 | 6296 | 2 | 2 | 0.03% | 0.03% | 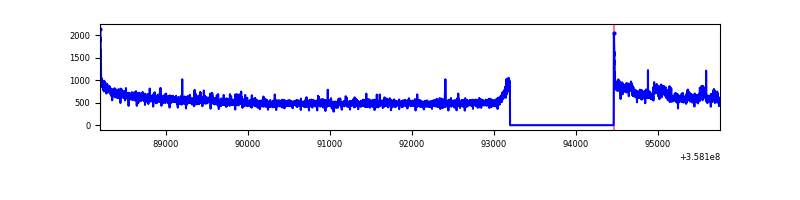 |
| B | 7561 | 6296 | 42 | 42 | 0.56% | 0.67% | 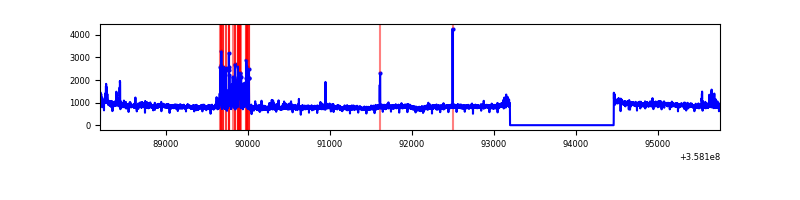 |
| C | 7561 | 6296 | 1 | 1 | 0.01% | 0.02% | 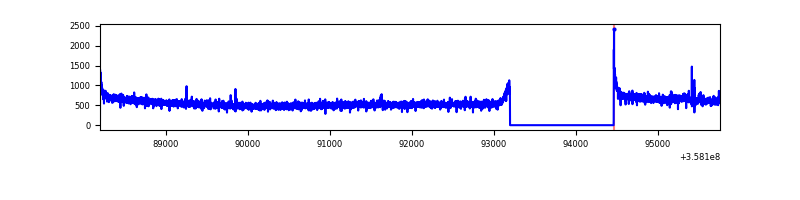 |
| D | 7560 | 6295 | 232 | 232 | 3.07% | 3.69% | 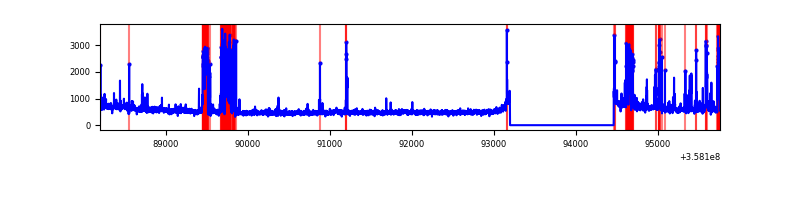 |
Top three noisy pixels from each quadrant. If the there are fewer than three noisy pixels in the level2.evt file, extra rows are filled as -1
| Pixel properties | Quadrant properties | ||||||
|---|---|---|---|---|---|---|---|
| Quadrant | DetID | PixID | Counts | Sigma | Mean | Median | Sigma |
| A | 5 | 203 | 131717 | 752.66 | 888 | 877 | 173.8 |
| A | 8 | 192 | 23254 | 128.72 | 888 | 877 | 173.8 |
| A | 13 | 254 | 11165 | 59.18 | 888 | 877 | 173.8 |
| B | 6 | 159 | 1748410 | 10705.88 | 876 | 855 | 163.2 |
| B | 6 | 36 | 263408 | 1608.45 | 876 | 855 | 163.2 |
| B | 0 | 190 | 40199 | 241.03 | 876 | 855 | 163.2 |
| C | 14 | 238 | 142001 | 736.99 | 836 | 843 | 191.5 |
| C | 3 | 233 | 131023 | 679.67 | 836 | 843 | 191.5 |
| C | 2 | 114 | 15213 | 75.03 | 836 | 843 | 191.5 |
| D | 13 | 249 | 650411 | 3058.71 | 826 | 812 | 212.4 |
| D | 8 | 195 | 133038 | 622.6 | 826 | 812 | 212.4 |
| D | 2 | 250 | 92476 | 431.61 | 826 | 812 | 212.4 |
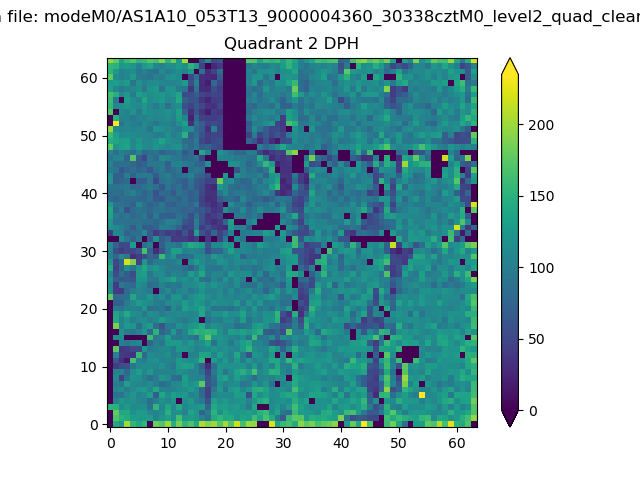
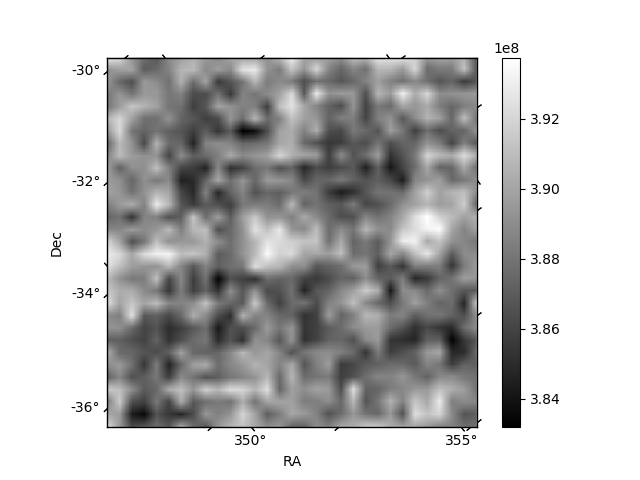
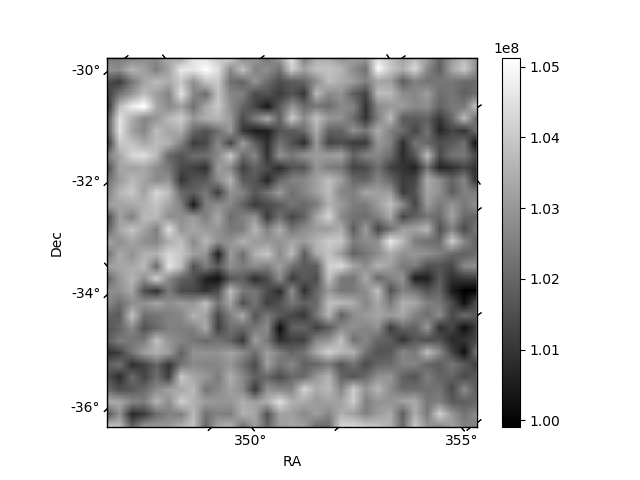
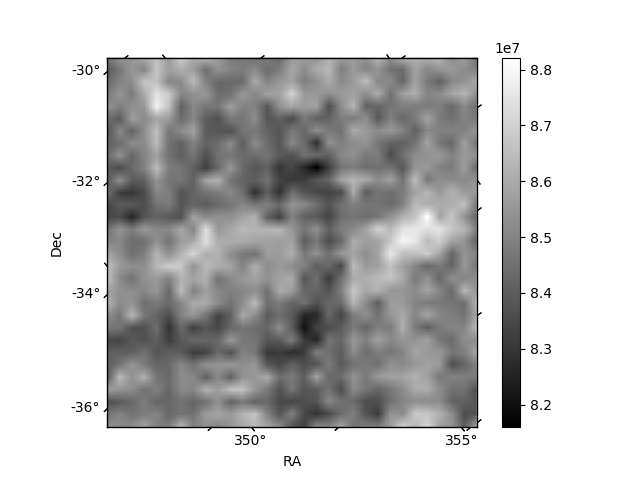
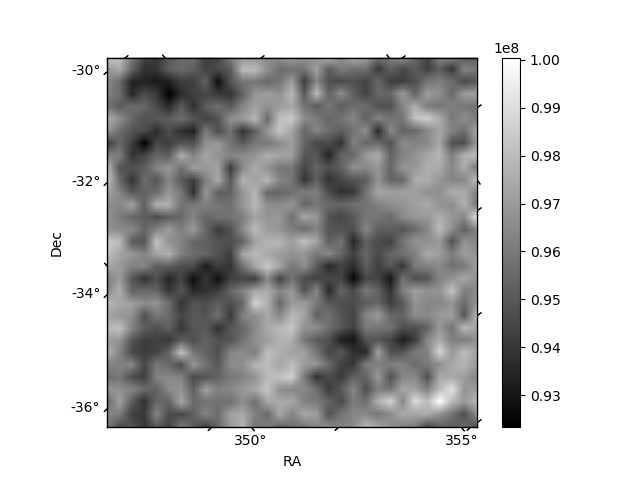
Histogram calculated using DETX and DETY for each event in the final _common_clean file
| Quadrant A | 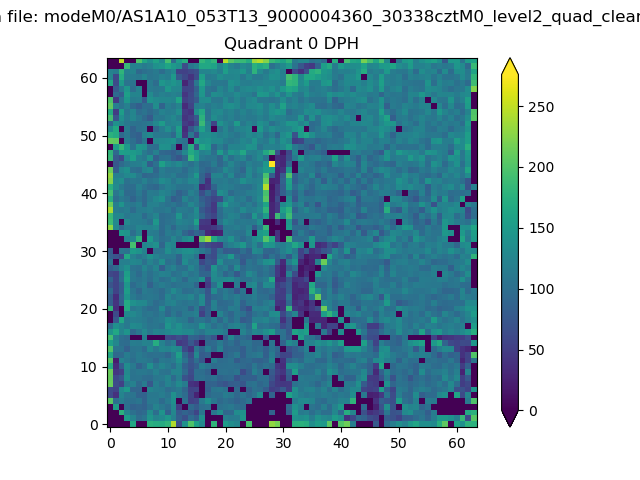 |
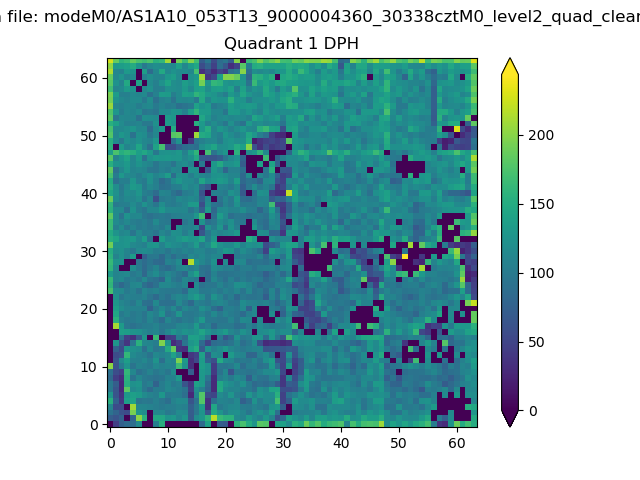 |
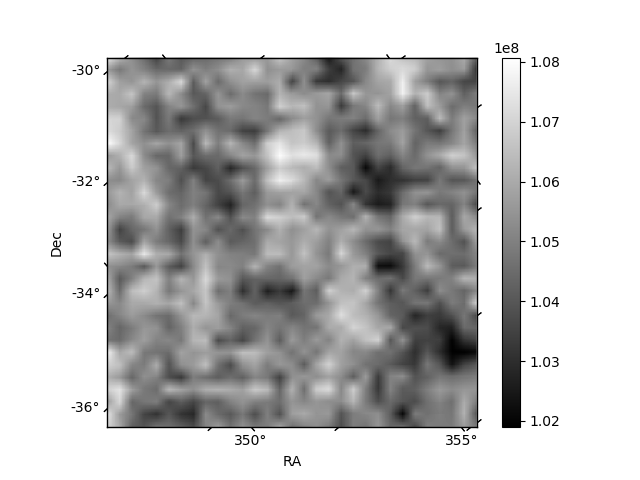
Quadrant B |
|---|---|---|---|
| Quadrant D | 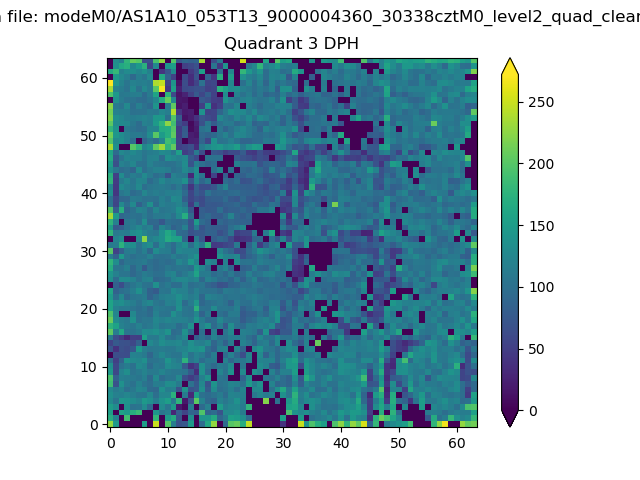 |
 |
Quadrant C |
| Plot type | Count rate plots | Images |
|---|---|---|
| Comparison with Poisson distribution Blue bars denote a histogram of data divided into 1 sec bins. Red curve is a Poisson curve with rate = median count rate of data. |
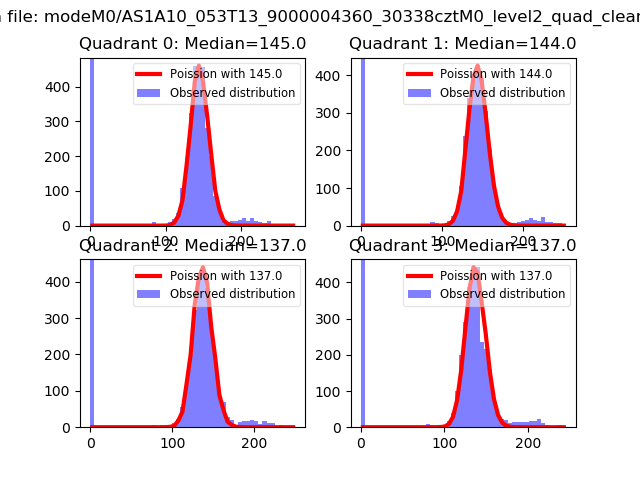 |
 |
| Quadrant-wise count rates Data is divided into 100 sec bins |
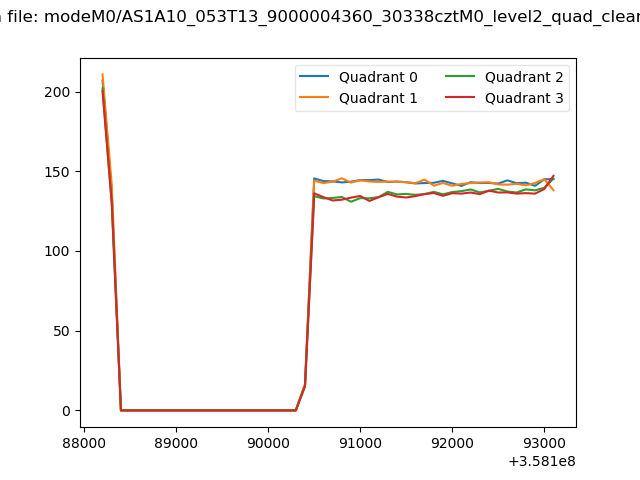 |
|
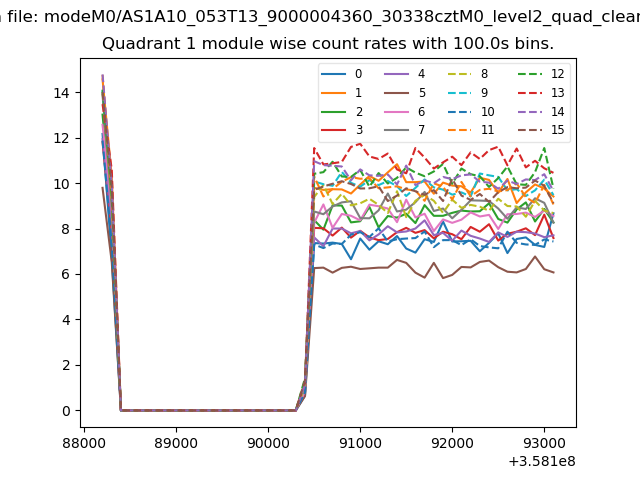
| Module-wise count rates for Quadrant A Data is divided into 100 sec bins |
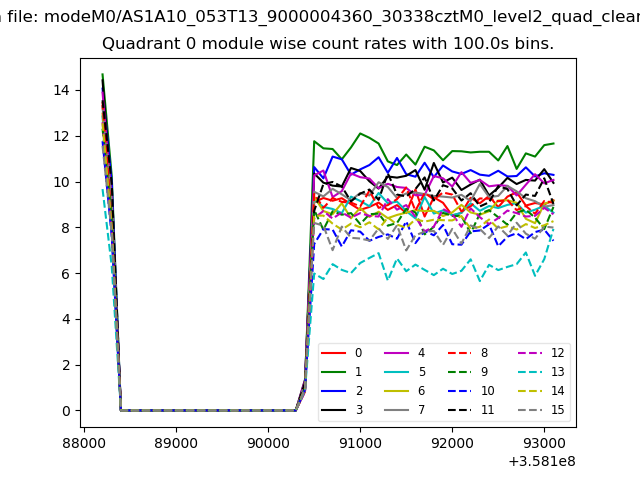 |
 |
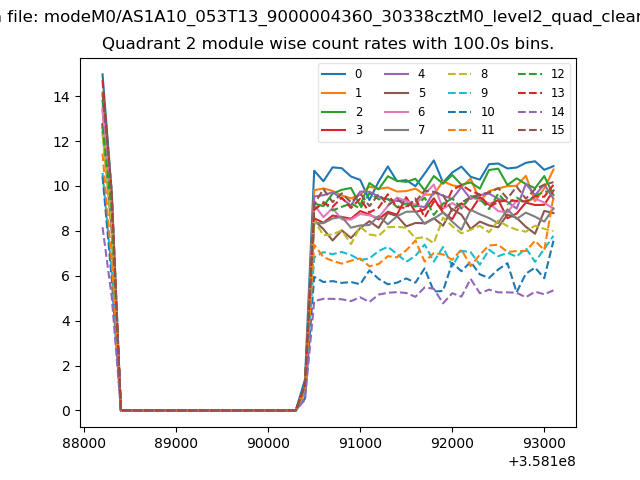
| Module-wise count rates for Quadrant B Data is divided into 100 sec bins |
 |
 |
| Module-wise count rates for Quadrant C Data is divided into 100 sec bins |
 |
 |
| Module-wise count rates for Quadrant D Data is divided into 100 sec bins |
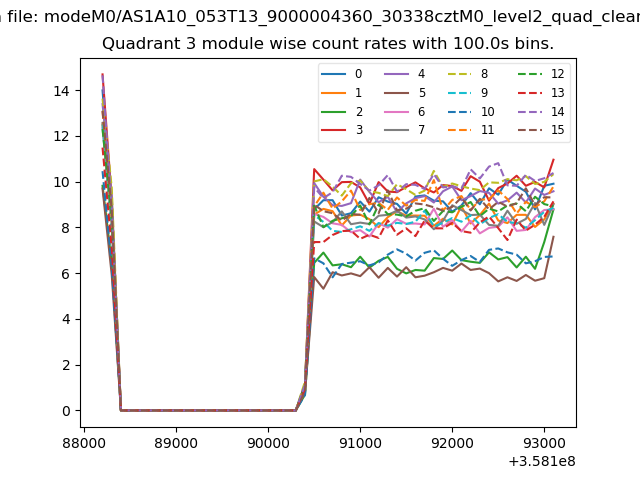 |
 |
| Parameter | Plot |
|---|---|
| CZT HV Monitor | 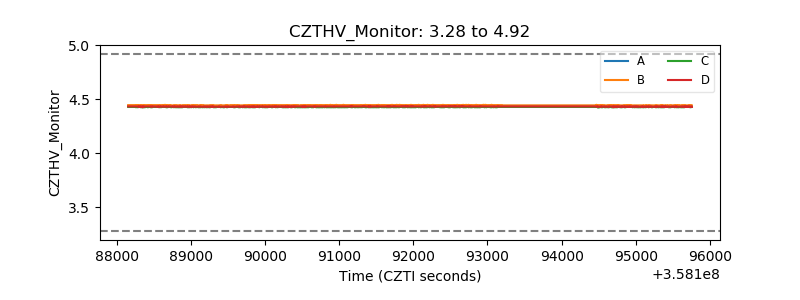 |
| D_VDD | 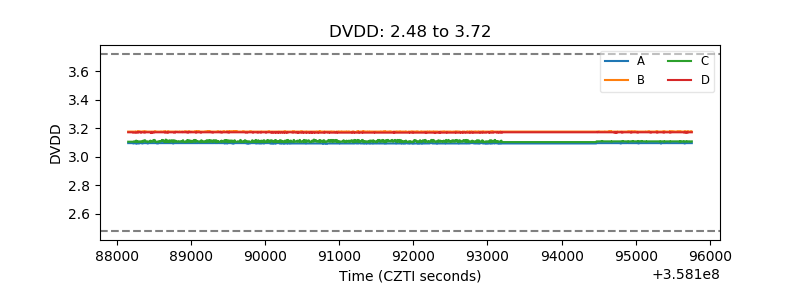 |
| Temperature 1 | 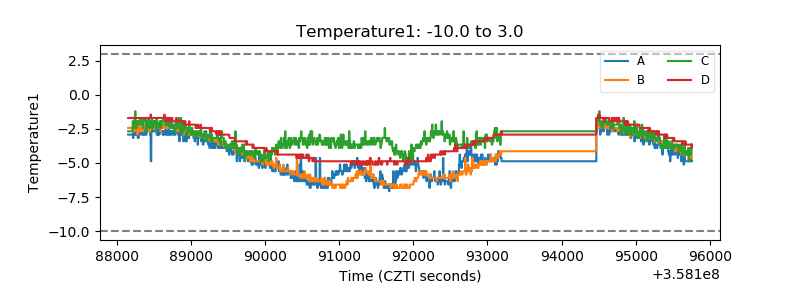 |
| Veto HV Monitor | 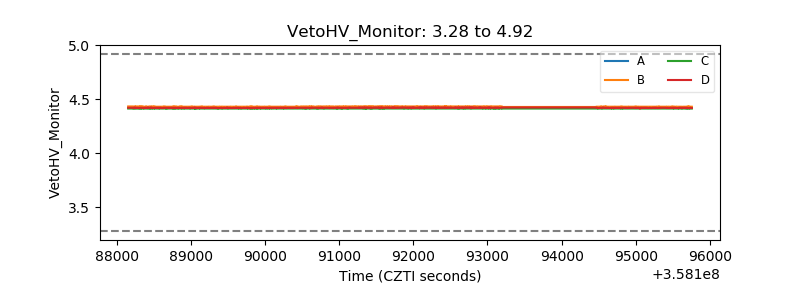 |
| Veto LLD | 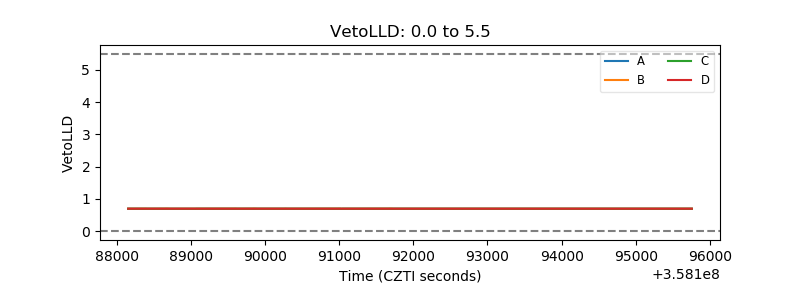 |
| Alpha Counter |  |
| _CPM_Rate |  |
| CZT Counter | 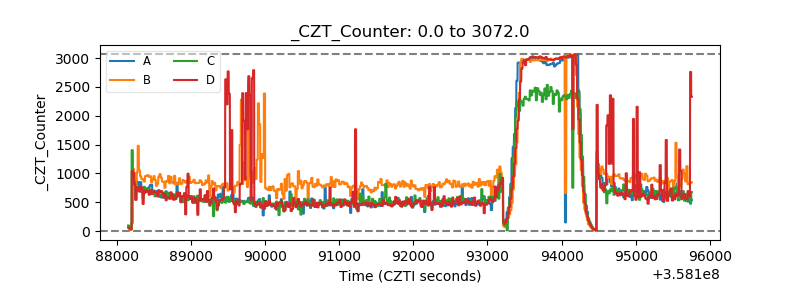 |
| +2.5 Volts monitor |  |
| +5 Volts monitor |  |
| _ROLL_ROT | 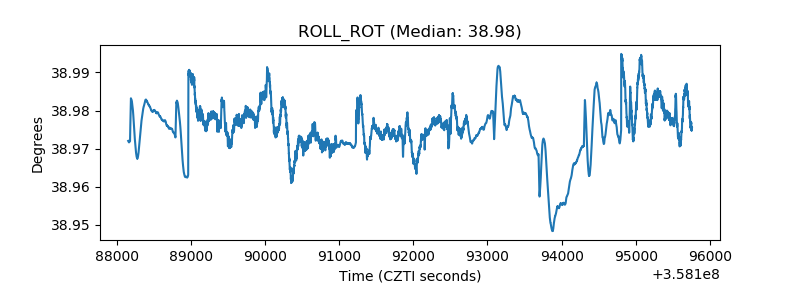 |
| _Roll_DEC | 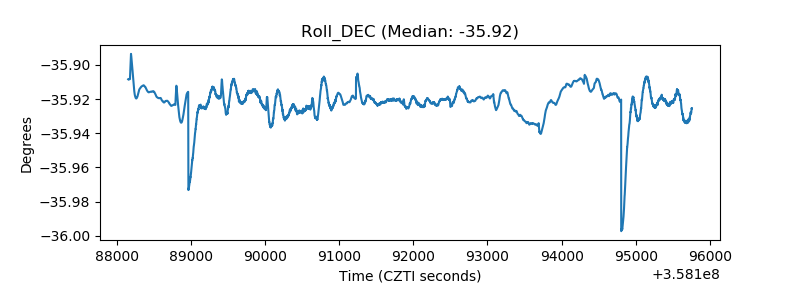 |
| _Roll_RA | 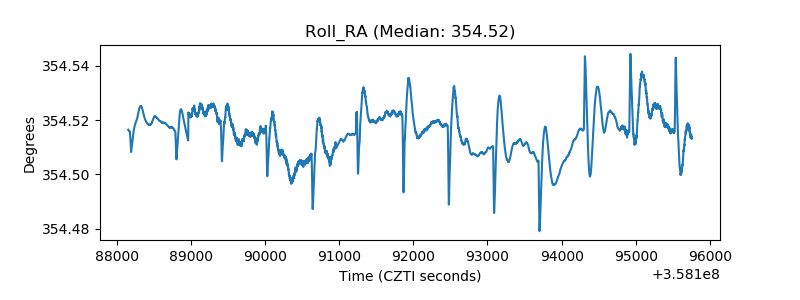 |
| Veto Counter | 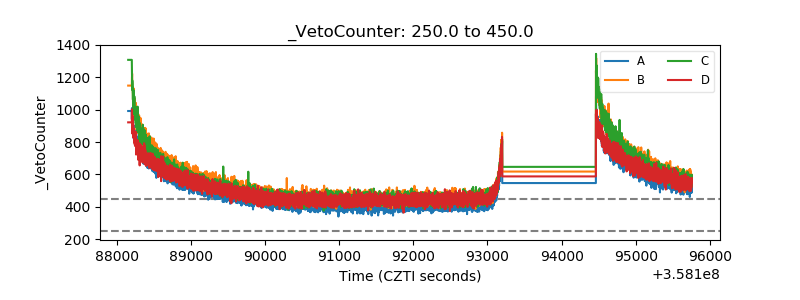 |