| Param | Original file | Final file |
|---|---|---|
| Filename | modeM0/AS1A10_053T14_9000004362cztM0_level2.fits | modeM0/AS1A10_053T14_9000004362cztM0_level2_quad_clean.evt |
| Size (bytes) | 529,050,240 | 449,317,440 |
| Size | 504.5 MB | 428.5 MB |
| Events in quadrant A | 3,307,750 | 2,621,065 |
| Events in quadrant B | 3,109,870 | 2,603,074 |
| Events in quadrant C | 3,206,654 | 2,499,505 |
| Events in quadrant D | 2,789,726 | 2,275,366 |
| Mode SS | |||
|---|---|---|---|
| Quadrant | BADHDUFLAG | Total packets | Discarded packets |
| A | 0 | 1070 | 0 |
| B | 0 | 1070 | 0 |
| C | 0 | 1070 | 0 |
| D | 0 | 1070 | 0 |
| Mode M9 | |||
|---|---|---|---|
| Quadrant | BADHDUFLAG | Total packets | Discarded packets |
| A | 0 | 75 | 0 |
| B | 0 | 75 | 0 |
| C | 0 | 75 | 0 |
| D | 0 | 75 | 0 |
| Mode M0 | |||
|---|---|---|---|
| Quadrant | BADHDUFLAG | Total packets | Discarded packets |
| A | 0 | 112389 | 0 |
| B | 0 | 159719 | 0 |
| C | 0 | 114844 | 0 |
| D | 0 | 129634 | 0 |
| Quadrant | Total seconds | Saturated seconds | Saturation percentage |
|---|---|---|---|
| A | 52571 | 705 | 1.341044% |
| B | 52571 | 1412 | 2.685891% |
| C | 52571 | 1464 | 2.784805% |
| D | 52571 | 2892 | 5.501132% |
Noise dominated data is calculated using 1-second bins in cleaned event files. If a bin has >2000 counts, and if more than 50% of those come from <1% of pixels, then it is considered to be noise-dominated and hence unusable.
| Quadrant | # 1 sec bins | Bins with >0 counts | Bins with >2000 counts | High rate bins dominated by noise | Noise dominated (total time) | Noise dominated (detector-on time) | Marked lightcurve |
|---|---|---|---|---|---|---|---|
| A | 60131 | 52570 | 0 | 0 | 0.00% | 0.00% |  |
| B | 60131 | 52564 | 0 | 0 | 0.00% | 0.00% |  |
| C | 60131 | 52566 | 0 | 0 | 0.00% | 0.00% |  |
| D | 60131 | 52559 | 0 | 0 | 0.00% | 0.00% |  |
Top three noisy pixels from each quadrant. If the there are fewer than three noisy pixels in the level2.evt file, extra rows are filled as -1
| Pixel properties | Quadrant properties | ||||||
|---|---|---|---|---|---|---|---|
| Quadrant | DetID | PixID | Counts | Sigma | Mean | Median | Sigma |
| A | 0 | 29 | 3237 | 11.44 | 861 | 809 | 212.2 |
| A | 7 | 110 | 2577 | 8.33 | 861 | 809 | 212.2 |
| A | 9 | 19 | 2499 | 7.96 | 861 | 809 | 212.2 |
| B | 2 | 9 | 2493 | 10.47 | 822 | 786 | 163.0 |
| B | 3 | 80 | 2129 | 8.24 | 822 | 786 | 163.0 |
| B | 5 | 255 | 2085 | 7.97 | 822 | 786 | 163.0 |
| C | 12 | 241 | 2245 | 6.8 | 848 | 796 | 213.0 |
| C | 3 | 126 | 2205 | 6.62 | 848 | 796 | 213.0 |
| C | 3 | 187 | 2131 | 6.27 | 848 | 796 | 213.0 |
| D | 15 | 46 | 2048 | 6.26 | 796 | 726 | 211.3 |
| D | 3 | 14 | 1951 | 5.8 | 796 | 726 | 211.3 |
| D | 10 | 189 | 1949 | 5.79 | 796 | 726 | 211.3 |
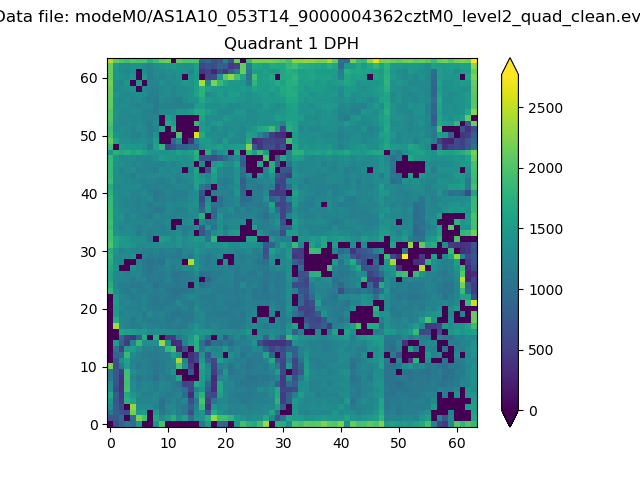
Histogram calculated using DETX and DETY for each event in the final _common_clean file
| Quadrant A |  |
 |
Quadrant B |
|---|---|---|---|
| Quadrant D |  |
 |
Quadrant C |
| Plot type | Count rate plots | Images |
|---|---|---|
| Comparison with Poisson distribution Blue bars denote a histogram of data divided into 1 sec bins. Red curve is a Poisson curve with rate = median count rate of data. |
 |
 |
| Quadrant-wise count rates Data is divided into 100 sec bins |
 |
|
| Module-wise count rates for Quadrant A Data is divided into 100 sec bins |
 |
 |
| Module-wise count rates for Quadrant B Data is divided into 100 sec bins |
 |
 |
| Module-wise count rates for Quadrant C Data is divided into 100 sec bins |
 |
 |
| Module-wise count rates for Quadrant D Data is divided into 100 sec bins |
 |
 |
| Parameter | Plot |
|---|---|
| CZT HV Monitor |  |
| D_VDD | 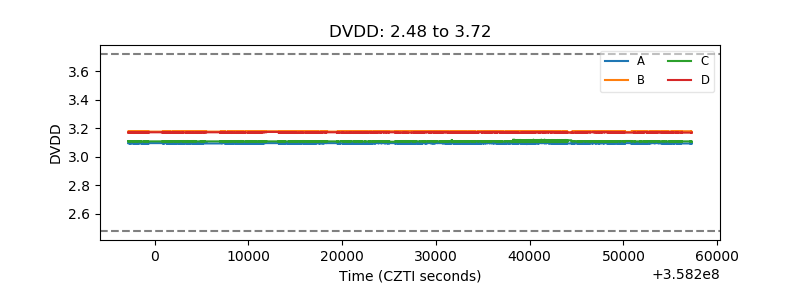 |
| Temperature 1 |  |
| Veto HV Monitor |  |
| Veto LLD |  |
| Alpha Counter |  |
| _CPM_Rate |  |
| CZT Counter |  |
| +2.5 Volts monitor |  |
| +5 Volts monitor |  |
| _ROLL_ROT |  |
| _Roll_DEC |  |
| _Roll_RA |  |
| Veto Counter |  |