| Param | Original file | Final file |
|---|---|---|
| Filename | modeM0/AS1A10_053T14_9000004362_30340cztM0_level2.evt | modeM0/AS1A10_053T14_9000004362_30340cztM0_level2_quad_clean.evt |
| Size (bytes) | 590,028,480 | 88,254,720 |
| Size | 562.7 MB | 84.2 MB |
| Events in quadrant A | 3,795,768 | 573,991 |
| Events in quadrant B | 5,006,432 | 581,160 |
| Events in quadrant C | 3,550,557 | 552,609 |
| Events in quadrant D | 5,113,578 | 548,865 |
| Mode SS | |||
|---|---|---|---|
| Quadrant | BADHDUFLAG | Total packets | Discarded packets |
| A | 0 | 120 | 0 |
| B | 0 | 120 | 0 |
| C | 0 | 120 | 0 |
| D | 0 | 120 | 0 |
| Mode M9 | |||
|---|---|---|---|
| Quadrant | BADHDUFLAG | Total packets | Discarded packets |
| A | 0 | 14 | 0 |
| B | 0 | 14 | 0 |
| C | 0 | 14 | 0 |
| D | 0 | 14 | 0 |
| Mode M0 | |||
|---|---|---|---|
| Quadrant | BADHDUFLAG | Total packets | Discarded packets |
| A | 0 | 15778 | 0 |
| B | 0 | 18356 | 0 |
| C | 0 | 14368 | 0 |
| D | 0 | 18925 | 0 |
| Quadrant | Total seconds | Saturated seconds | Saturation percentage |
|---|---|---|---|
| A | 5959 | 44 | 0.738379% |
| B | 5959 | 98 | 1.644571% |
| C | 5959 | 95 | 1.594227% |
| D | 5960 | 868 | 14.563758% |
Noise dominated data is calculated using 1-second bins in cleaned event files. If a bin has >2000 counts, and if more than 50% of those come from <1% of pixels, then it is considered to be noise-dominated and hence unusable.
| Quadrant | # 1 sec bins | Bins with >0 counts | Bins with >2000 counts | High rate bins dominated by noise | Noise dominated (total time) | Noise dominated (detector-on time) | Marked lightcurve |
|---|---|---|---|---|---|---|---|
| A | 7344 | 5960 | 0 | 0 | 0.00% | 0.00% | 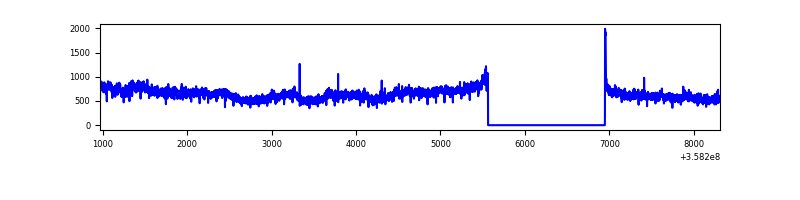 |
| B | 7344 | 5960 | 6 | 6 | 0.08% | 0.10% | 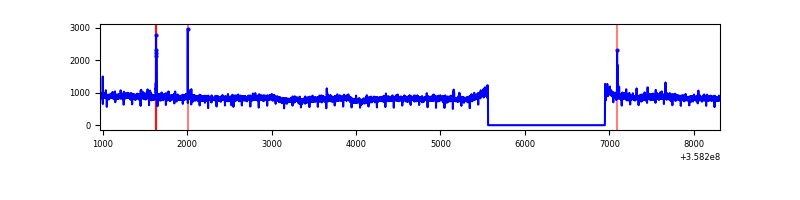 |
| C | 7344 | 5960 | 2 | 2 | 0.03% | 0.03% | 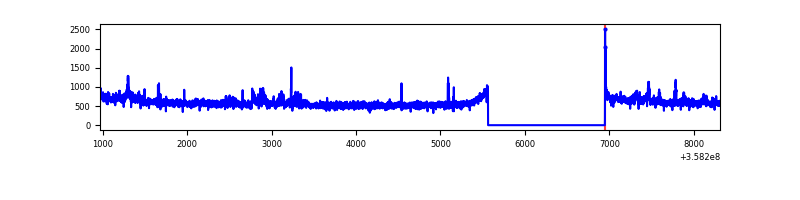 |
| D | 7345 | 5961 | 789 | 789 | 10.74% | 13.24% | 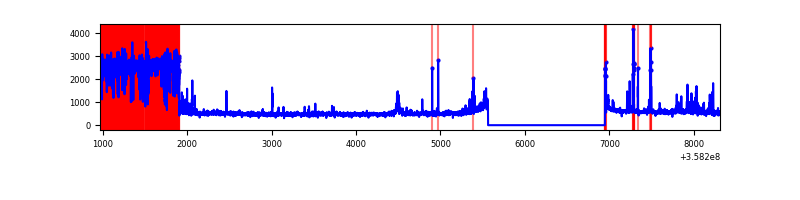 |
Top three noisy pixels from each quadrant. If the there are fewer than three noisy pixels in the level2.evt file, extra rows are filled as -1
| Pixel properties | Quadrant properties | ||||||
|---|---|---|---|---|---|---|---|
| Quadrant | DetID | PixID | Counts | Sigma | Mean | Median | Sigma |
| A | 5 | 203 | 555003 | 3331.66 | 836 | 823 | 166.3 |
| A | 8 | 192 | 13038 | 73.43 | 836 | 823 | 166.3 |
| A | 13 | 254 | 11361 | 63.35 | 836 | 823 | 166.3 |
| B | 6 | 159 | 1722793 | 11192.36 | 830 | 814 | 153.9 |
| B | 0 | 190 | 22038 | 137.95 | 830 | 814 | 153.9 |
| B | 12 | 111 | 18020 | 111.83 | 830 | 814 | 153.9 |
| C | 3 | 233 | 256609 | 1398.73 | 801 | 810 | 182.9 |
| C | 14 | 238 | 141939 | 771.71 | 801 | 810 | 182.9 |
| C | 2 | 114 | 14017 | 72.22 | 801 | 810 | 182.9 |
| D | 13 | 104 | 1877213 | 10749.72 | 738 | 722 | 174.6 |
| D | 2 | 250 | 152598 | 870.04 | 738 | 722 | 174.6 |
| D | 13 | 249 | 145138 | 827.31 | 738 | 722 | 174.6 |
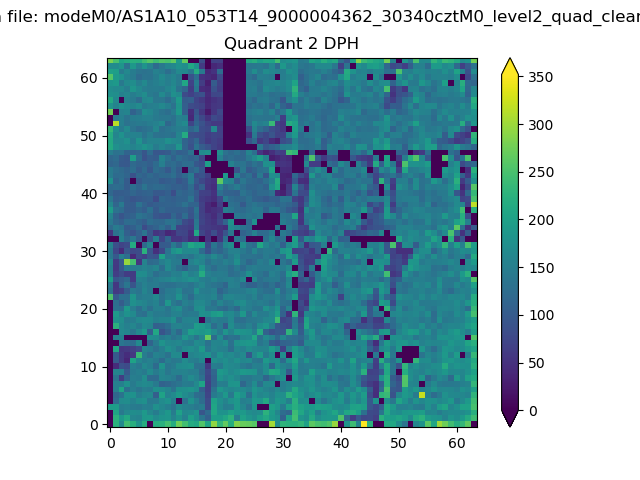
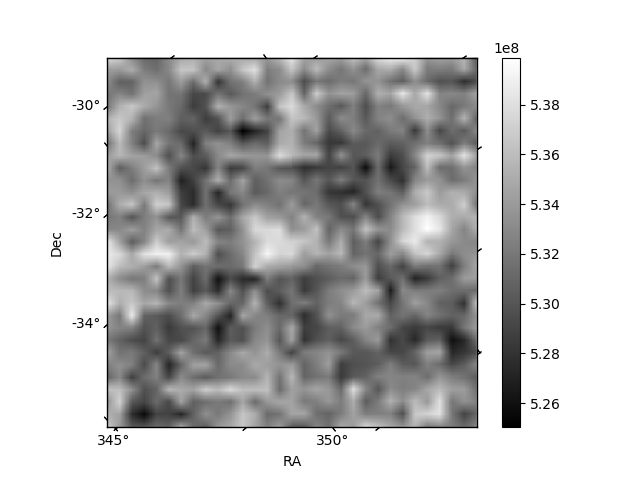
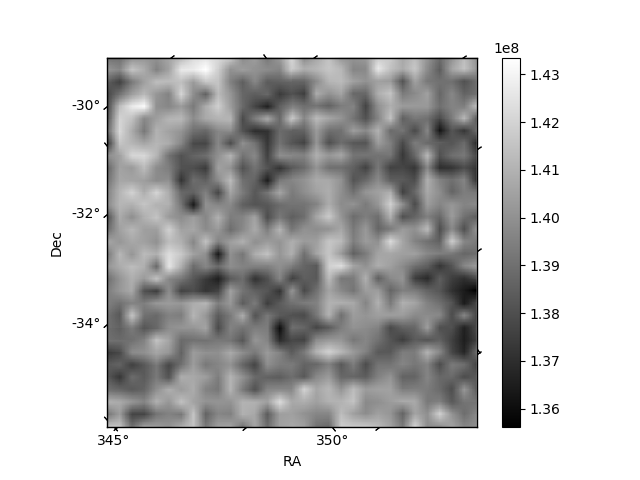
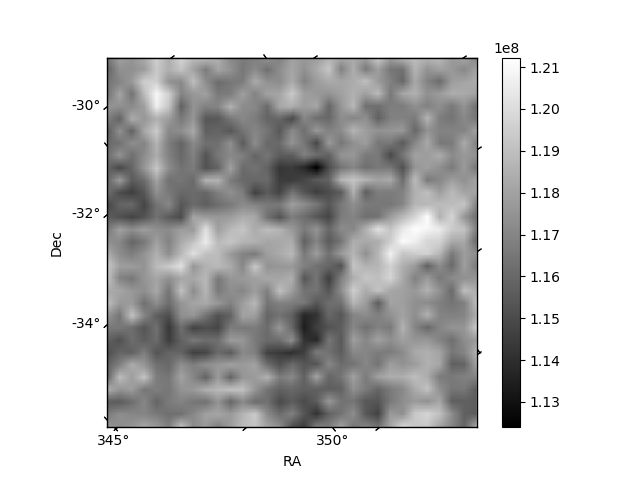
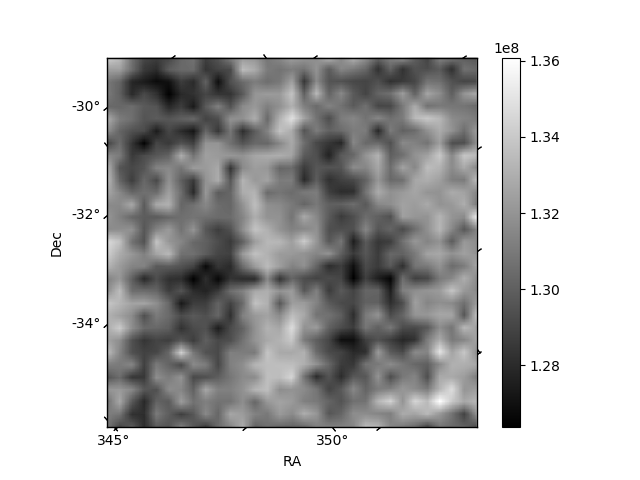
Histogram calculated using DETX and DETY for each event in the final _common_clean file
| Quadrant A | 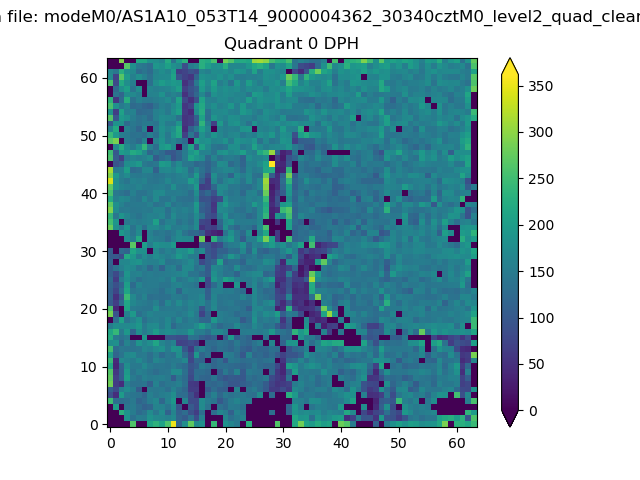 |
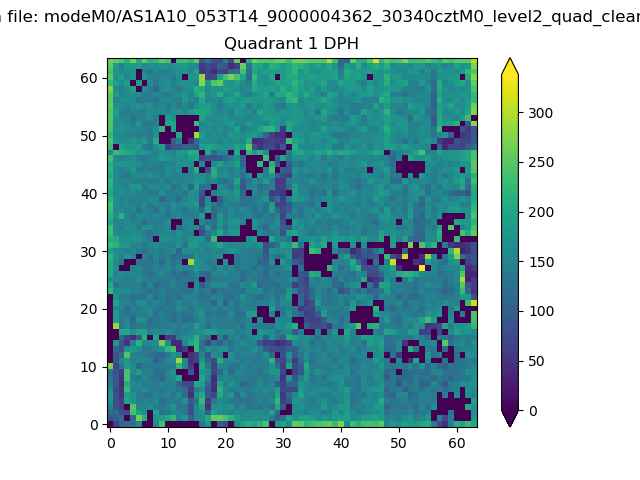 |
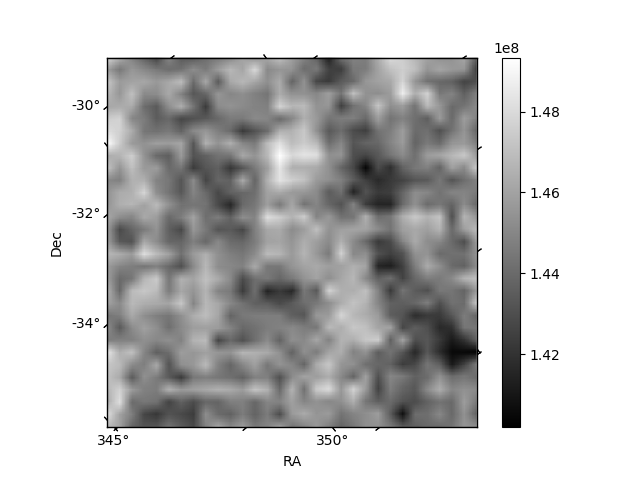
Quadrant B |
|---|---|---|---|
| Quadrant D | 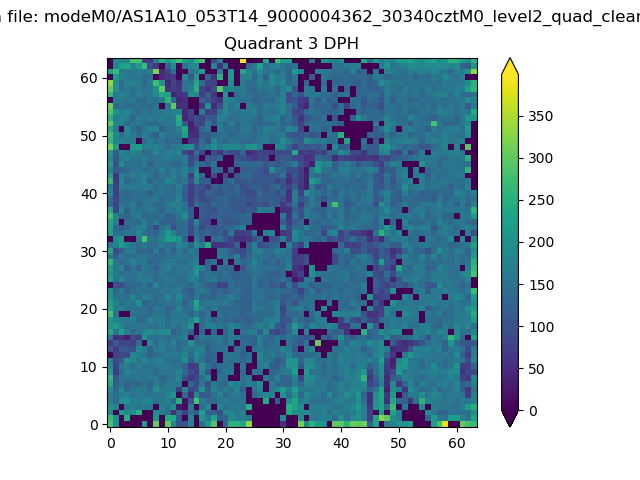 |
 |
Quadrant C |
| Plot type | Count rate plots | Images |
|---|---|---|
| Comparison with Poisson distribution Blue bars denote a histogram of data divided into 1 sec bins. Red curve is a Poisson curve with rate = median count rate of data. |
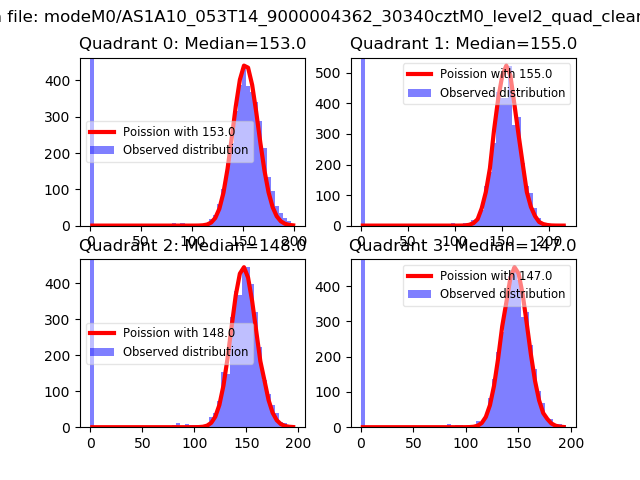 |
 |
| Quadrant-wise count rates Data is divided into 100 sec bins |
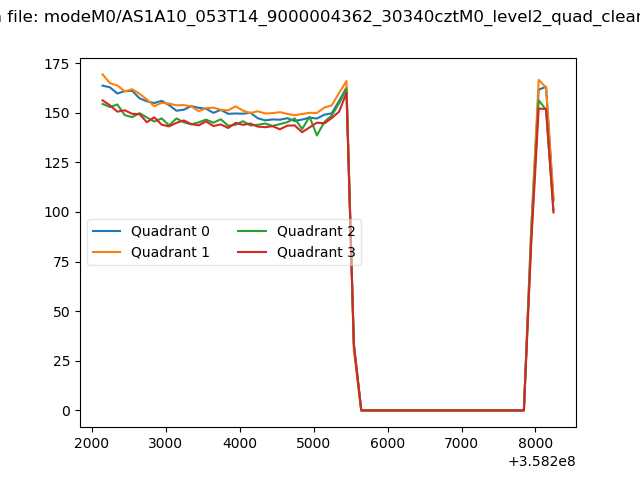 |
|
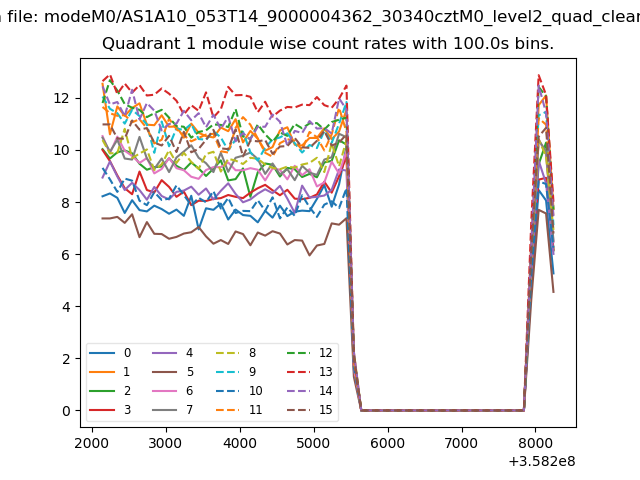
| Module-wise count rates for Quadrant A Data is divided into 100 sec bins |
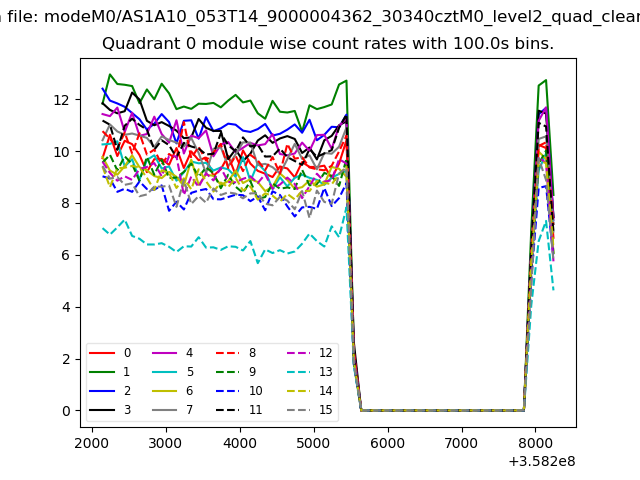 |
 |
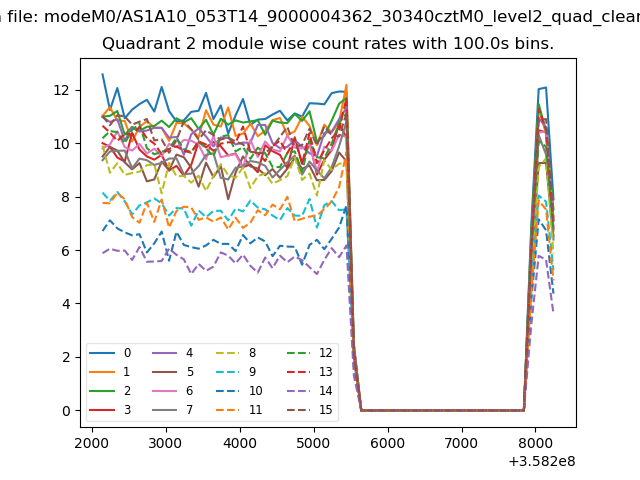
| Module-wise count rates for Quadrant B Data is divided into 100 sec bins |
 |
 |
| Module-wise count rates for Quadrant C Data is divided into 100 sec bins |
 |
 |
| Module-wise count rates for Quadrant D Data is divided into 100 sec bins |
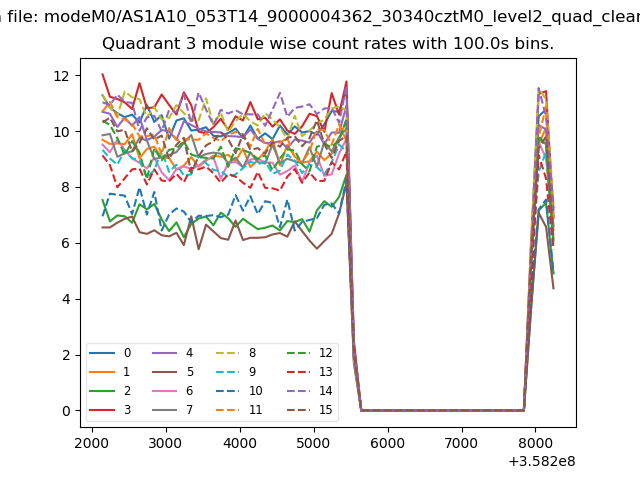 |
 |
| Parameter | Plot |
|---|---|
| CZT HV Monitor | 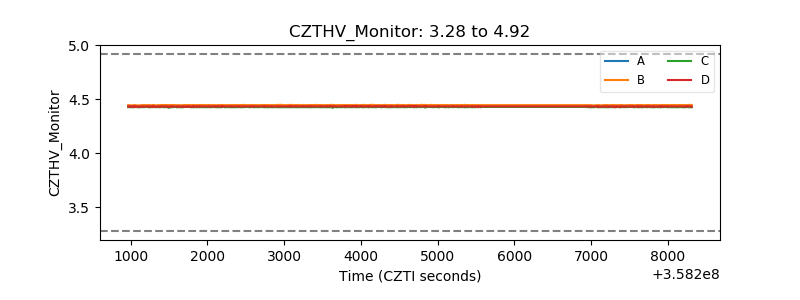 |
| D_VDD | 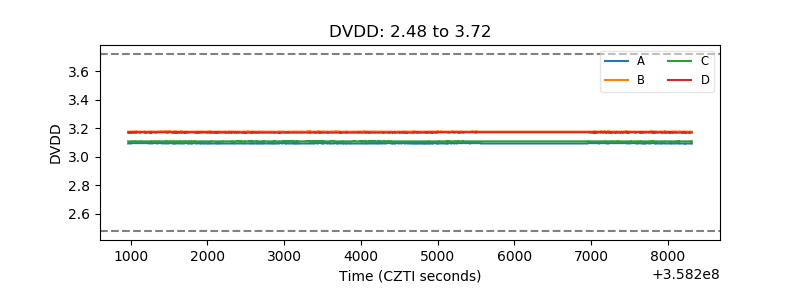 |
| Temperature 1 | 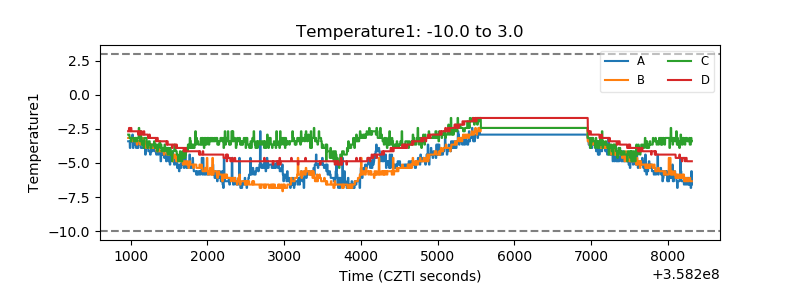 |
| Veto HV Monitor | 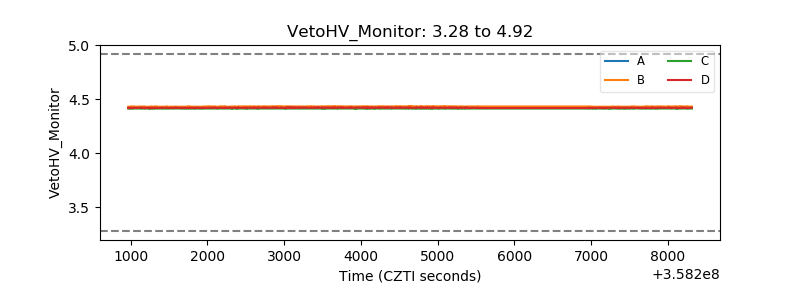 |
| Veto LLD | 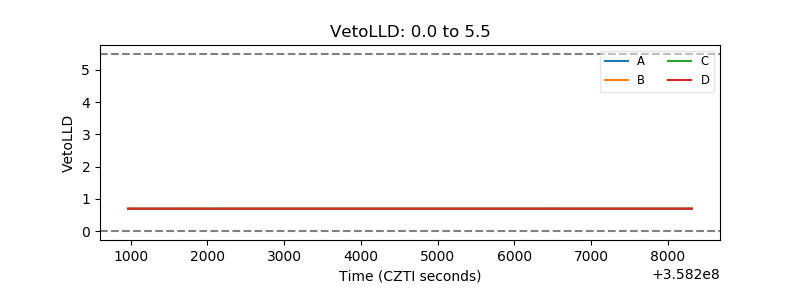 |
| Alpha Counter | 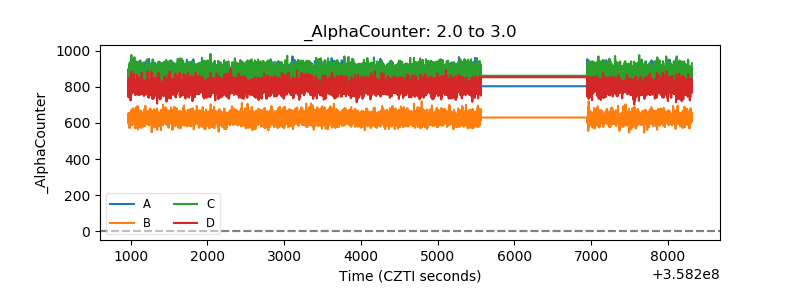 |
| _CPM_Rate | 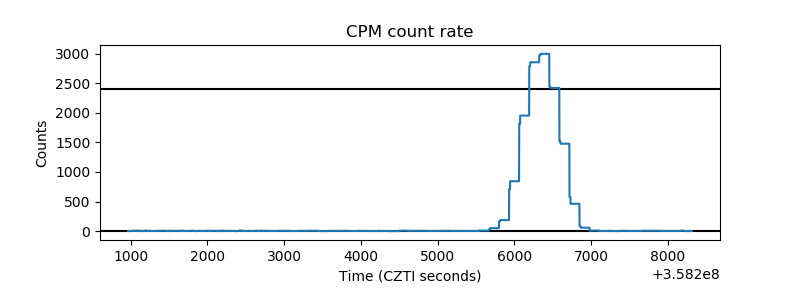 |
| CZT Counter | 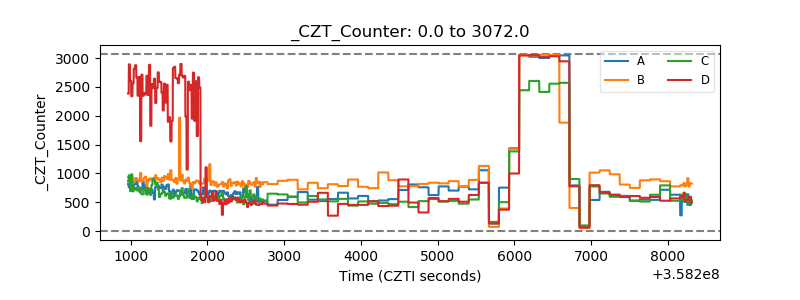 |
| +2.5 Volts monitor |  |
| +5 Volts monitor |  |
| _ROLL_ROT | 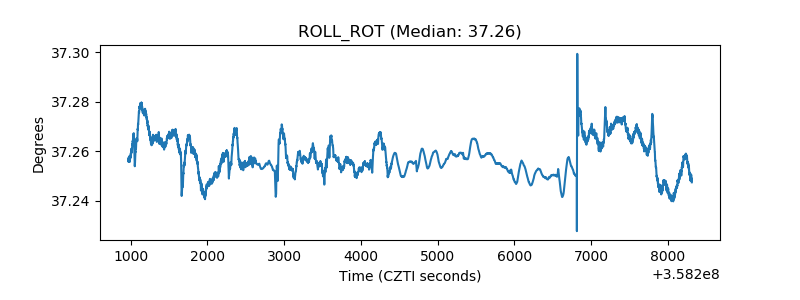 |
| _Roll_DEC | 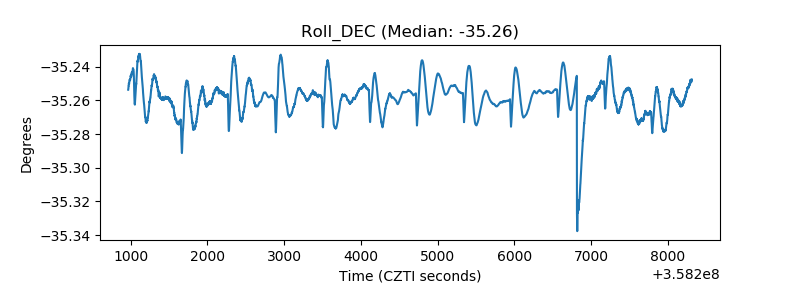 |
| _Roll_RA | 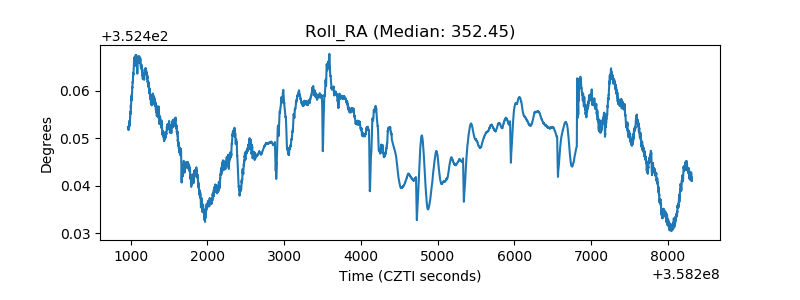 |
| Veto Counter | 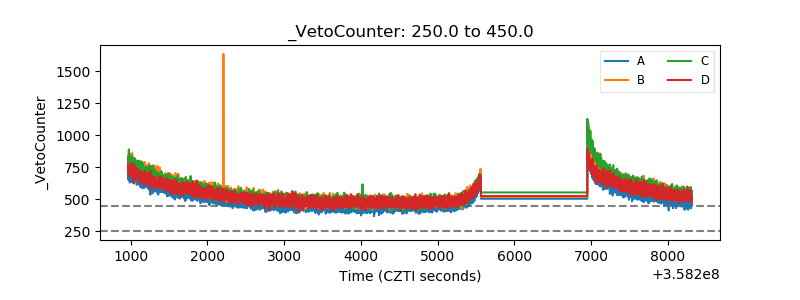 |