| Param | Original file | Final file |
|---|---|---|
| Filename | modeM0/AS1A10_053T14_9000004362_30342cztM0_level2.evt | modeM0/AS1A10_053T14_9000004362_30342cztM0_level2_quad_clean.evt |
| Size (bytes) | 585,656,640 | 103,141,440 |
| Size | 558.5 MB | 98.4 MB |
| Events in quadrant A | 3,323,630 | 684,623 |
| Events in quadrant B | 5,288,436 | 684,351 |
| Events in quadrant C | 3,622,909 | 662,560 |
| Events in quadrant D | 5,050,357 | 627,450 |
| Mode SS | |||
|---|---|---|---|
| Quadrant | BADHDUFLAG | Total packets | Discarded packets |
| A | 0 | 134 | 0 |
| B | 0 | 134 | 0 |
| C | 0 | 134 | 0 |
| D | 0 | 134 | 0 |
| Mode M9 | |||
|---|---|---|---|
| Quadrant | BADHDUFLAG | Total packets | Discarded packets |
| A | 0 | 16 | 0 |
| B | 0 | 17 | 0 |
| C | 0 | 17 | 0 |
| D | 0 | 17 | 0 |
| Mode M0 | |||
|---|---|---|---|
| Quadrant | BADHDUFLAG | Total packets | Discarded packets |
| A | 0 | 13893 | 2 |
| B | 0 | 20269 | 2 |
| C | 0 | 14630 | 2 |
| D | 0 | 19243 | 2 |
| Quadrant | Total seconds | Saturated seconds | Saturation percentage |
|---|---|---|---|
| A | 6668 | 49 | 0.734853% |
| B | 6667 | 154 | 2.309885% |
| C | 6667 | 159 | 2.384881% |
| D | 6667 | 686 | 10.289486% |
Noise dominated data is calculated using 1-second bins in cleaned event files. If a bin has >2000 counts, and if more than 50% of those come from <1% of pixels, then it is considered to be noise-dominated and hence unusable.
| Quadrant | # 1 sec bins | Bins with >0 counts | Bins with >2000 counts | High rate bins dominated by noise | Noise dominated (total time) | Noise dominated (detector-on time) | Marked lightcurve |
|---|---|---|---|---|---|---|---|
| A | 7658 | 6669 | 0 | 0 | 0.00% | 0.00% | 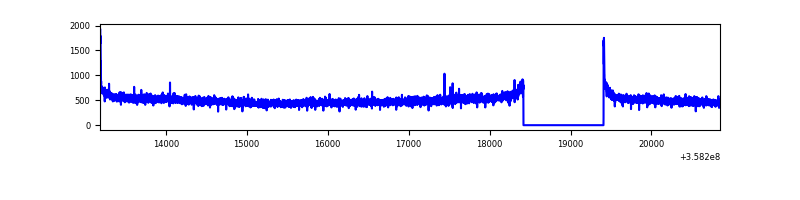 |
| B | 7657 | 6668 | 10 | 10 | 0.13% | 0.15% | 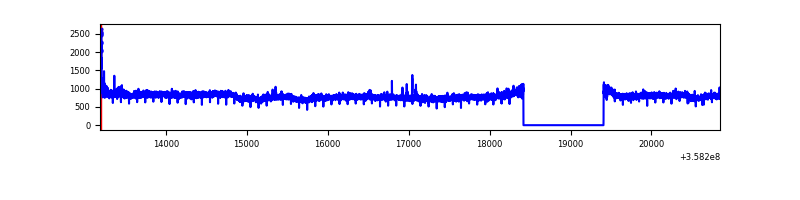 |
| C | 7657 | 6668 | 0 | 0 | 0.00% | 0.00% | 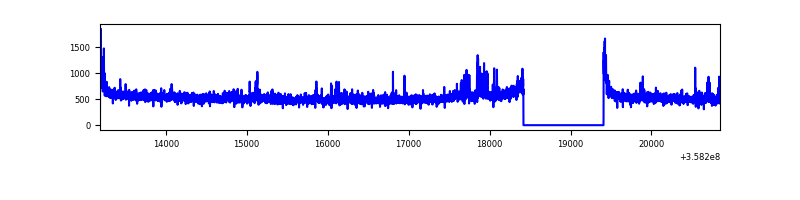 |
| D | 7657 | 6668 | 653 | 653 | 8.53% | 9.79% | 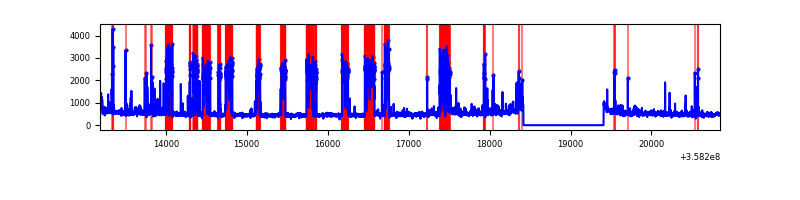 |
Top three noisy pixels from each quadrant. If the there are fewer than three noisy pixels in the level2.evt file, extra rows are filled as -1
| Pixel properties | Quadrant properties | ||||||
|---|---|---|---|---|---|---|---|
| Quadrant | DetID | PixID | Counts | Sigma | Mean | Median | Sigma |
| A | 8 | 192 | 22153 | 124.97 | 856 | 841 | 170.5 |
| A | 13 | 254 | 12280 | 67.07 | 856 | 841 | 170.5 |
| A | 3 | 137 | 8361 | 44.1 | 856 | 841 | 170.5 |
| B | 6 | 159 | 1909618 | 11931.77 | 847 | 826 | 160.0 |
| B | 5 | 172 | 26798 | 162.35 | 847 | 826 | 160.0 |
| B | 12 | 111 | 19402 | 116.12 | 847 | 826 | 160.0 |
| C | 3 | 233 | 200139 | 1022.4 | 831 | 837 | 194.9 |
| C | 14 | 238 | 146717 | 748.35 | 831 | 837 | 194.9 |
| C | 14 | 254 | 18071 | 88.41 | 831 | 837 | 194.9 |
| D | 1 | 52 | 1395364 | 7257.97 | 816 | 797 | 192.1 |
| D | 12 | 233 | 211876 | 1098.55 | 816 | 797 | 192.1 |
| D | 2 | 250 | 154051 | 797.6 | 816 | 797 | 192.1 |
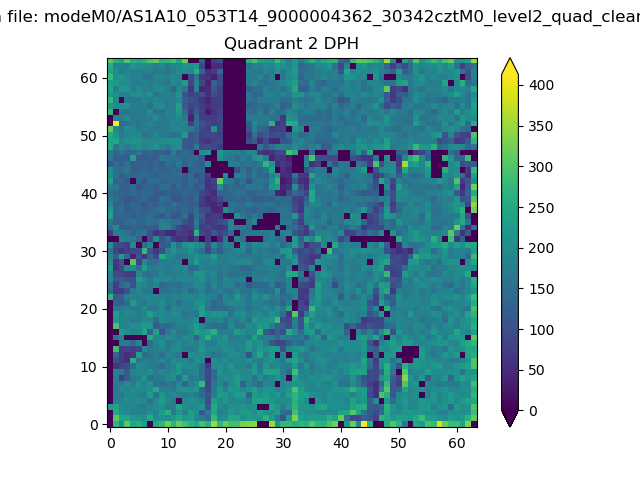
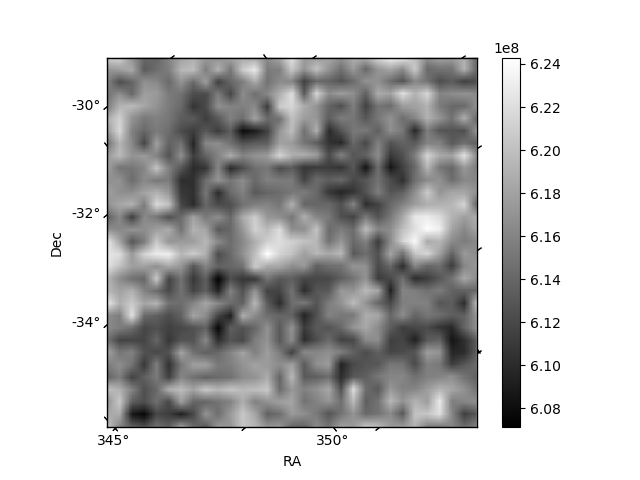
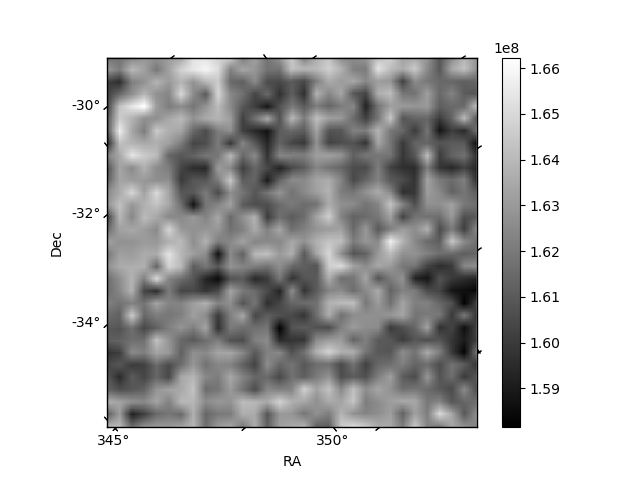
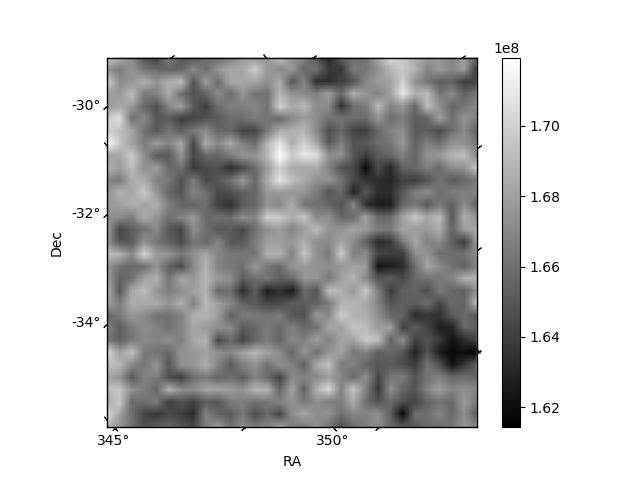
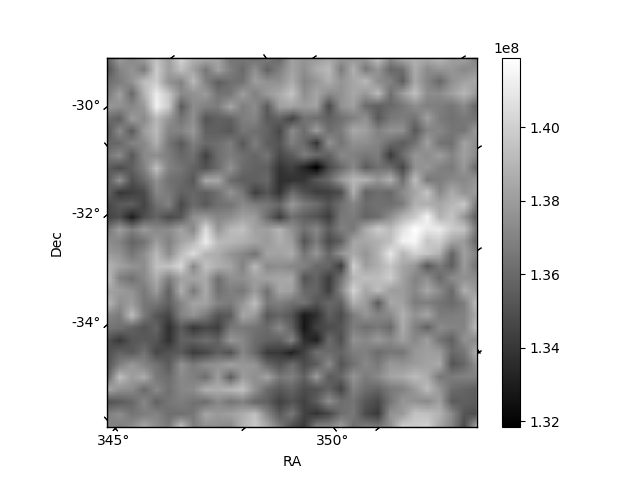
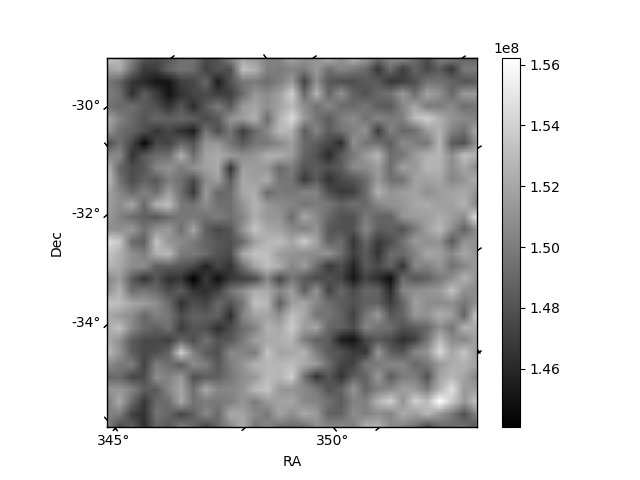
Histogram calculated using DETX and DETY for each event in the final _common_clean file
| Quadrant A | 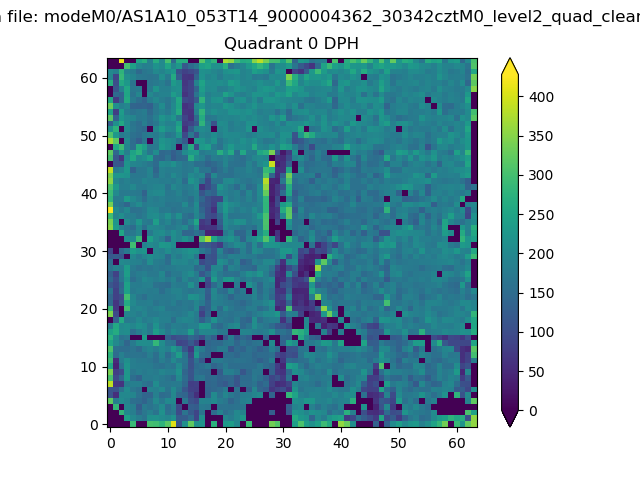 |
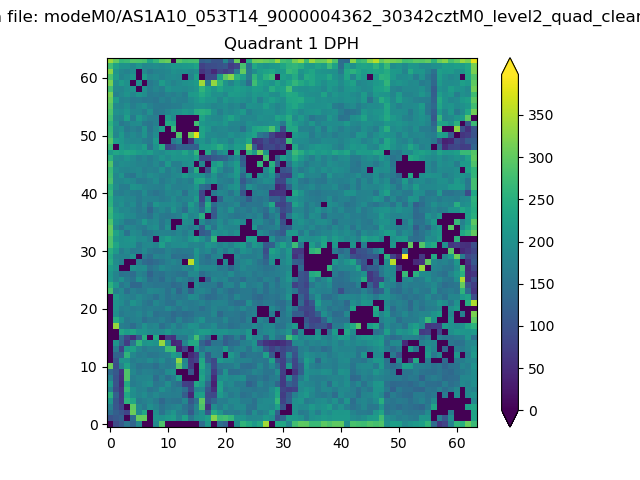 |
Quadrant B |
|---|---|---|---|
| Quadrant D | 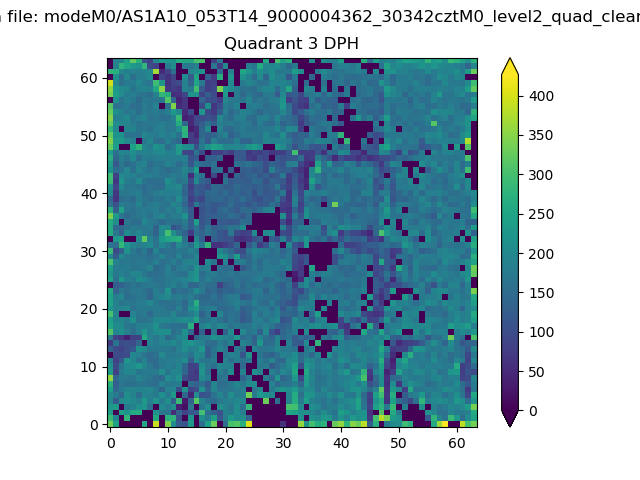 |
 |
Quadrant C |
| Plot type | Count rate plots | Images |
|---|---|---|
| Comparison with Poisson distribution Blue bars denote a histogram of data divided into 1 sec bins. Red curve is a Poisson curve with rate = median count rate of data. |
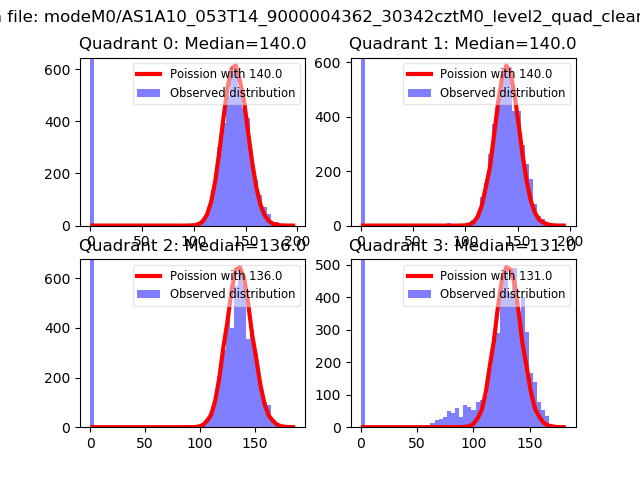 |
 |
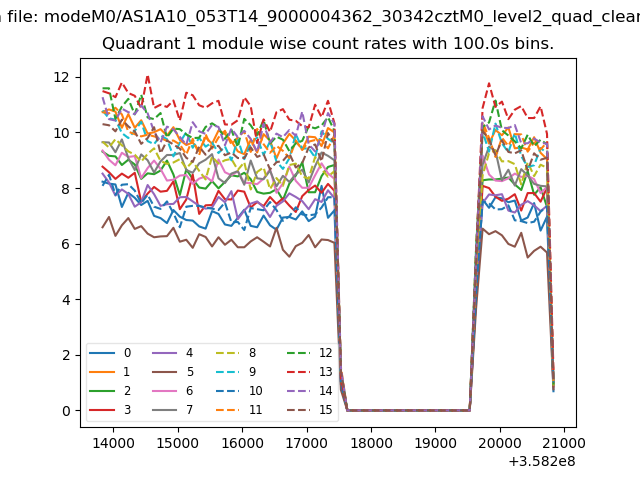
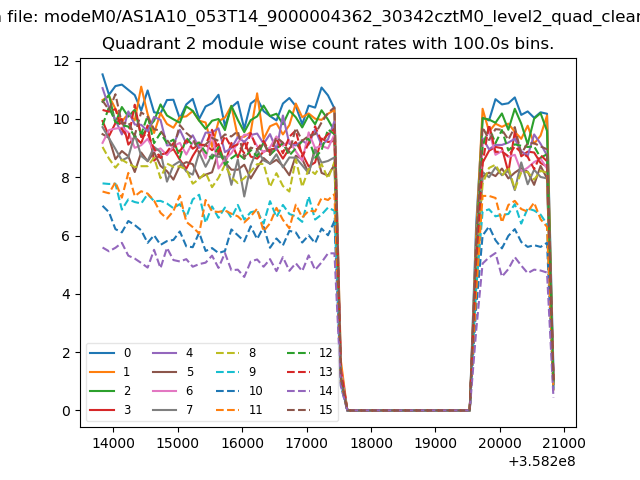
| Quadrant-wise count rates Data is divided into 100 sec bins |
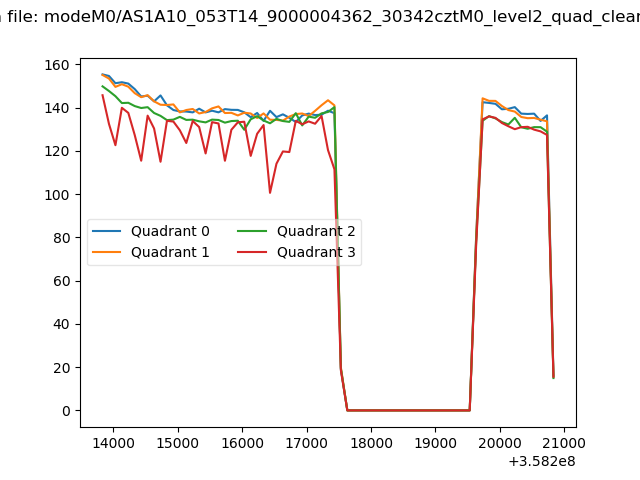 |
|
| Module-wise count rates for Quadrant A Data is divided into 100 sec bins |
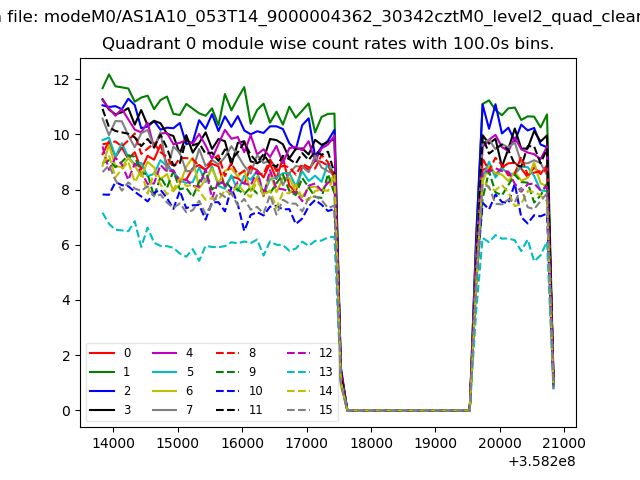 |
 |
| Module-wise count rates for Quadrant B Data is divided into 100 sec bins |
 |
 |
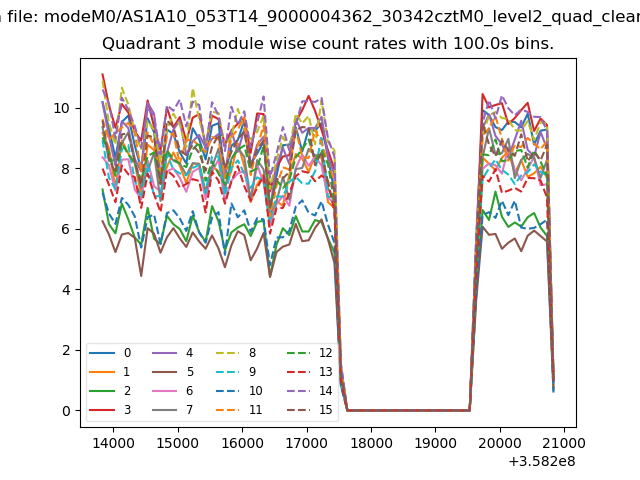
| Module-wise count rates for Quadrant C Data is divided into 100 sec bins |
 |
 |
| Module-wise count rates for Quadrant D Data is divided into 100 sec bins |
 |
 |
| Parameter | Plot |
|---|---|
| CZT HV Monitor | 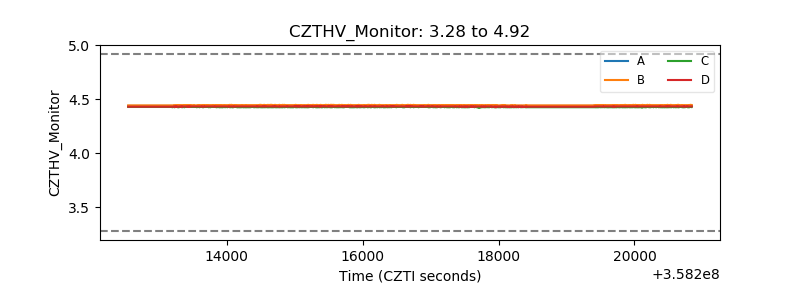 |
| D_VDD |  |
| Temperature 1 | 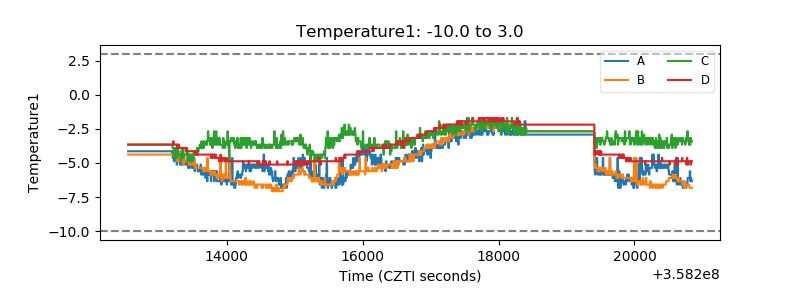 |
| Veto HV Monitor | 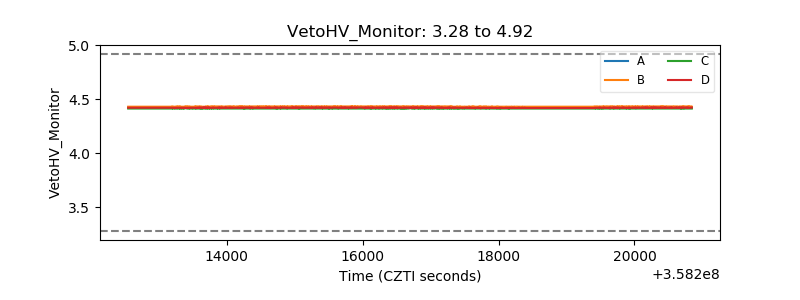 |
| Veto LLD | 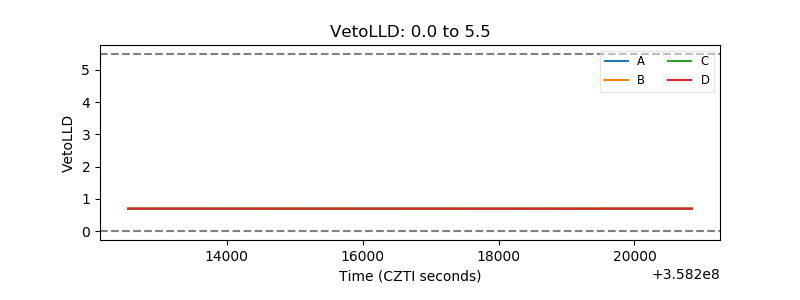 |
| Alpha Counter | 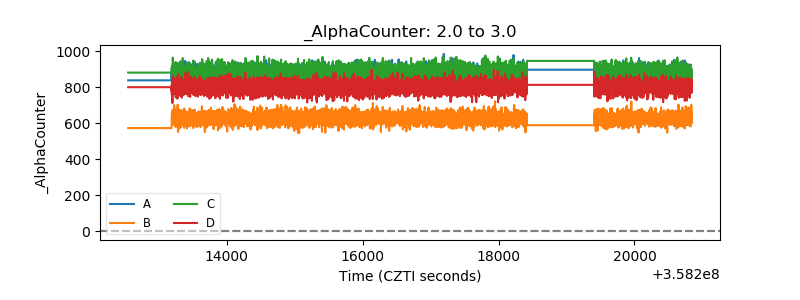 |
| _CPM_Rate | 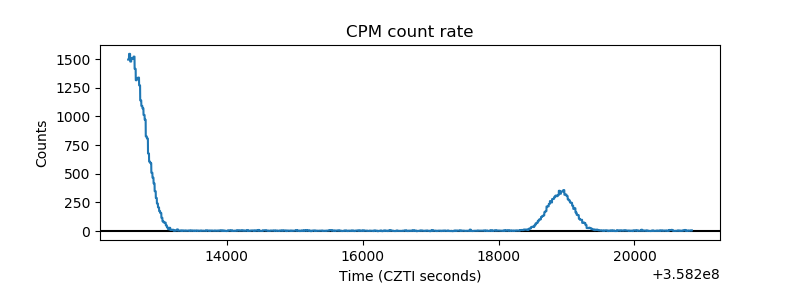 |
| CZT Counter | 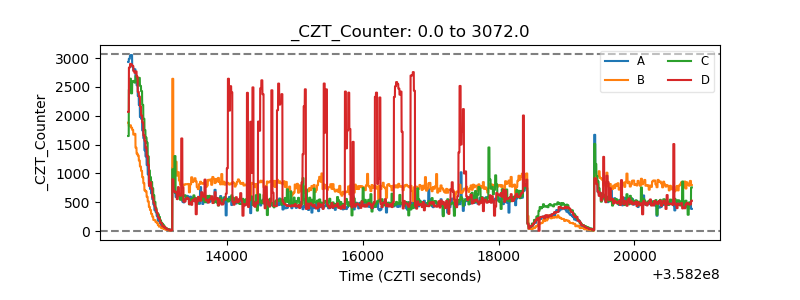 |
| +2.5 Volts monitor |  |
| +5 Volts monitor |  |
| _ROLL_ROT | 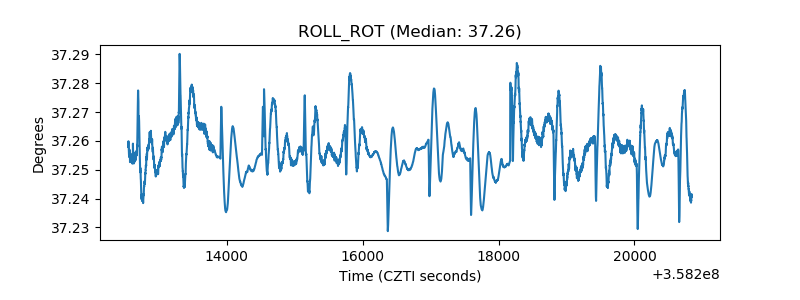 |
| _Roll_DEC | 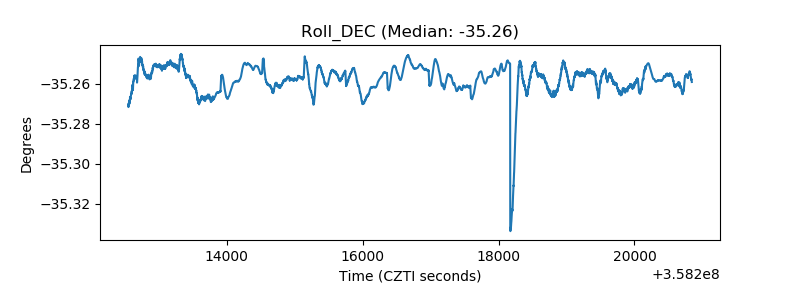 |
| _Roll_RA | 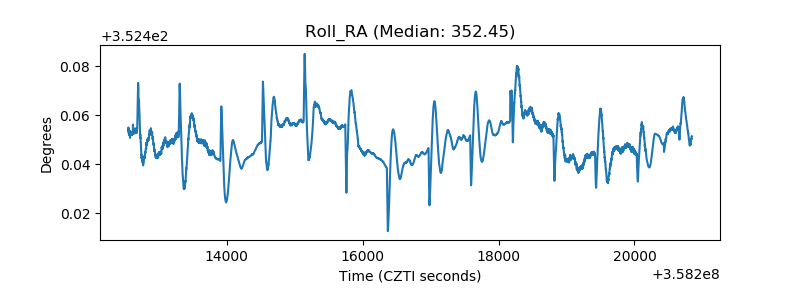 |
| Veto Counter | 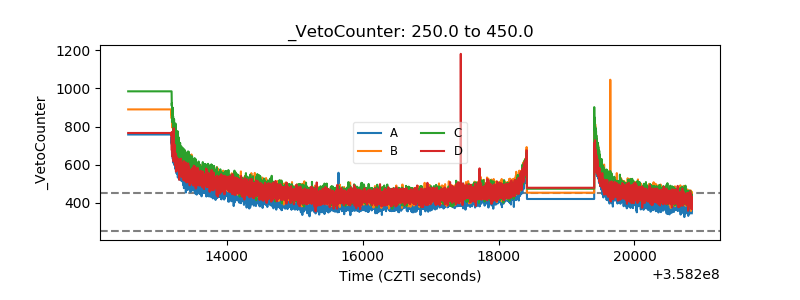 |