| Param | Original file | Final file |
|---|---|---|
| Filename | modeM0/AS1A10_053T14_9000004362_30344cztM0_level2.evt | modeM0/AS1A10_053T14_9000004362_30344cztM0_level2_quad_clean.evt |
| Size (bytes) | 602,861,760 | 111,942,720 |
| Size | 574.9 MB | 106.8 MB |
| Events in quadrant A | 3,745,885 | 725,787 |
| Events in quadrant B | 5,965,974 | 723,866 |
| Events in quadrant C | 4,024,462 | 704,945 |
| Events in quadrant D | 4,000,447 | 700,729 |
| Mode SS | |||
|---|---|---|---|
| Quadrant | BADHDUFLAG | Total packets | Discarded packets |
| A | 0 | 154 | 0 |
| B | 0 | 154 | 0 |
| C | 0 | 154 | 0 |
| D | 0 | 154 | 0 |
| Mode M0 | |||
|---|---|---|---|
| Quadrant | BADHDUFLAG | Total packets | Discarded packets |
| A | 0 | 16049 | 2 |
| B | 0 | 23463 | 2 |
| C | 0 | 16638 | 2 |
| D | 0 | 16917 | 2 |
| Quadrant | Total seconds | Saturated seconds | Saturation percentage |
|---|---|---|---|
| A | 7683 | 171 | 2.225693% |
| B | 7684 | 349 | 4.541905% |
| C | 7684 | 374 | 4.867257% |
| D | 7684 | 224 | 2.915148% |
Noise dominated data is calculated using 1-second bins in cleaned event files. If a bin has >2000 counts, and if more than 50% of those come from <1% of pixels, then it is considered to be noise-dominated and hence unusable.
| Quadrant | # 1 sec bins | Bins with >0 counts | Bins with >2000 counts | High rate bins dominated by noise | Noise dominated (total time) | Noise dominated (detector-on time) | Marked lightcurve |
|---|---|---|---|---|---|---|---|
| A | 7733 | 7685 | 0 | 0 | 0.00% | 0.00% | 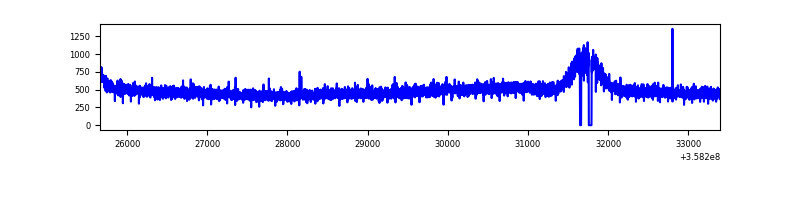 |
| B | 7734 | 7685 | 0 | 0 | 0.00% | 0.00% | 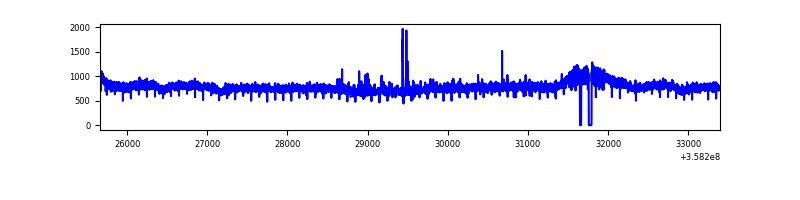 |
| C | 7734 | 7685 | 0 | 0 | 0.00% | 0.00% | 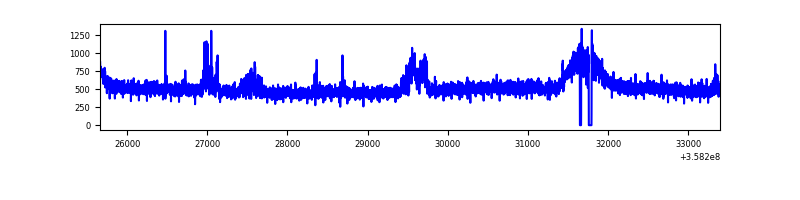 |
| D | 7734 | 7686 | 38 | 38 | 0.49% | 0.49% | 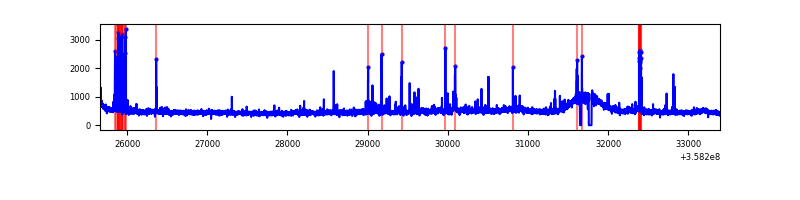 |
Top three noisy pixels from each quadrant. If the there are fewer than three noisy pixels in the level2.evt file, extra rows are filled as -1
| Pixel properties | Quadrant properties | ||||||
|---|---|---|---|---|---|---|---|
| Quadrant | DetID | PixID | Counts | Sigma | Mean | Median | Sigma |
| A | 13 | 254 | 15781 | 75.54 | 969 | 944 | 196.4 |
| A | 3 | 137 | 10219 | 47.22 | 969 | 944 | 196.4 |
| A | 0 | 226 | 8167 | 36.77 | 969 | 944 | 196.4 |
| B | 6 | 159 | 2191725 | 11895.22 | 950 | 922 | 184.2 |
| B | 3 | 209 | 24211 | 126.45 | 950 | 922 | 184.2 |
| B | 12 | 111 | 23508 | 122.63 | 950 | 922 | 184.2 |
| C | 14 | 238 | 184760 | 832.94 | 935 | 940 | 220.7 |
| C | 3 | 233 | 139721 | 628.85 | 935 | 940 | 220.7 |
| C | 14 | 254 | 41983 | 185.98 | 935 | 940 | 220.7 |
| D | 2 | 250 | 157639 | 686.09 | 948 | 926 | 228.4 |
| D | 8 | 195 | 151768 | 660.38 | 948 | 926 | 228.4 |
| D | 13 | 104 | 47795 | 205.19 | 948 | 926 | 228.4 |
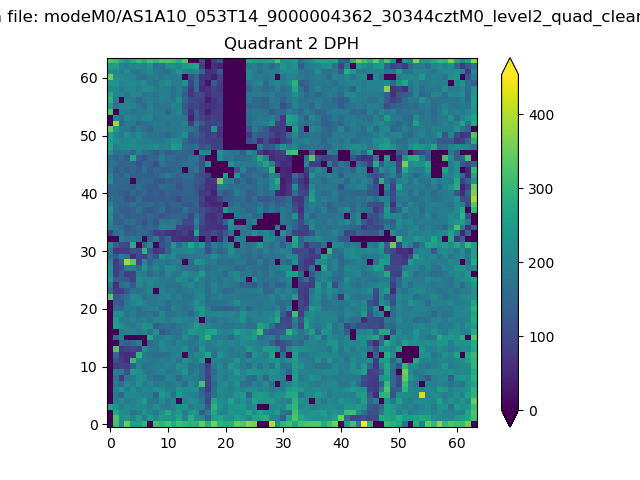
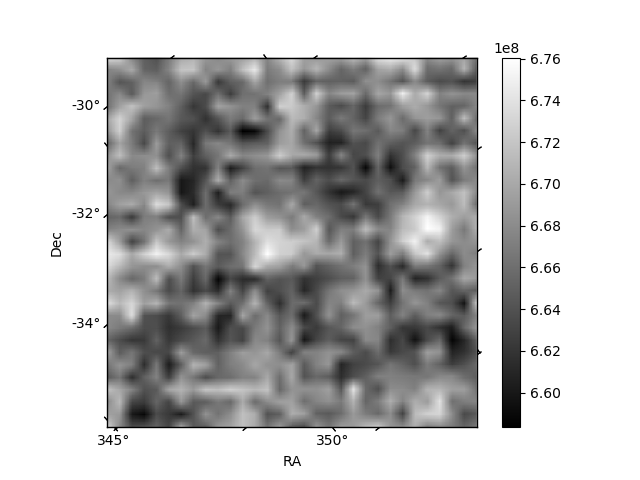
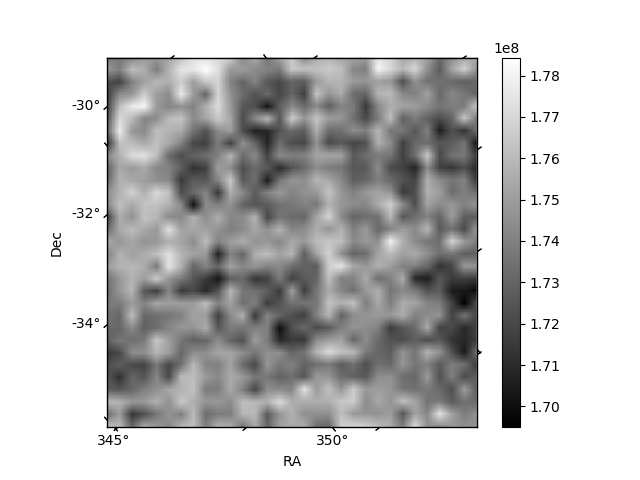
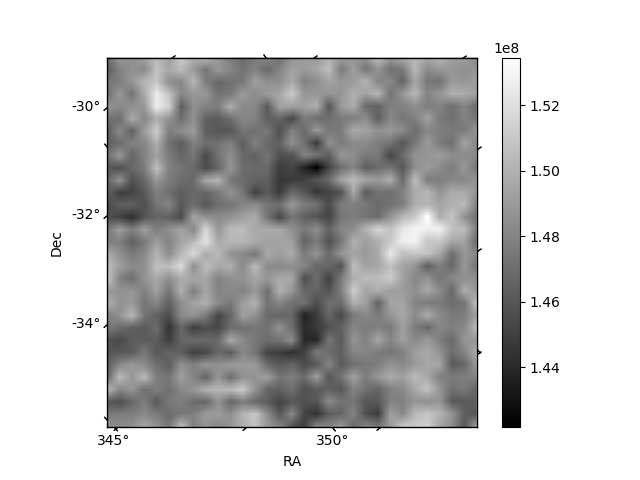
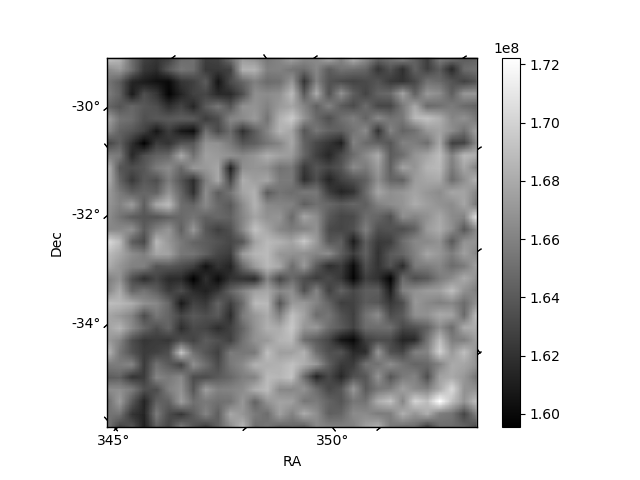
Histogram calculated using DETX and DETY for each event in the final _common_clean file
| Quadrant A | 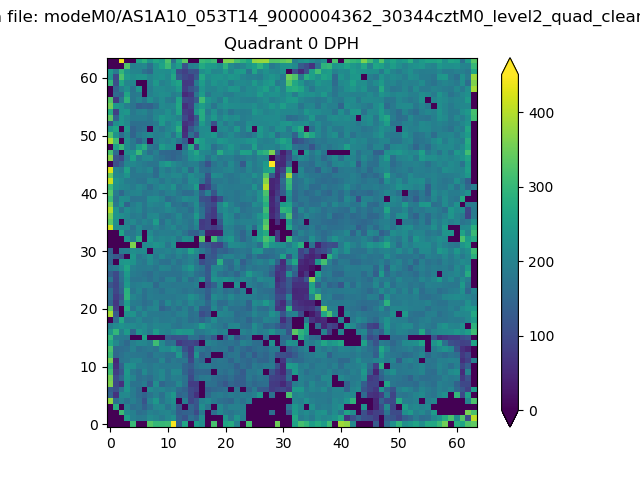 |
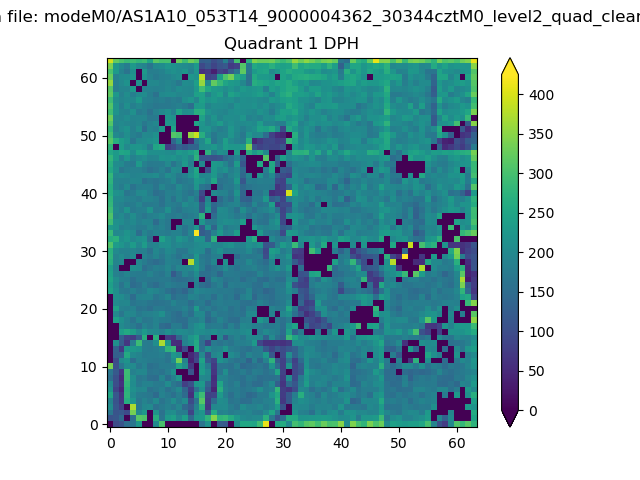 |
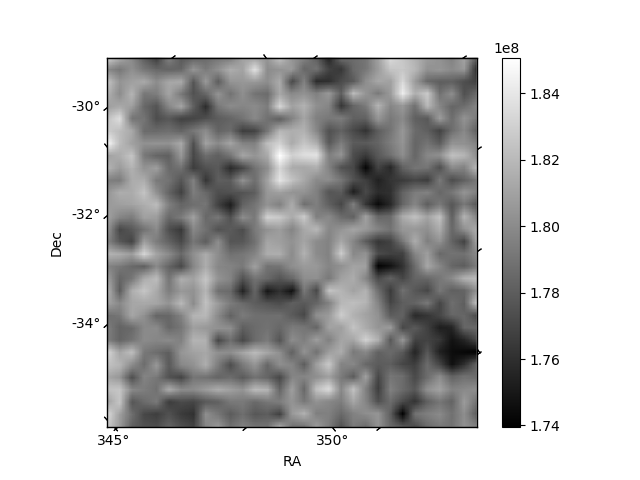
Quadrant B |
|---|---|---|---|
| Quadrant D | 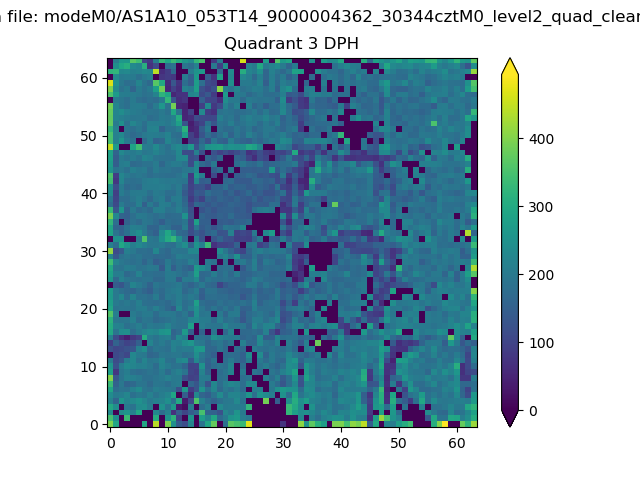 |
 |
Quadrant C |
| Plot type | Count rate plots | Images |
|---|---|---|
| Comparison with Poisson distribution Blue bars denote a histogram of data divided into 1 sec bins. Red curve is a Poisson curve with rate = median count rate of data. |
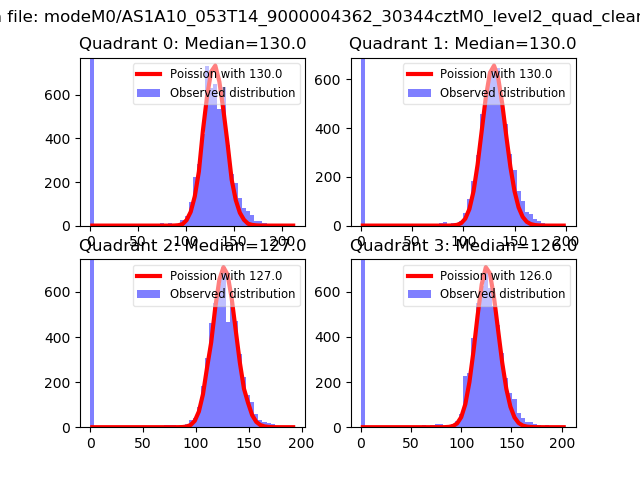 |
 |
| Quadrant-wise count rates Data is divided into 100 sec bins |
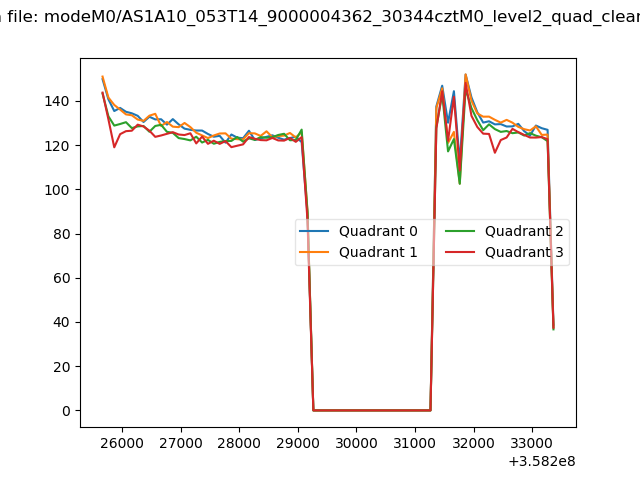 |
|
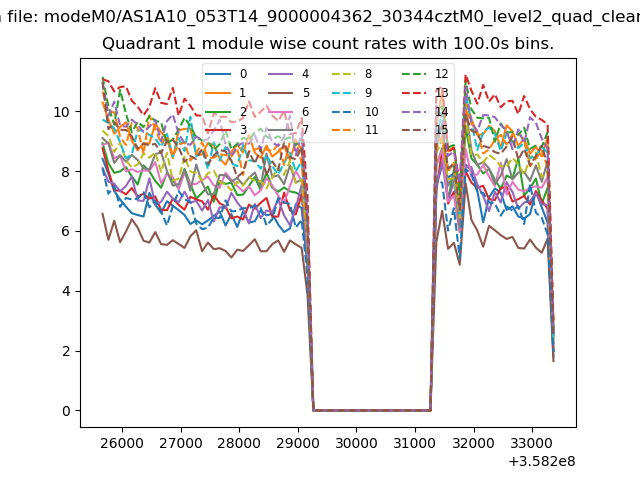
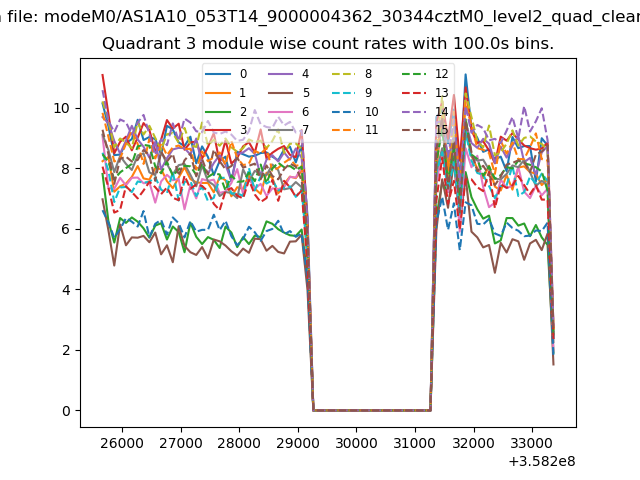
| Module-wise count rates for Quadrant A Data is divided into 100 sec bins |
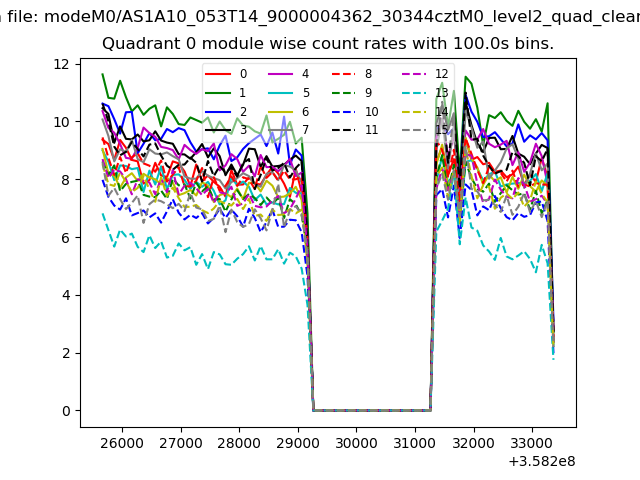 |
 |
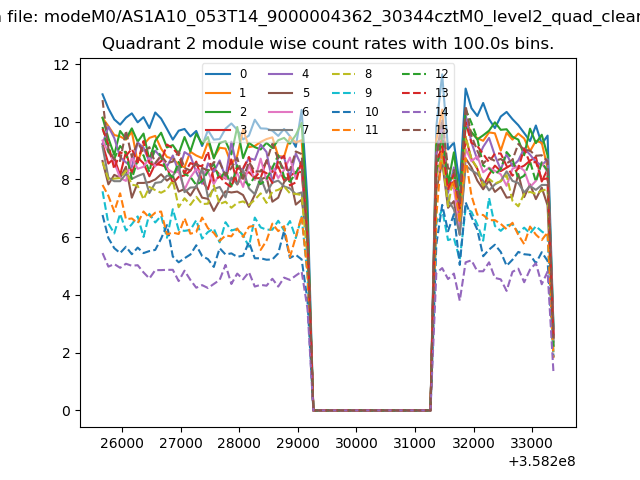
| Module-wise count rates for Quadrant B Data is divided into 100 sec bins |
 |
 |
| Module-wise count rates for Quadrant C Data is divided into 100 sec bins |
 |
 |
| Module-wise count rates for Quadrant D Data is divided into 100 sec bins |
 |
 |
| Parameter | Plot |
|---|---|
| CZT HV Monitor |  |
| D_VDD | 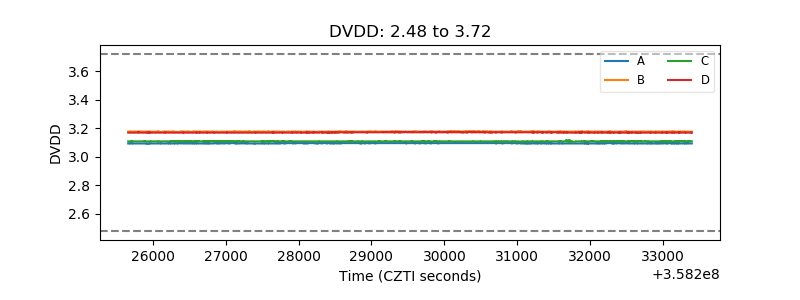 |
| Temperature 1 | 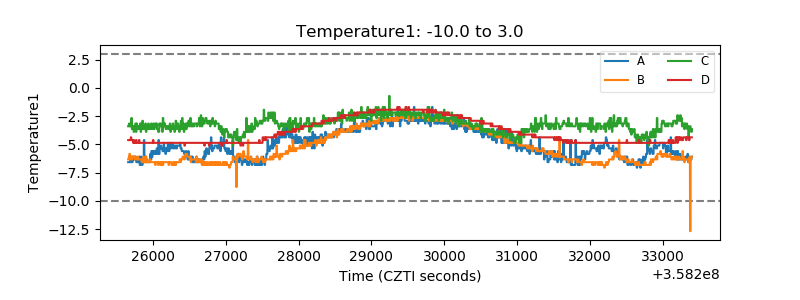 |
| Veto HV Monitor | 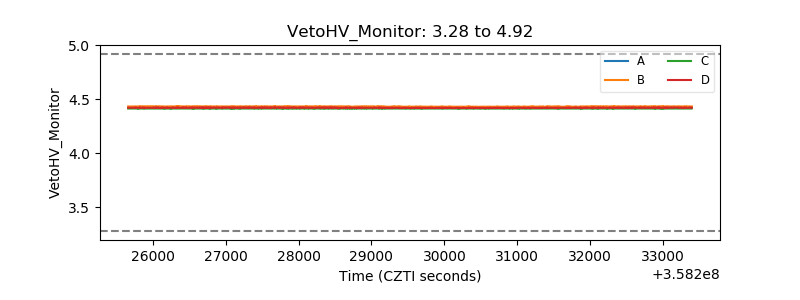 |
| Veto LLD | 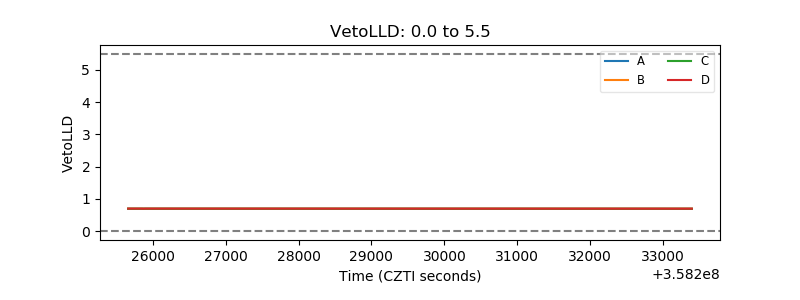 |
| Alpha Counter | 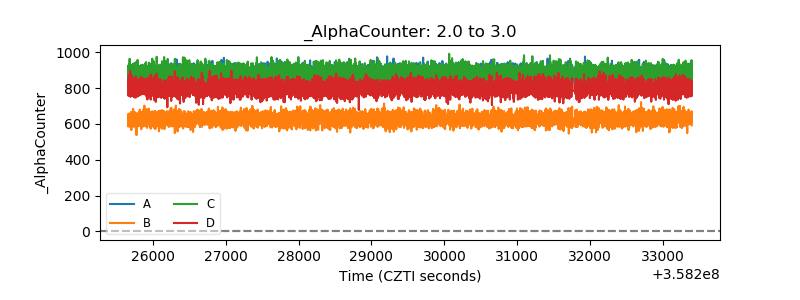 |
| _CPM_Rate | 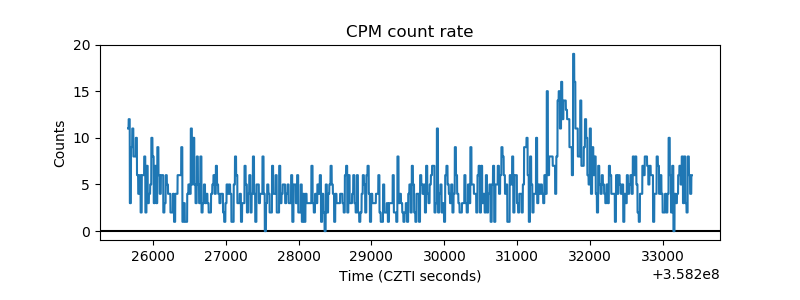 |
| CZT Counter | 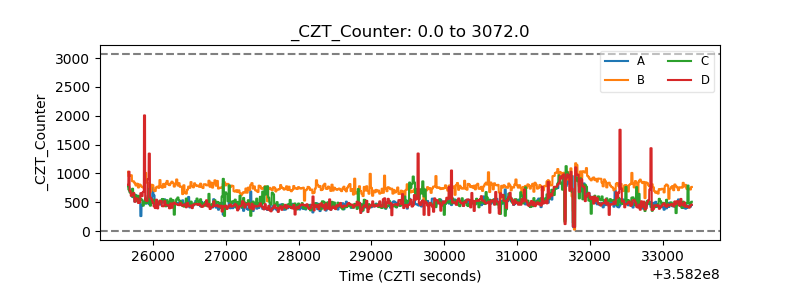 |
| +2.5 Volts monitor |  |
| +5 Volts monitor |  |
| _ROLL_ROT | 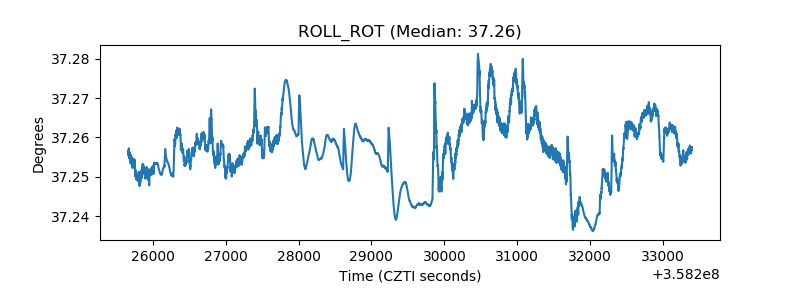 |
| _Roll_DEC | 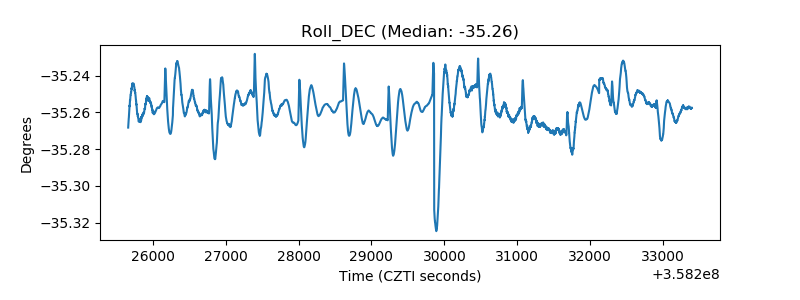 |
| _Roll_RA | 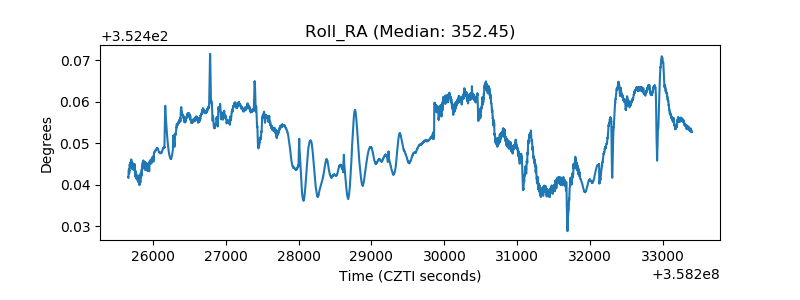 |
| Veto Counter | 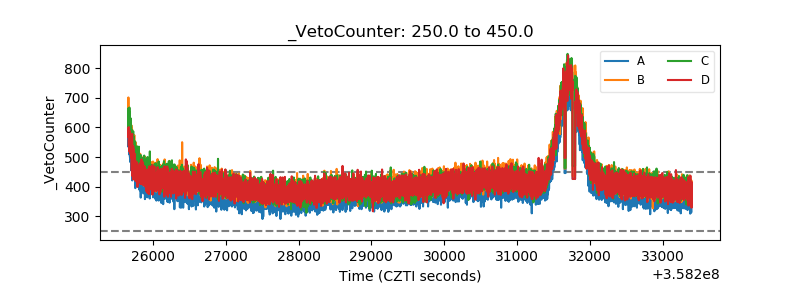 |