| Param | Original file | Final file |
|---|---|---|
| Filename | modeM0/AS1A10_053T14_9000004362_30348cztM0_level2.evt | modeM0/AS1A10_053T14_9000004362_30348cztM0_level2_quad_clean.evt |
| Size (bytes) | 1,251,241,920 | 208,255,680 |
| Size | 1.2 GB | 198.6 MB |
| Events in quadrant A | 7,756,057 | 1,306,102 |
| Events in quadrant B | 12,478,989 | 1,310,291 |
| Events in quadrant C | 8,094,618 | 1,277,210 |
| Events in quadrant D | 8,443,258 | 1,268,590 |
| Mode SS | |||
|---|---|---|---|
| Quadrant | BADHDUFLAG | Total packets | Discarded packets |
| A | 0 | 338 | 0 |
| B | 0 | 338 | 0 |
| C | 0 | 338 | 0 |
| D | 0 | 338 | 0 |
| Mode M9 | |||
|---|---|---|---|
| Quadrant | BADHDUFLAG | Total packets | Discarded packets |
| A | 0 | 18 | 0 |
| B | 0 | 18 | 0 |
| C | 0 | 18 | 0 |
| D | 0 | 18 | 0 |
| Mode M0 | |||
|---|---|---|---|
| Quadrant | BADHDUFLAG | Total packets | Discarded packets |
| A | 0 | 33794 | 2 |
| B | 0 | 49908 | 2 |
| C | 0 | 34393 | 2 |
| D | 0 | 35741 | 2 |
| Quadrant | Total seconds | Saturated seconds | Saturation percentage |
|---|---|---|---|
| A | 16605 | 166 | 0.999699% |
| B | 16605 | 287 | 1.728395% |
| C | 16605 | 304 | 1.830774% |
| D | 16605 | 156 | 0.939476% |
Noise dominated data is calculated using 1-second bins in cleaned event files. If a bin has >2000 counts, and if more than 50% of those come from <1% of pixels, then it is considered to be noise-dominated and hence unusable.
| Quadrant | # 1 sec bins | Bins with >0 counts | Bins with >2000 counts | High rate bins dominated by noise | Noise dominated (total time) | Noise dominated (detector-on time) | Marked lightcurve |
|---|---|---|---|---|---|---|---|
| A | 18390 | 16607 | 0 | 0 | 0.00% | 0.00% | 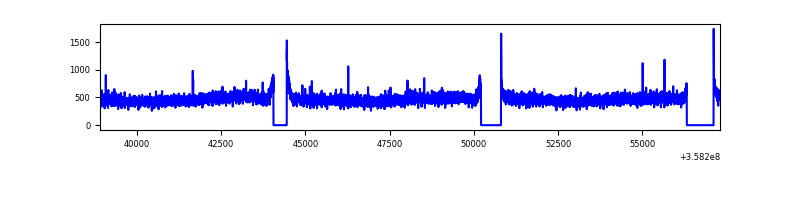 |
| B | 18390 | 16606 | 1 | 1 | 0.01% | 0.01% | 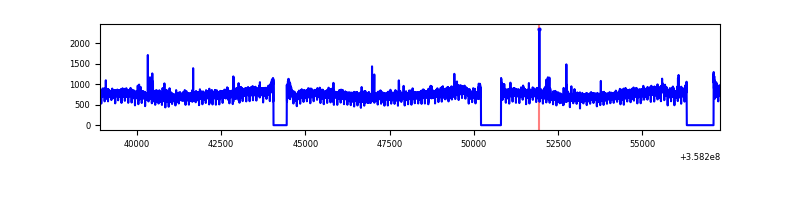 |
| C | 18390 | 16607 | 0 | 0 | 0.00% | 0.00% | 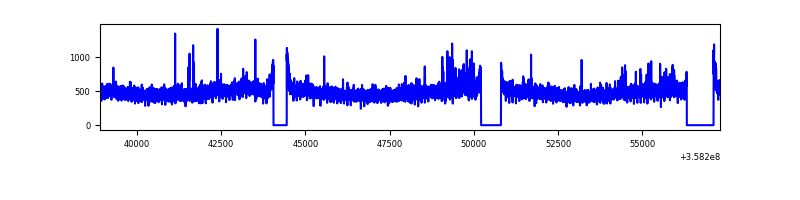 |
| D | 18390 | 16607 | 46 | 46 | 0.25% | 0.28% | 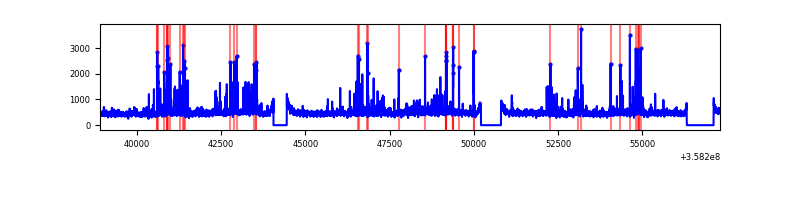 |
Top three noisy pixels from each quadrant. If the there are fewer than three noisy pixels in the level2.evt file, extra rows are filled as -1
| Pixel properties | Quadrant properties | ||||||
|---|---|---|---|---|---|---|---|
| Quadrant | DetID | PixID | Counts | Sigma | Mean | Median | Sigma |
| A | 13 | 254 | 30238 | 70.73 | 2000 | 1956 | 399.9 |
| A | 8 | 192 | 29988 | 70.1 | 2000 | 1956 | 399.9 |
| A | 3 | 137 | 20828 | 47.2 | 2000 | 1956 | 399.9 |
| B | 6 | 159 | 4604386 | 12146.59 | 1969 | 1916 | 378.9 |
| B | 12 | 111 | 48088 | 121.85 | 1969 | 1916 | 378.9 |
| B | 11 | 111 | 44095 | 111.32 | 1969 | 1916 | 378.9 |
| C | 14 | 238 | 353827 | 783.09 | 1920 | 1938 | 449.4 |
| C | 3 | 233 | 141642 | 310.9 | 1920 | 1938 | 449.4 |
| C | 14 | 254 | 62342 | 134.42 | 1920 | 1938 | 449.4 |
| D | 2 | 250 | 499583 | 1037.54 | 1940 | 1896 | 479.7 |
| D | 8 | 195 | 318499 | 660.03 | 1940 | 1896 | 479.7 |
| D | 2 | 234 | 77334 | 157.27 | 1940 | 1896 | 479.7 |
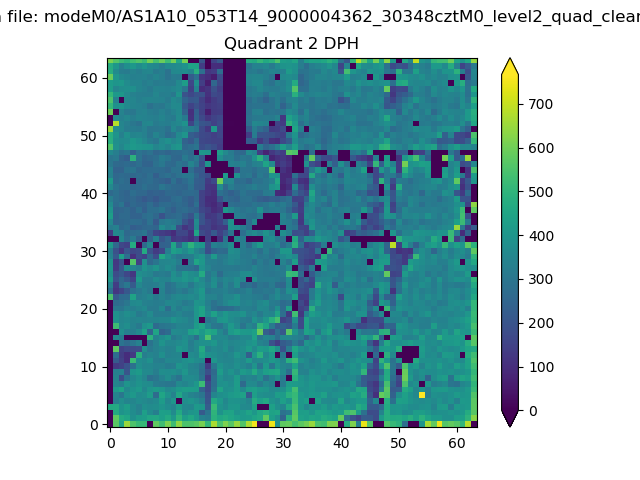
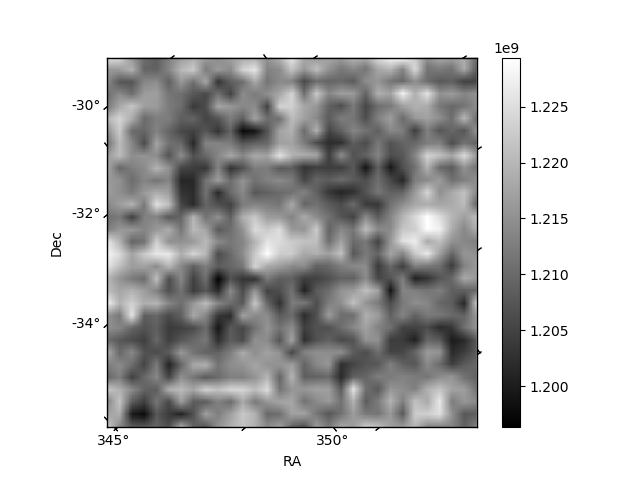
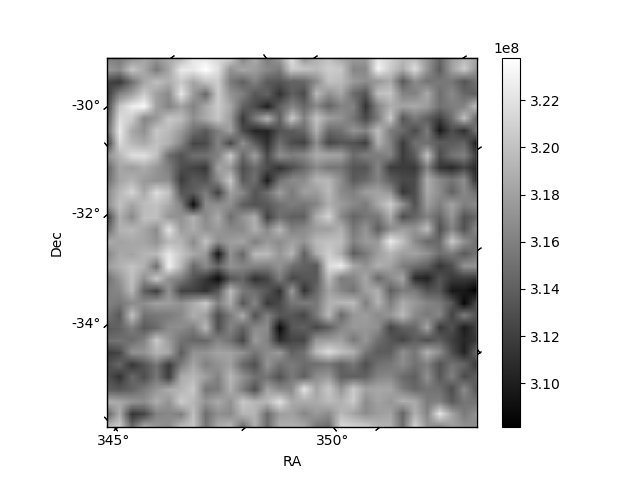
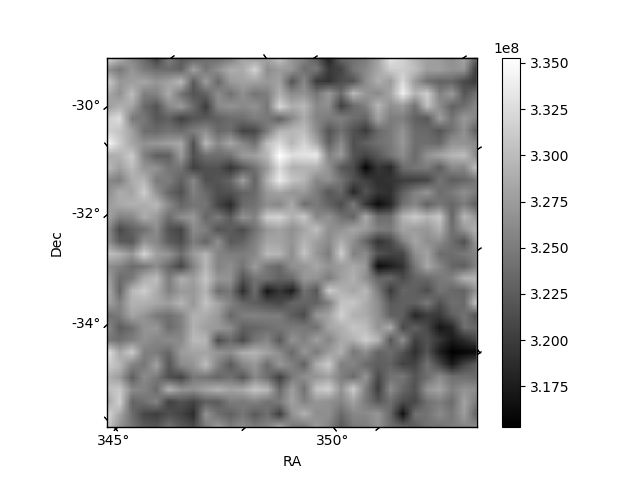
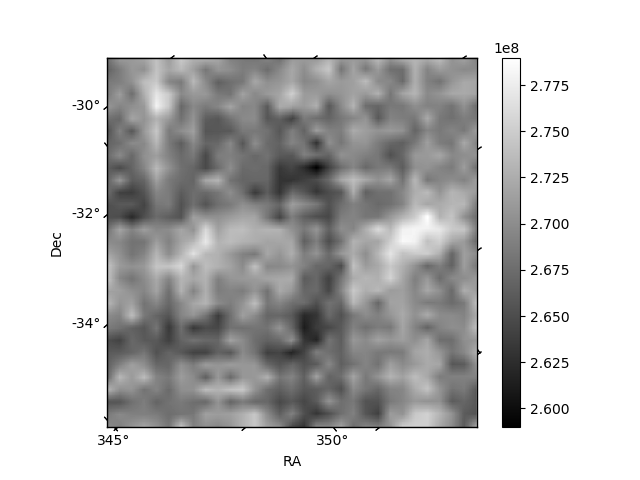
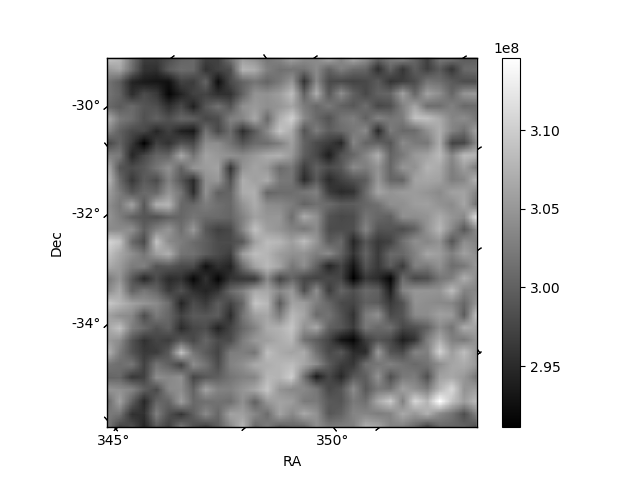
Histogram calculated using DETX and DETY for each event in the final _common_clean file
| Quadrant A | 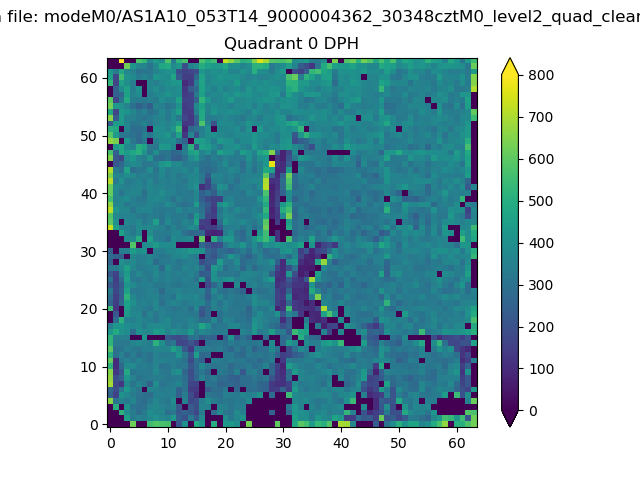 |
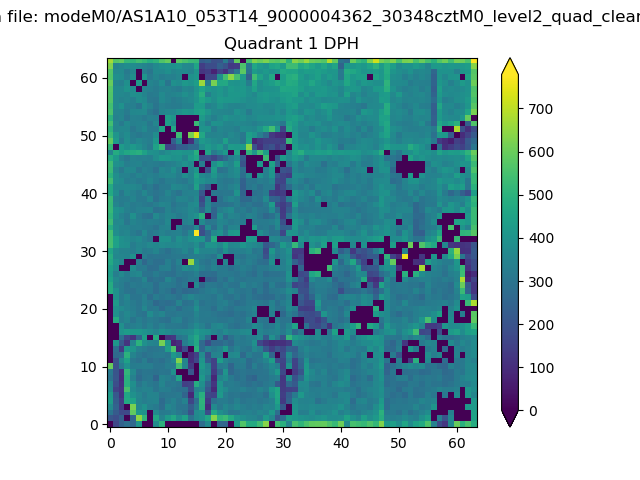 |
Quadrant B |
|---|---|---|---|
| Quadrant D | 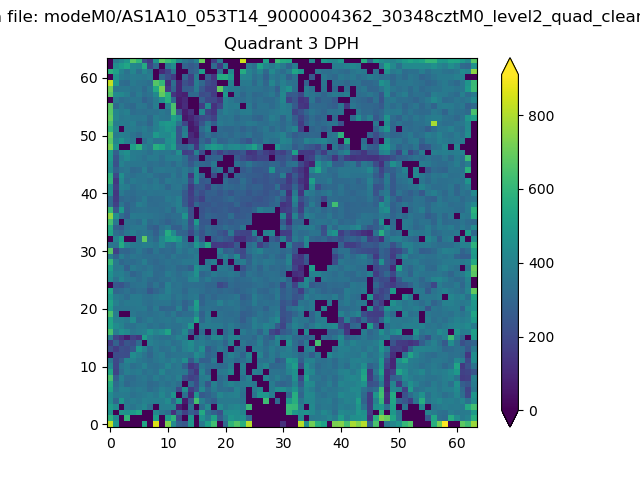 |
 |
Quadrant C |
| Plot type | Count rate plots | Images |
|---|---|---|
| Comparison with Poisson distribution Blue bars denote a histogram of data divided into 1 sec bins. Red curve is a Poisson curve with rate = median count rate of data. |
 |
 |
| Quadrant-wise count rates Data is divided into 100 sec bins |
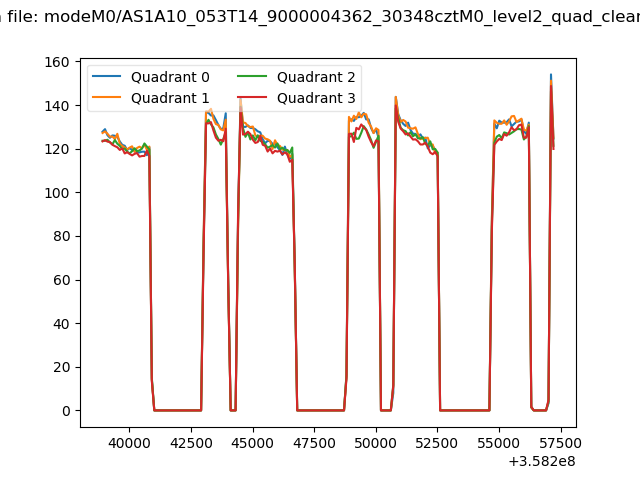 |
|
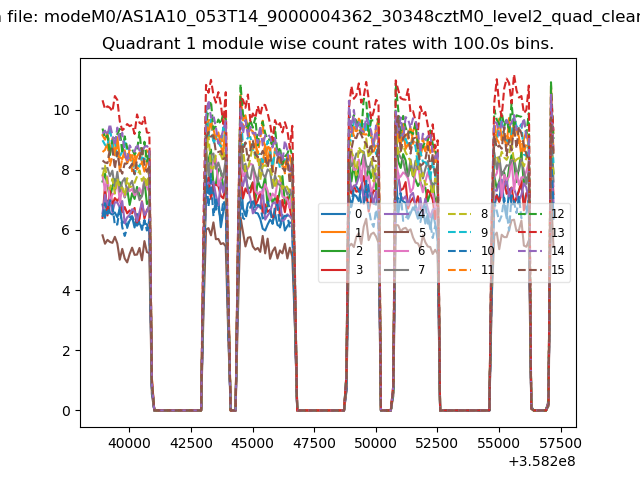
| Module-wise count rates for Quadrant A Data is divided into 100 sec bins |
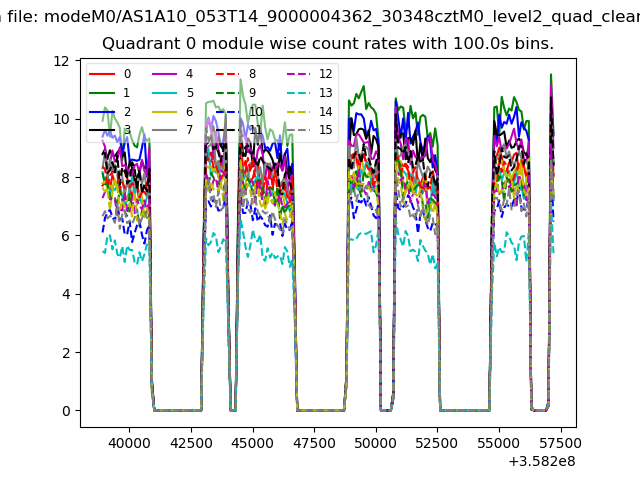 |
 |
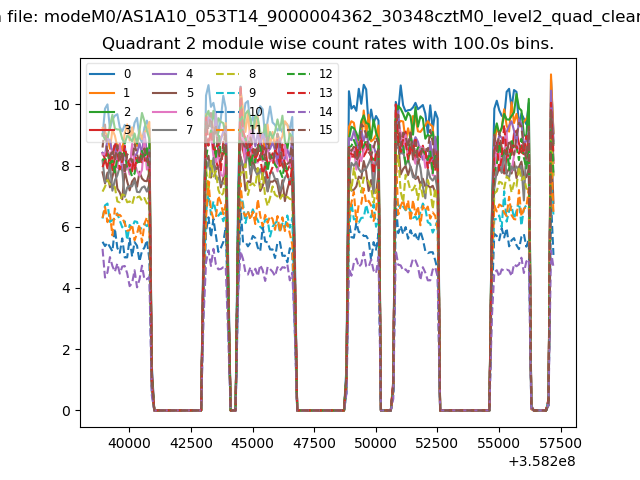
| Module-wise count rates for Quadrant B Data is divided into 100 sec bins |
 |
 |
| Module-wise count rates for Quadrant C Data is divided into 100 sec bins |
 |
 |
| Module-wise count rates for Quadrant D Data is divided into 100 sec bins |
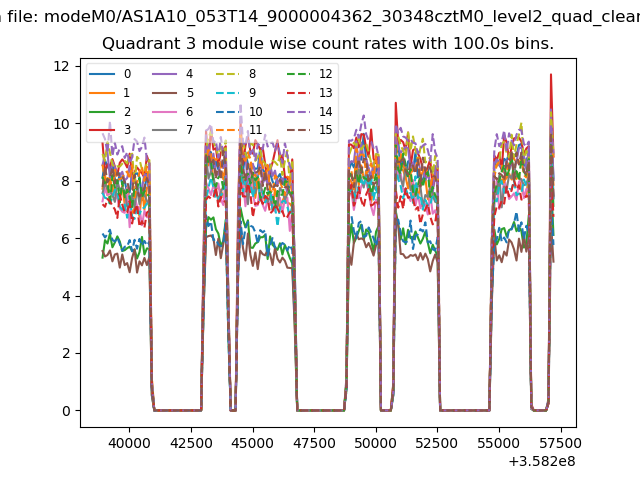 |
 |
| Parameter | Plot |
|---|---|
| CZT HV Monitor | 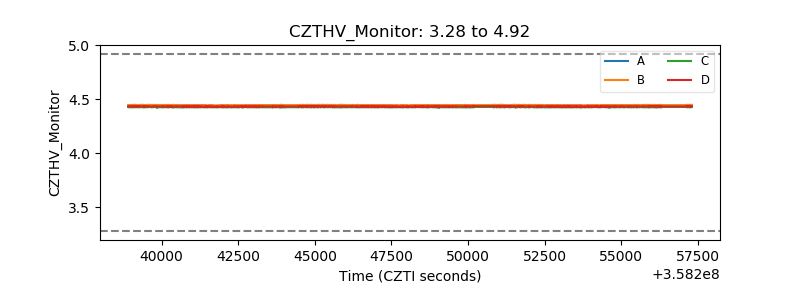 |
| D_VDD | 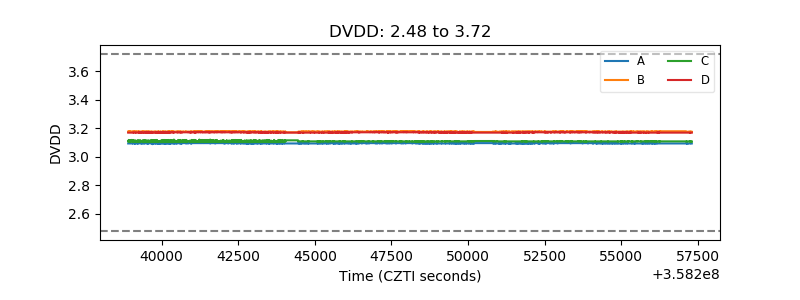 |
| Temperature 1 |  |
| Veto HV Monitor |  |
| Veto LLD | 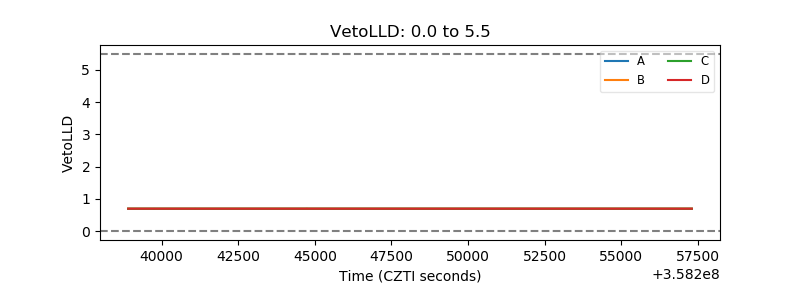 |
| Alpha Counter | 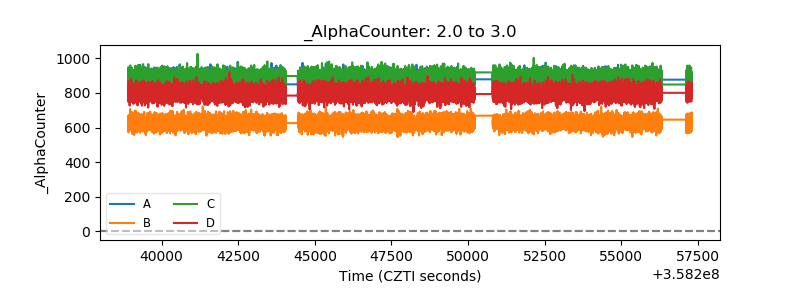 |
| _CPM_Rate | 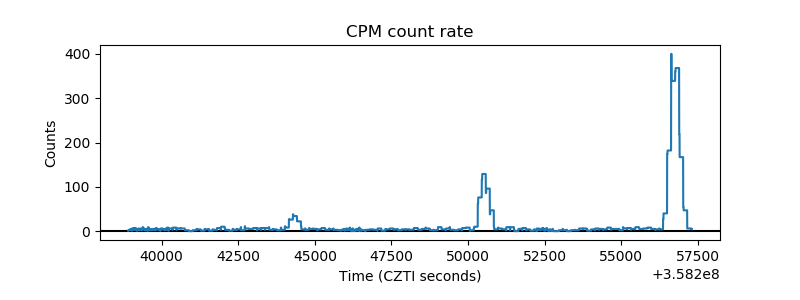 |
| CZT Counter |  |
| +2.5 Volts monitor |  |
| +5 Volts monitor |  |
| _ROLL_ROT | 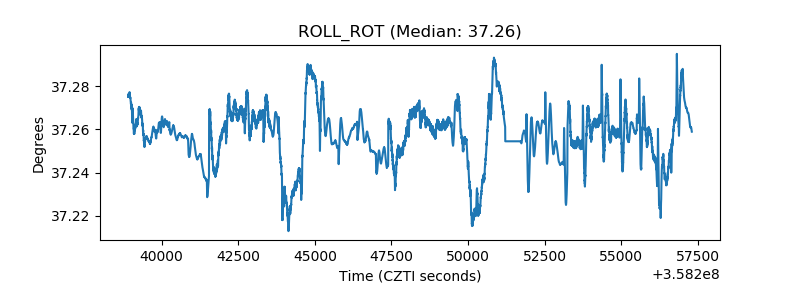 |
| _Roll_DEC | 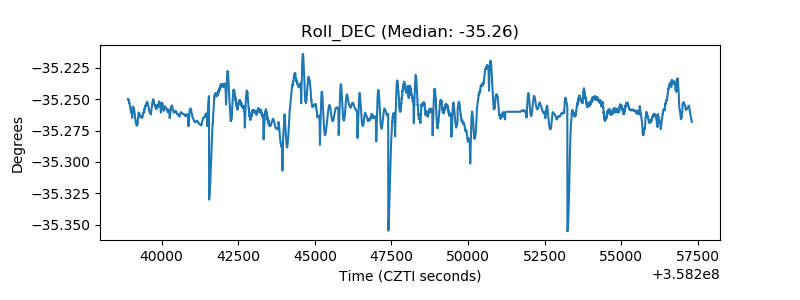 |
| _Roll_RA |  |
| Veto Counter | 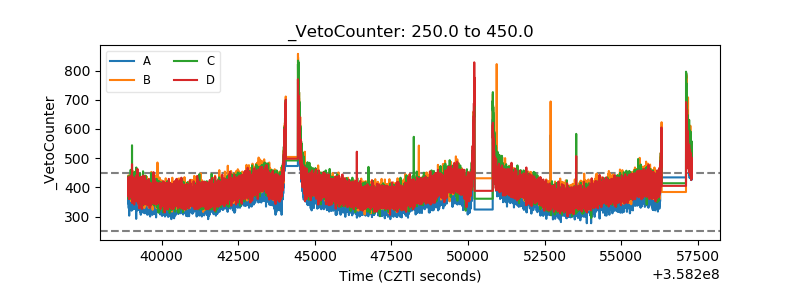 |