| Param | Original file | Final file |
|---|---|---|
| Filename | modeM0/AS1A10_053T15_9000004364cztM0_level2.fits | modeM0/AS1A10_053T15_9000004364cztM0_level2_quad_clean.evt |
| Size (bytes) | 631,814,400 | 475,225,920 |
| Size | 602.5 MB | 453.2 MB |
| Events in quadrant A | 4,022,782 | 2,734,280 |
| Events in quadrant B | 3,795,670 | 2,709,311 |
| Events in quadrant C | 3,658,600 | 2,324,427 |
| Events in quadrant D | 3,431,496 | 2,398,560 |
| Mode M0 | |||
|---|---|---|---|
| Quadrant | BADHDUFLAG | Total packets | Discarded packets |
| A | 0 | 130443 | 0 |
| B | 0 | 186820 | 0 |
| C | 0 | 218360 | 0 |
| D | 0 | 145805 | 0 |
| Mode M9 | |||
|---|---|---|---|
| Quadrant | BADHDUFLAG | Total packets | Discarded packets |
| A | 0 | 101 | 0 |
| B | 0 | 101 | 0 |
| C | 0 | 101 | 0 |
| D | 0 | 101 | 0 |
| Mode SS | |||
|---|---|---|---|
| Quadrant | BADHDUFLAG | Total packets | Discarded packets |
| A | 0 | 1252 | 0 |
| B | 0 | 1252 | 0 |
| C | 0 | 1252 | 0 |
| D | 0 | 1252 | 0 |
| Quadrant | Total seconds | Saturated seconds | Saturation percentage |
|---|---|---|---|
| A | 61571 | 742 | 1.205113% |
| B | 61571 | 1319 | 2.142242% |
| C | 61571 | 8322 | 13.516103% |
| D | 61571 | 982 | 1.594907% |
Noise dominated data is calculated using 1-second bins in cleaned event files. If a bin has >2000 counts, and if more than 50% of those come from <1% of pixels, then it is considered to be noise-dominated and hence unusable.
| Quadrant | # 1 sec bins | Bins with >0 counts | Bins with >2000 counts | High rate bins dominated by noise | Noise dominated (total time) | Noise dominated (detector-on time) | Marked lightcurve |
|---|---|---|---|---|---|---|---|
| A | 71621 | 61563 | 0 | 0 | 0.00% | 0.00% |  |
| B | 71621 | 61560 | 0 | 0 | 0.00% | 0.00% |  |
| C | 71620 | 61525 | 0 | 0 | 0.00% | 0.00% |  |
| D | 71621 | 61562 | 0 | 0 | 0.00% | 0.00% |  |
Top three noisy pixels from each quadrant. If the there are fewer than three noisy pixels in the level2.evt file, extra rows are filled as -1
| Pixel properties | Quadrant properties | ||||||
|---|---|---|---|---|---|---|---|
| Quadrant | DetID | PixID | Counts | Sigma | Mean | Median | Sigma |
| A | 0 | 29 | 3837 | 11.14 | 1050 | 990 | 255.5 |
| A | 7 | 110 | 3197 | 8.64 | 1050 | 990 | 255.5 |
| A | 14 | 95 | 2929 | 7.59 | 1050 | 990 | 255.5 |
| B | 2 | 9 | 2888 | 9.85 | 1002 | 960 | 195.7 |
| B | 3 | 80 | 2520 | 7.97 | 1002 | 960 | 195.7 |
| B | 5 | 128 | 2504 | 7.89 | 1002 | 960 | 195.7 |
| C | 1 | 81 | 2812 | 7.88 | 966 | 911 | 241.3 |
| C | 1 | 80 | 2806 | 7.85 | 966 | 911 | 241.3 |
| C | 12 | 241 | 2592 | 6.97 | 966 | 911 | 241.3 |
| D | 15 | 46 | 2543 | 6.35 | 980 | 894 | 259.6 |
| D | 7 | 3 | 2520 | 6.26 | 980 | 894 | 259.6 |
| D | 3 | 14 | 2453 | 6.0 | 980 | 894 | 259.6 |
Histogram calculated using DETX and DETY for each event in the final _common_clean file
| Quadrant A | 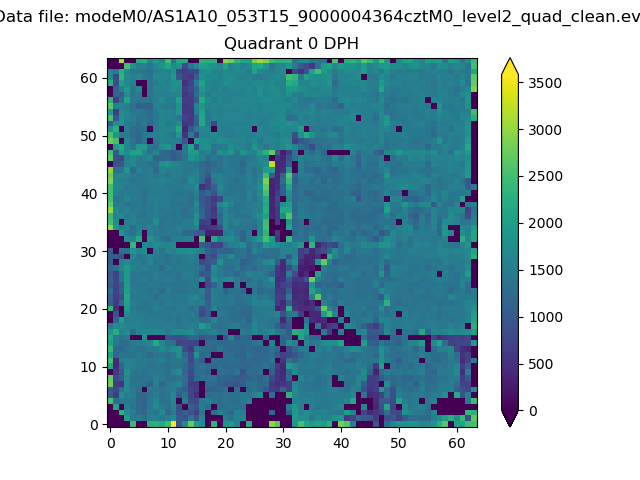 |
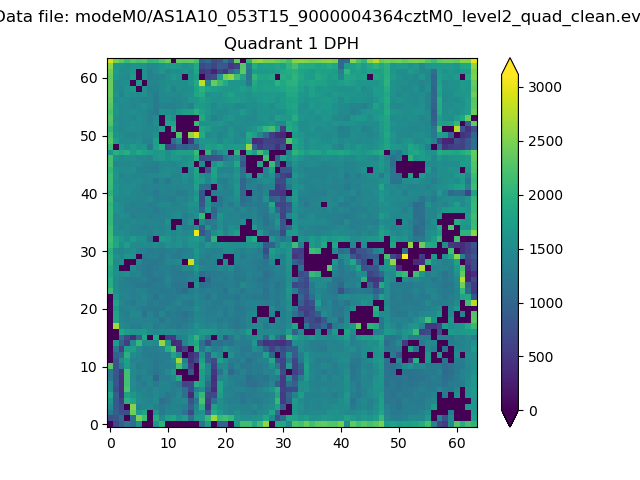 |
Quadrant B |
|---|---|---|---|
| Quadrant D |  |
 |
Quadrant C |
| Plot type | Count rate plots | Images |
|---|---|---|
| Comparison with Poisson distribution Blue bars denote a histogram of data divided into 1 sec bins. Red curve is a Poisson curve with rate = median count rate of data. |
 |
 |
| Quadrant-wise count rates Data is divided into 100 sec bins |
 |
|
| Module-wise count rates for Quadrant A Data is divided into 100 sec bins |
 |
 |
| Module-wise count rates for Quadrant B Data is divided into 100 sec bins |
 |
 |
| Module-wise count rates for Quadrant C Data is divided into 100 sec bins |
 |
 |
| Module-wise count rates for Quadrant D Data is divided into 100 sec bins |
 |
 |
| Parameter | Plot |
|---|---|
| CZT HV Monitor |  |
| D_VDD |  |
| Temperature 1 |  |
| Veto HV Monitor |  |
| Veto LLD |  |
| Alpha Counter |  |
| _CPM_Rate | 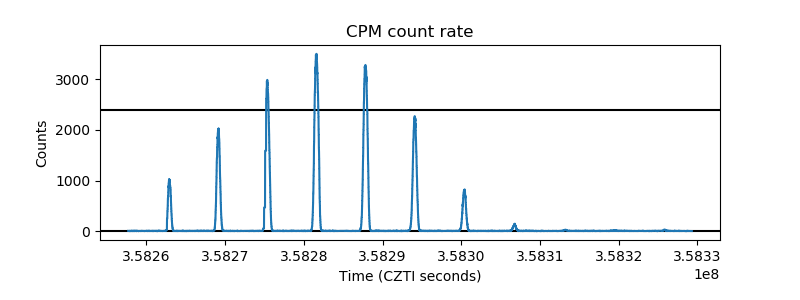 |
| CZT Counter |  |
| +2.5 Volts monitor |  |
| +5 Volts monitor |  |
| _ROLL_ROT |  |
| _Roll_DEC |  |
| _Roll_RA |  |
| Veto Counter |  |