| Param | Original file | Final file |
|---|---|---|
| Filename | modeM0/AS1A10_053T15_9000004364_30348cztM0_level2.evt | modeM0/AS1A10_053T15_9000004364_30348cztM0_level2_quad_clean.evt |
| Size (bytes) | 67,556,160 | 17,176,320 |
| Size | 64.4 MB | 16.4 MB |
| Events in quadrant A | 425,004 | 113,441 |
| Events in quadrant B | 655,414 | 114,770 |
| Events in quadrant C | 432,117 | 111,636 |
| Events in quadrant D | 469,434 | 109,936 |
| Mode M0 | |||
|---|---|---|---|
| Quadrant | BADHDUFLAG | Total packets | Discarded packets |
| A | 0 | 1792 | 0 |
| B | 0 | 2674 | 2 |
| C | 0 | 1809 | 0 |
| D | 0 | 1929 | 0 |
| Mode SS | |||
|---|---|---|---|
| Quadrant | BADHDUFLAG | Total packets | Discarded packets |
| A | 0 | 18 | 0 |
| B | 0 | 18 | 0 |
| C | 0 | 18 | 0 |
| D | 0 | 18 | 0 |
| Quadrant | Total seconds | Saturated seconds | Saturation percentage |
|---|---|---|---|
| A | 894 | 0 | 0.000000% |
| B | 893 | 2 | 0.223964% |
| C | 893 | 2 | 0.223964% |
| D | 893 | 8 | 0.895857% |
Noise dominated data is calculated using 1-second bins in cleaned event files. If a bin has >2000 counts, and if more than 50% of those come from <1% of pixels, then it is considered to be noise-dominated and hence unusable.
| Quadrant | # 1 sec bins | Bins with >0 counts | Bins with >2000 counts | High rate bins dominated by noise | Noise dominated (total time) | Noise dominated (detector-on time) | Marked lightcurve |
|---|---|---|---|---|---|---|---|
| A | 894 | 894 | 0 | 0 | 0.00% | 0.00% | 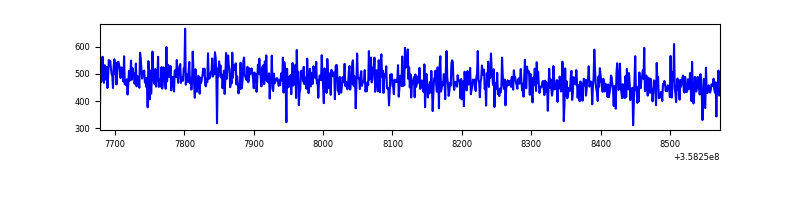 |
| B | 893 | 893 | 0 | 0 | 0.00% | 0.00% | 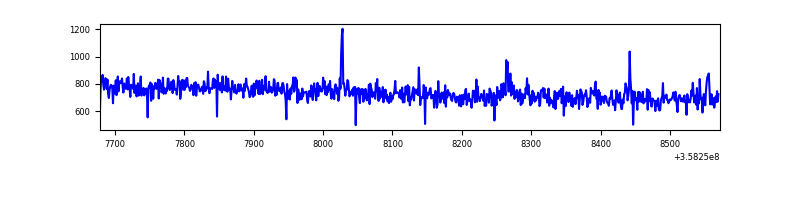 |
| C | 893 | 893 | 0 | 0 | 0.00% | 0.00% | 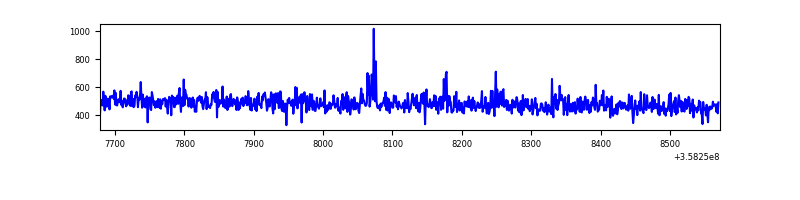 |
| D | 893 | 893 | 7 | 7 | 0.78% | 0.78% | 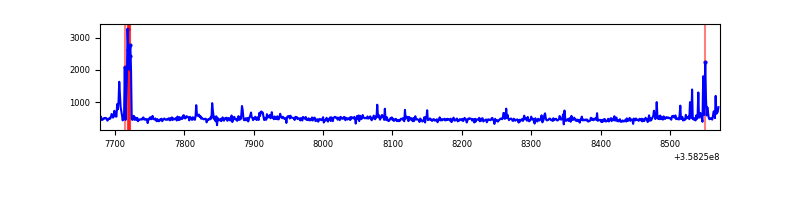 |
Top three noisy pixels from each quadrant. If the there are fewer than three noisy pixels in the level2.evt file, extra rows are filled as -1
| Pixel properties | Quadrant properties | ||||||
|---|---|---|---|---|---|---|---|
| Quadrant | DetID | PixID | Counts | Sigma | Mean | Median | Sigma |
| A | 13 | 254 | 1586 | 61.37 | 110 | 107 | 24.1 |
| A | 3 | 137 | 1046 | 38.96 | 110 | 107 | 24.1 |
| A | 0 | 226 | 932 | 34.23 | 110 | 107 | 24.1 |
| B | 6 | 159 | 225914 | 9731.85 | 106 | 104 | 23.2 |
| B | 3 | 209 | 6669 | 282.94 | 106 | 104 | 23.2 |
| B | 12 | 111 | 2602 | 107.66 | 106 | 104 | 23.2 |
| C | 14 | 238 | 18465 | 699.94 | 103 | 104 | 26.2 |
| C | 3 | 233 | 3761 | 139.41 | 103 | 104 | 26.2 |
| C | 14 | 254 | 2698 | 98.89 | 103 | 104 | 26.2 |
| D | 13 | 249 | 23696 | 796.68 | 106 | 103 | 29.6 |
| D | 8 | 195 | 19946 | 670.05 | 106 | 103 | 29.6 |
| D | 2 | 250 | 19449 | 653.27 | 106 | 103 | 29.6 |
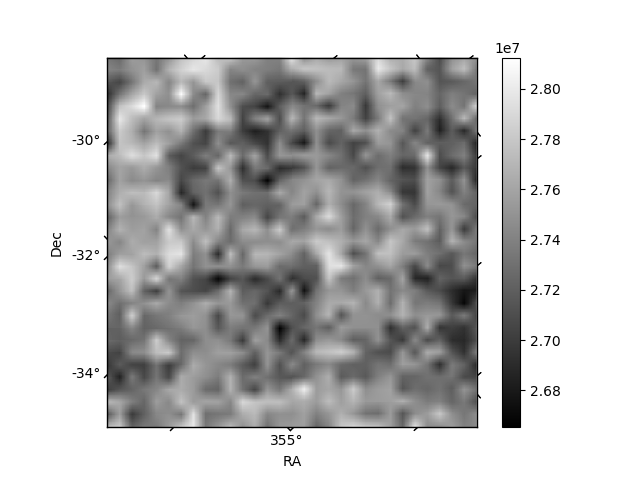
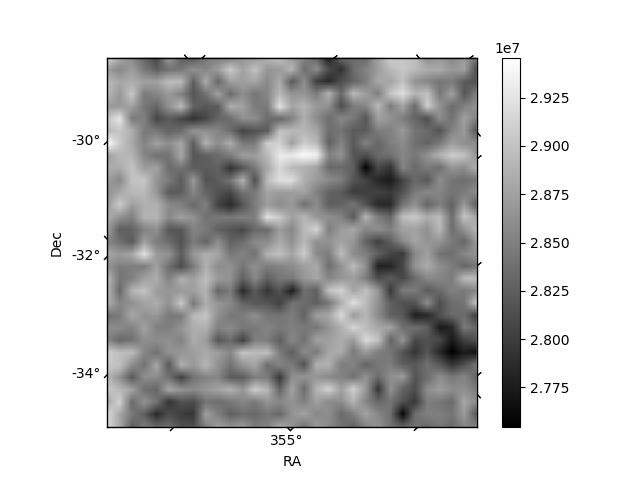
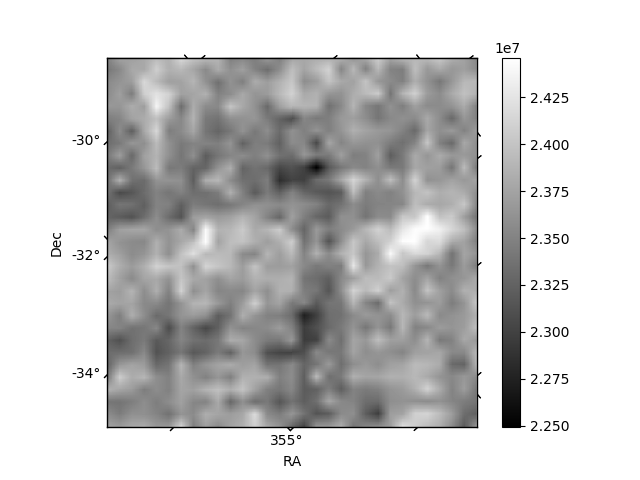
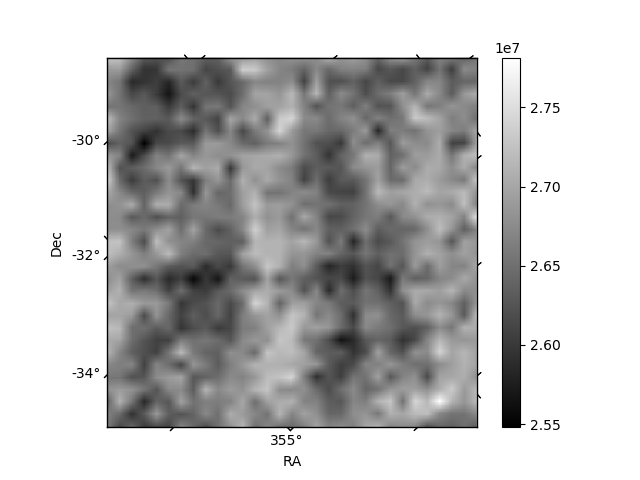
Histogram calculated using DETX and DETY for each event in the final _common_clean file
| Quadrant A | 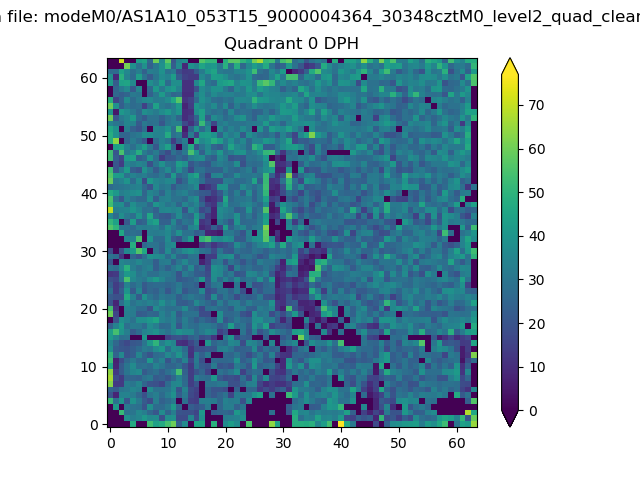 |
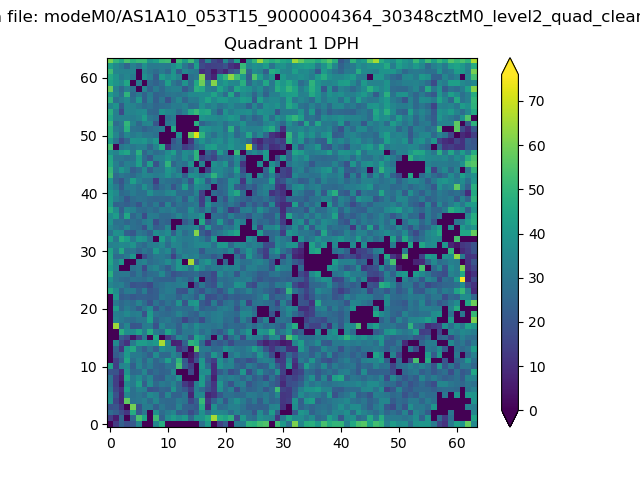 |
Quadrant B |
|---|---|---|---|
| Quadrant D |  |
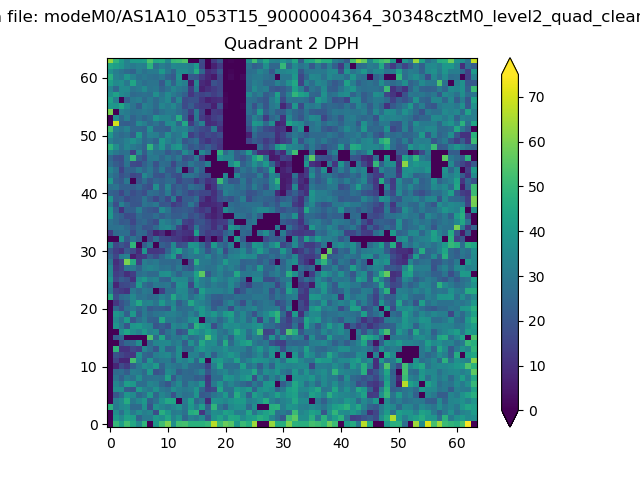 |
Quadrant C |
| Plot type | Count rate plots | Images |
|---|---|---|
| Comparison with Poisson distribution Blue bars denote a histogram of data divided into 1 sec bins. Red curve is a Poisson curve with rate = median count rate of data. |
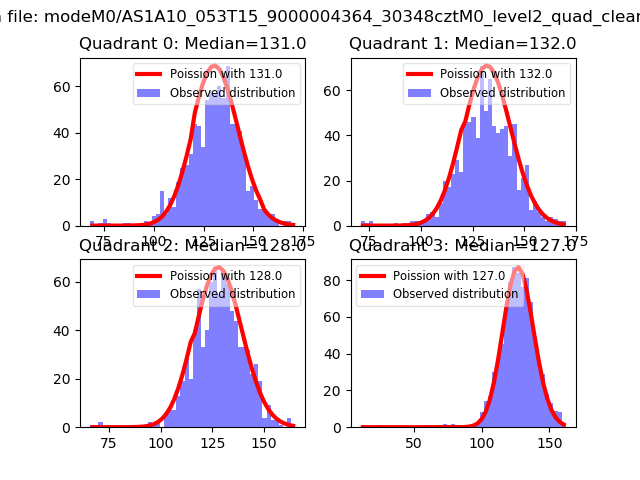 |
 |
| Quadrant-wise count rates Data is divided into 100 sec bins |
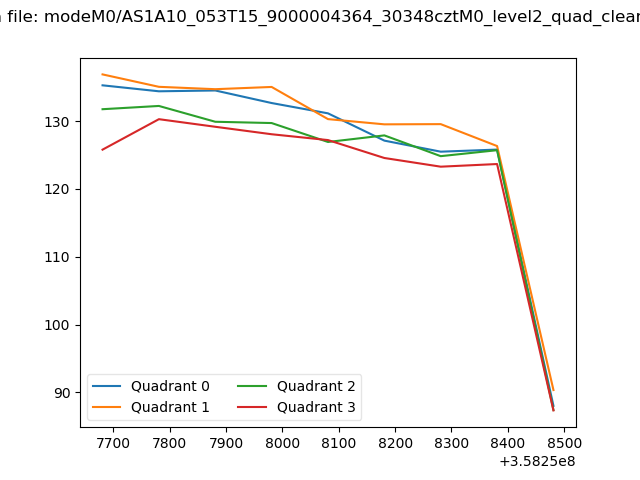 |
|
| Module-wise count rates for Quadrant A Data is divided into 100 sec bins |
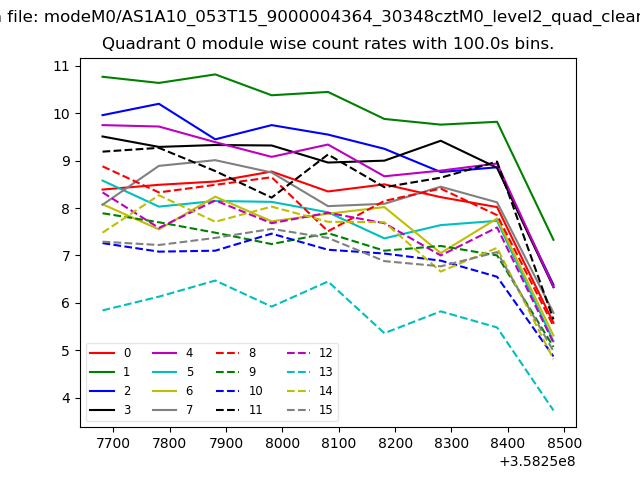 |
 |
| Module-wise count rates for Quadrant B Data is divided into 100 sec bins |
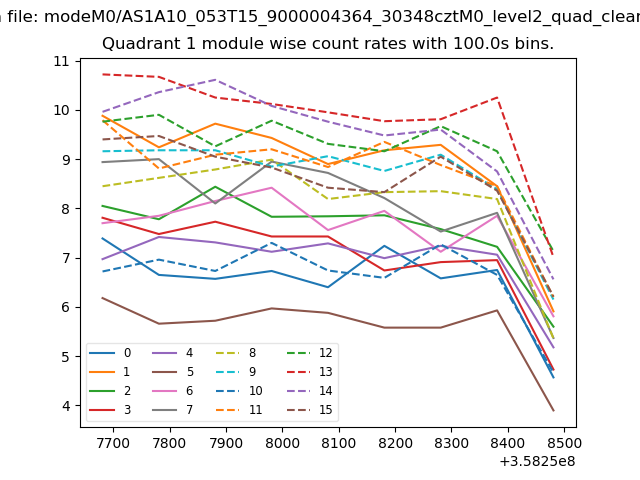 |
 |
| Module-wise count rates for Quadrant C Data is divided into 100 sec bins |
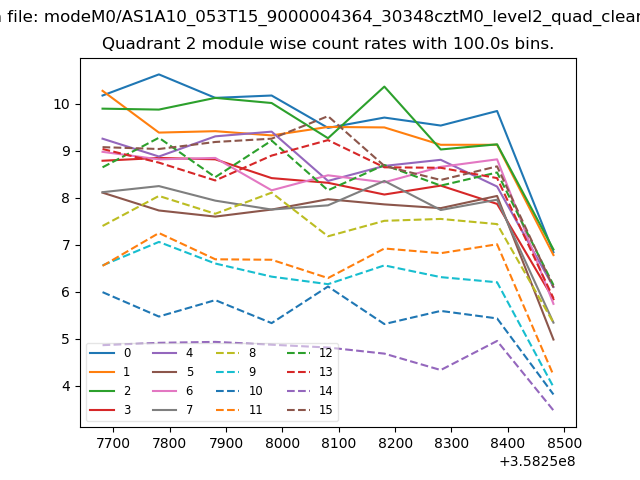 |
 |
| Module-wise count rates for Quadrant D Data is divided into 100 sec bins |
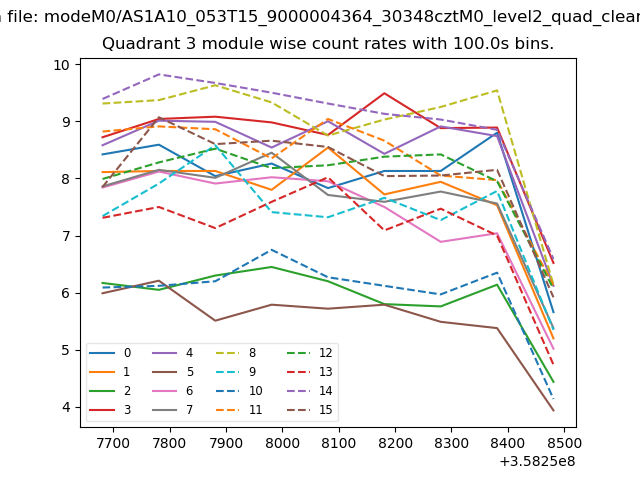 |
 |
| Parameter | Plot |
|---|---|
| CZT HV Monitor | 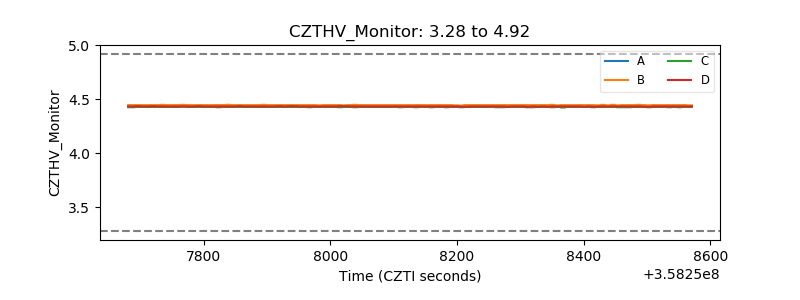 |
| D_VDD | 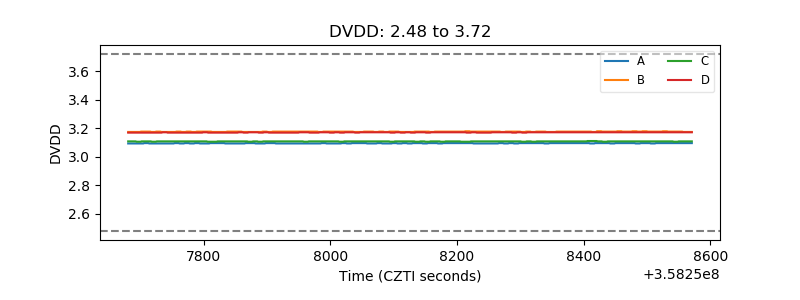 |
| Temperature 1 | 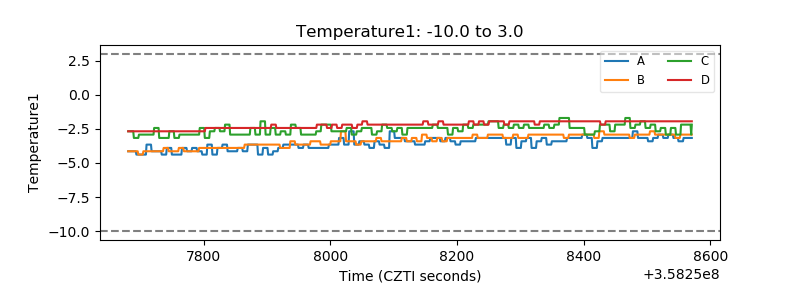 |
| Veto HV Monitor | 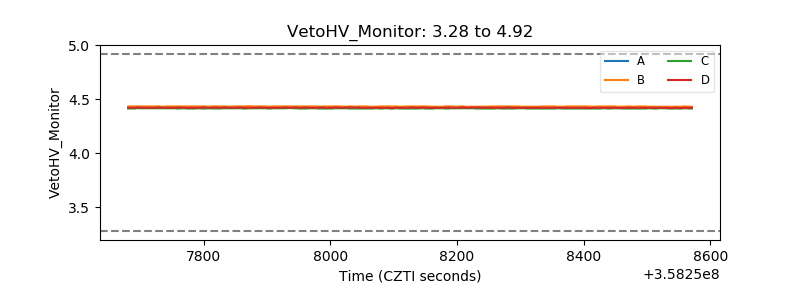 |
| Veto LLD | 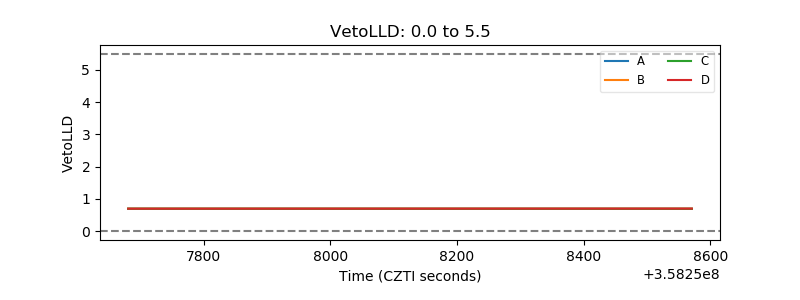 |
| Alpha Counter | 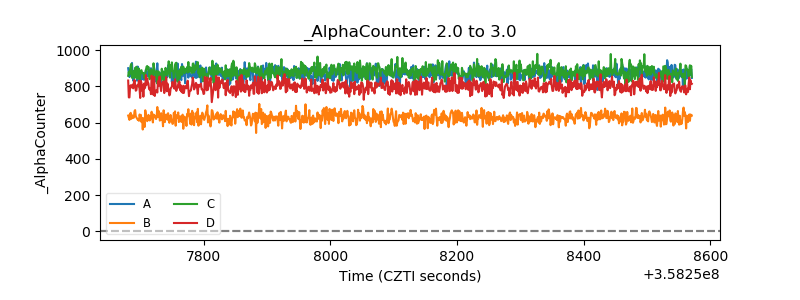 |
| _CPM_Rate | 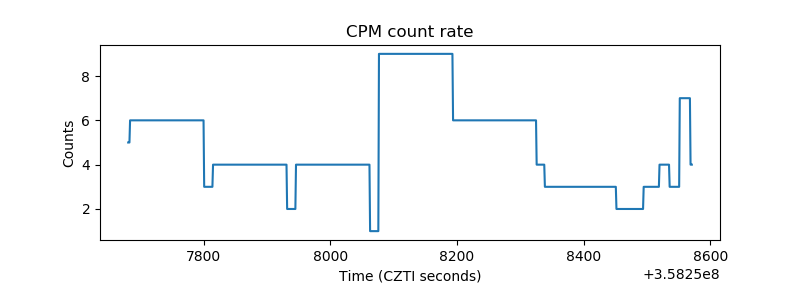 |
| CZT Counter | 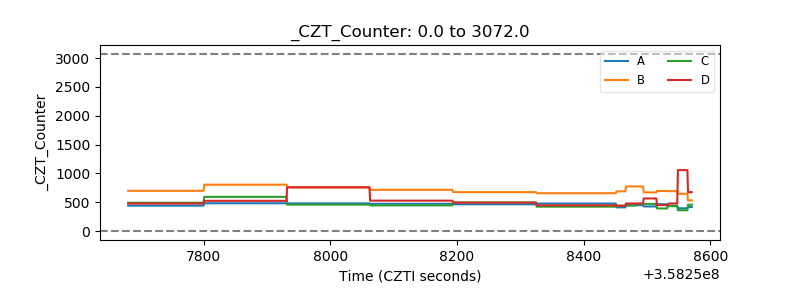 |
| +2.5 Volts monitor |  |
| +5 Volts monitor |  |
| _ROLL_ROT | 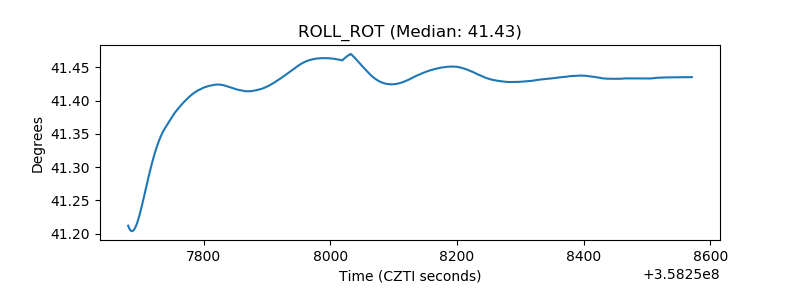 |
| _Roll_DEC | 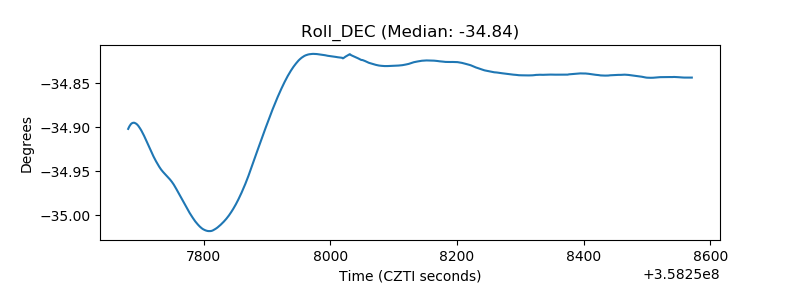 |
| _Roll_RA | 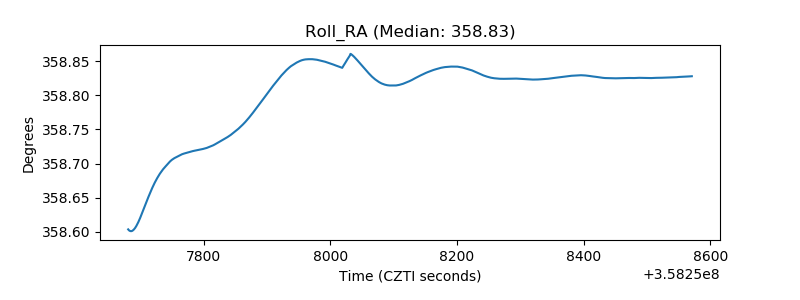 |
| Veto Counter | 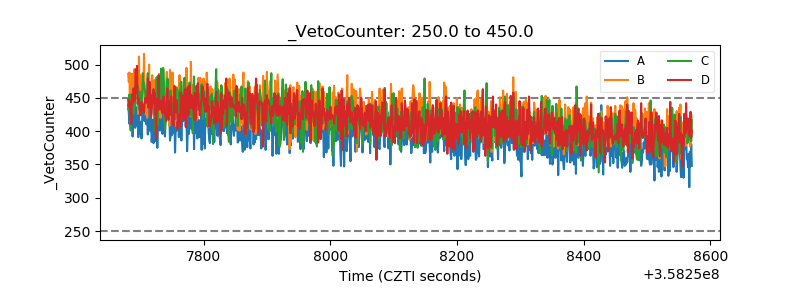 |