| Param | Original file | Final file |
|---|---|---|
| Filename | modeM0/AS1A10_053T15_9000004364_30351cztM0_level2.evt | modeM0/AS1A10_053T15_9000004364_30351cztM0_level2_quad_clean.evt |
| Size (bytes) | 541,336,320 | 83,373,120 |
| Size | 516.3 MB | 79.5 MB |
| Events in quadrant A | 3,288,573 | 533,241 |
| Events in quadrant B | 5,011,829 | 533,921 |
| Events in quadrant C | 3,457,829 | 499,872 |
| Events in quadrant D | 4,197,731 | 506,247 |
| Mode M0 | |||
|---|---|---|---|
| Quadrant | BADHDUFLAG | Total packets | Discarded packets |
| A | 0 | 13846 | 2 |
| B | 0 | 19614 | 2 |
| C | 0 | 14176 | 2 |
| D | 0 | 16546 | 2 |
| Mode M9 | |||
|---|---|---|---|
| Quadrant | BADHDUFLAG | Total packets | Discarded packets |
| A | 0 | 12 | 0 |
| B | 0 | 12 | 0 |
| C | 0 | 13 | 0 |
| D | 0 | 13 | 0 |
| Mode SS | |||
|---|---|---|---|
| Quadrant | BADHDUFLAG | Total packets | Discarded packets |
| A | 0 | 132 | 0 |
| B | 0 | 132 | 0 |
| C | 0 | 132 | 0 |
| D | 0 | 132 | 0 |
| Quadrant | Total seconds | Saturated seconds | Saturation percentage |
|---|---|---|---|
| A | 6469 | 78 | 1.205751% |
| B | 6469 | 117 | 1.808626% |
| C | 6469 | 276 | 4.266502% |
| D | 6469 | 142 | 2.195084% |
Noise dominated data is calculated using 1-second bins in cleaned event files. If a bin has >2000 counts, and if more than 50% of those come from <1% of pixels, then it is considered to be noise-dominated and hence unusable.
| Quadrant | # 1 sec bins | Bins with >0 counts | Bins with >2000 counts | High rate bins dominated by noise | Noise dominated (total time) | Noise dominated (detector-on time) | Marked lightcurve |
|---|---|---|---|---|---|---|---|
| A | 7559 | 6469 | 1 | 1 | 0.01% | 0.02% | 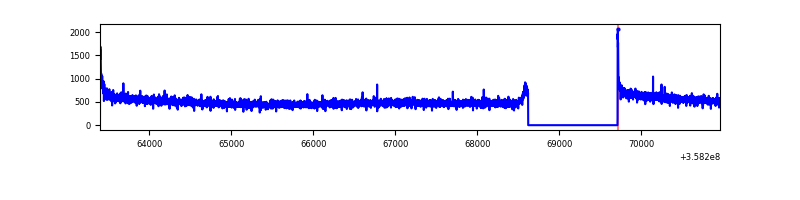 |
| B | 7559 | 6469 | 0 | 0 | 0.00% | 0.00% | 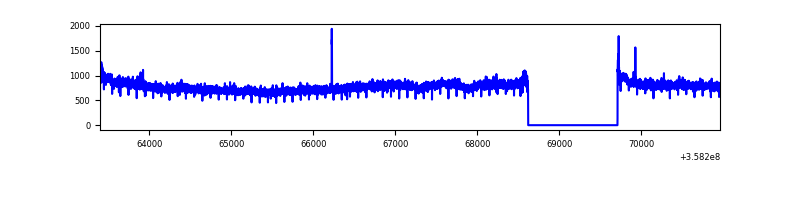 |
| C | 7559 | 6469 | 1 | 1 | 0.01% | 0.02% | 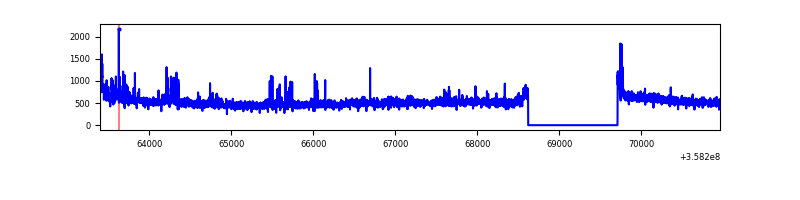 |
| D | 7559 | 6469 | 82 | 82 | 1.08% | 1.27% | 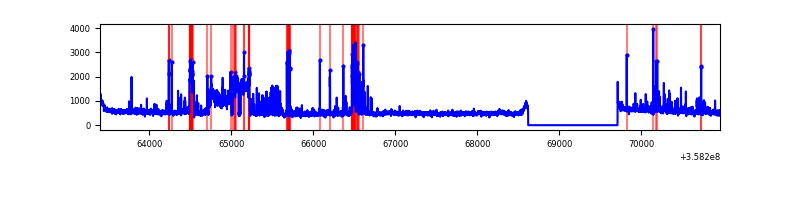 |
Top three noisy pixels from each quadrant. If the there are fewer than three noisy pixels in the level2.evt file, extra rows are filled as -1
| Pixel properties | Quadrant properties | ||||||
|---|---|---|---|---|---|---|---|
| Quadrant | DetID | PixID | Counts | Sigma | Mean | Median | Sigma |
| A | 8 | 192 | 19578 | 111.76 | 847 | 833 | 167.7 |
| A | 13 | 254 | 12455 | 69.29 | 847 | 833 | 167.7 |
| A | 3 | 137 | 8317 | 44.62 | 847 | 833 | 167.7 |
| B | 6 | 159 | 1728432 | 11018.26 | 831 | 812 | 156.8 |
| B | 12 | 111 | 19212 | 117.35 | 831 | 812 | 156.8 |
| B | 11 | 111 | 17908 | 109.03 | 831 | 812 | 156.8 |
| C | 14 | 238 | 185475 | 1008.9 | 790 | 795 | 183.1 |
| C | 3 | 233 | 84537 | 457.48 | 790 | 795 | 183.1 |
| C | 14 | 254 | 78262 | 423.2 | 790 | 795 | 183.1 |
| D | 13 | 104 | 639630 | 3264.25 | 811 | 792 | 195.7 |
| D | 2 | 250 | 281494 | 1434.29 | 811 | 792 | 195.7 |
| D | 8 | 195 | 105149 | 533.23 | 811 | 792 | 195.7 |
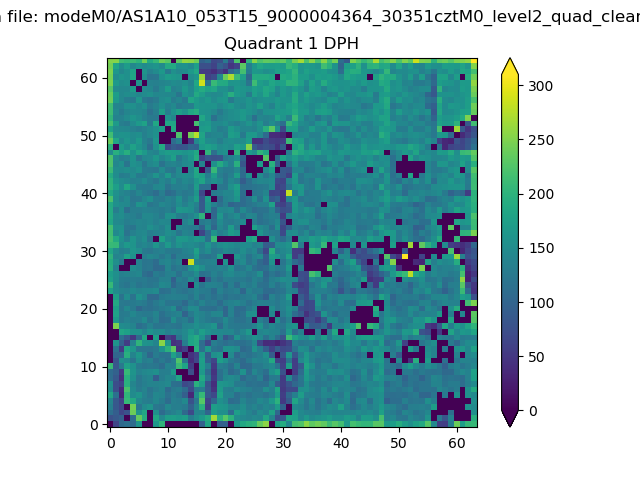
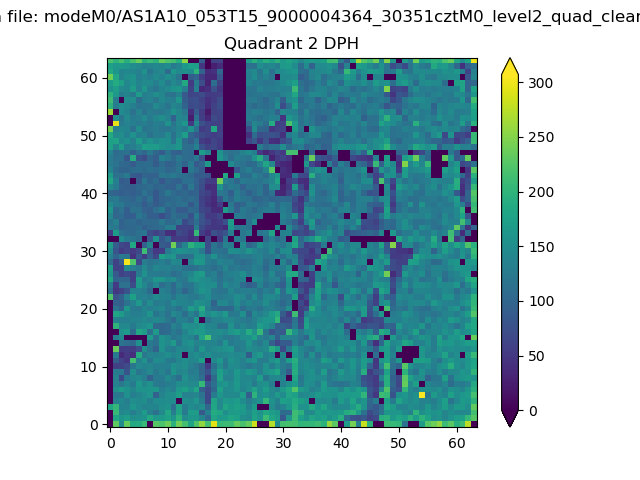
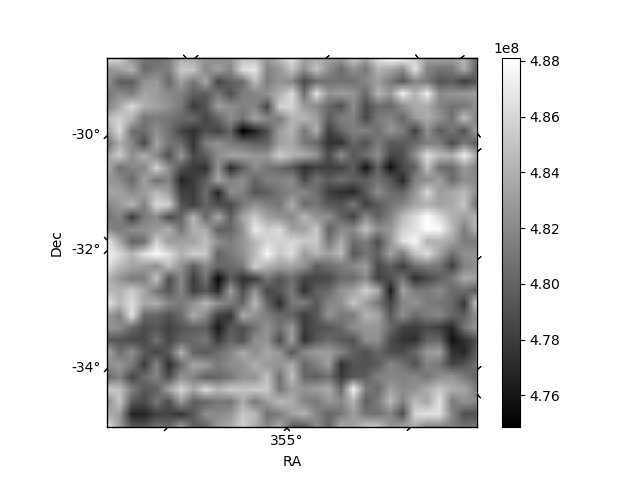
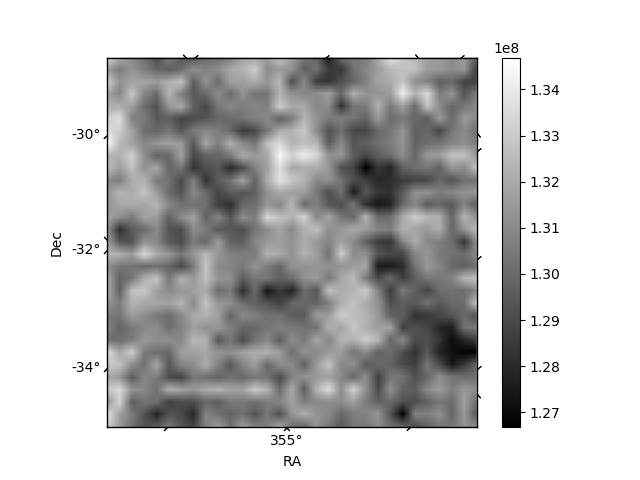
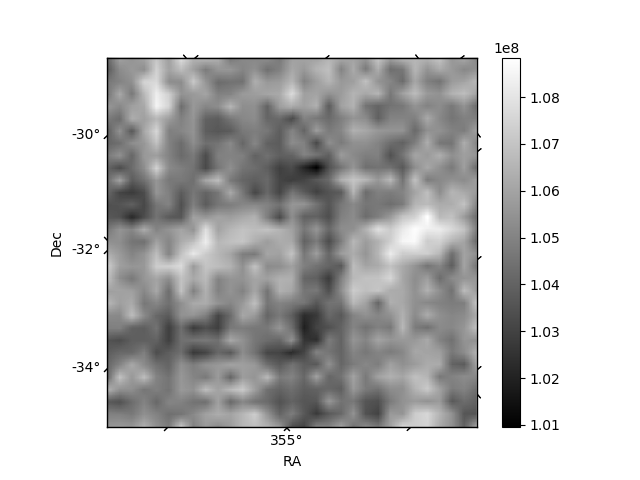
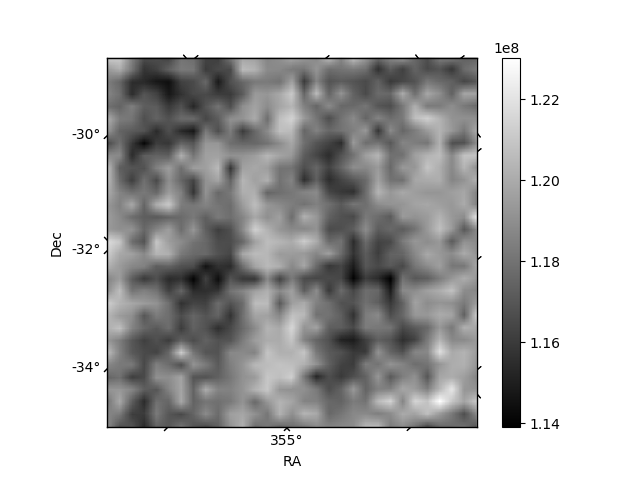
Histogram calculated using DETX and DETY for each event in the final _common_clean file
| Quadrant A |  |
 |
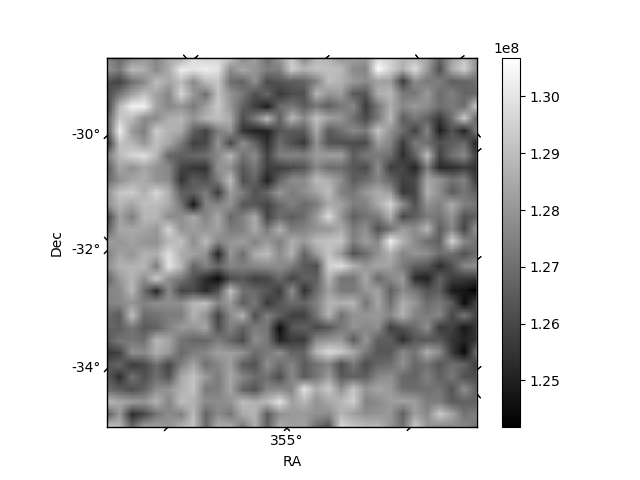
Quadrant B |
|---|---|---|---|
| Quadrant D | 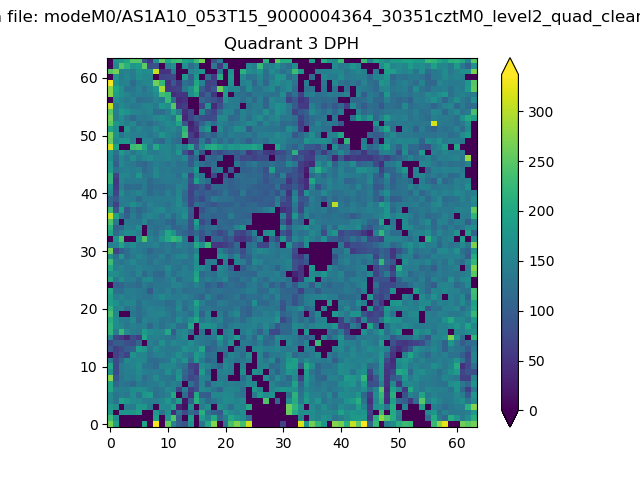 |
 |
Quadrant C |
| Plot type | Count rate plots | Images |
|---|---|---|
| Comparison with Poisson distribution Blue bars denote a histogram of data divided into 1 sec bins. Red curve is a Poisson curve with rate = median count rate of data. |
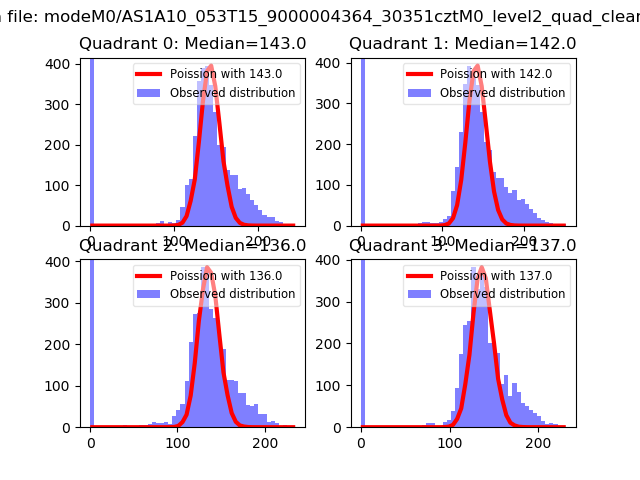 |
 |
| Quadrant-wise count rates Data is divided into 100 sec bins |
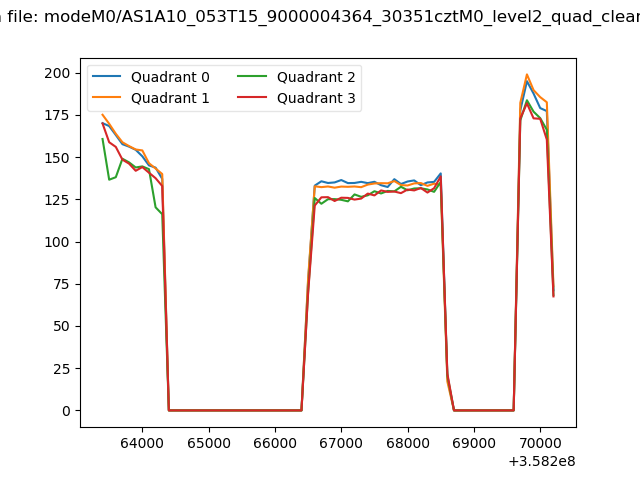 |
|
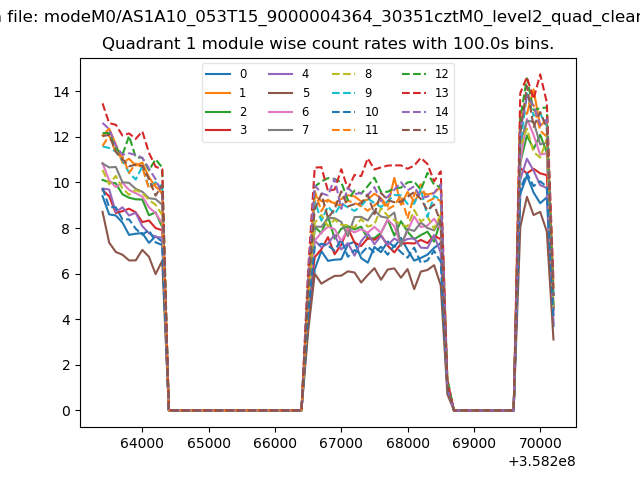
| Module-wise count rates for Quadrant A Data is divided into 100 sec bins |
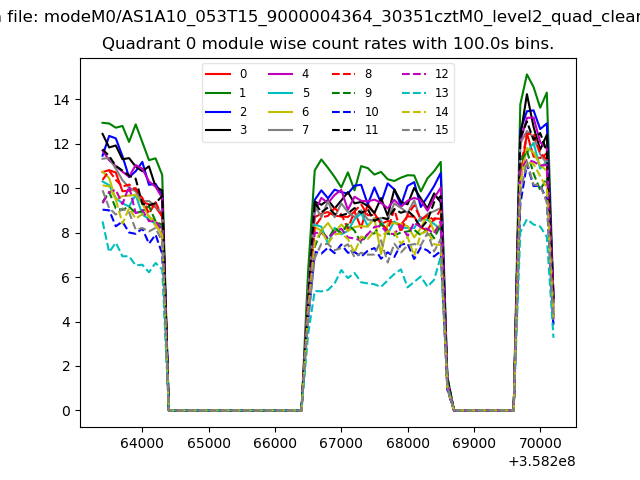 |
 |
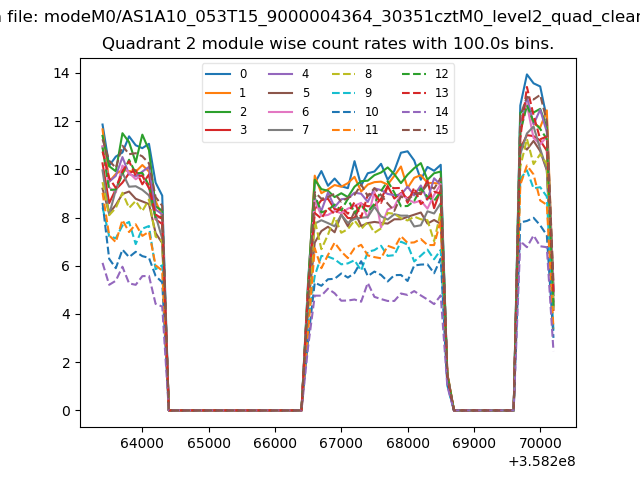
| Module-wise count rates for Quadrant B Data is divided into 100 sec bins |
 |
 |
| Module-wise count rates for Quadrant C Data is divided into 100 sec bins |
 |
 |
| Module-wise count rates for Quadrant D Data is divided into 100 sec bins |
 |
 |
| Parameter | Plot |
|---|---|
| CZT HV Monitor | 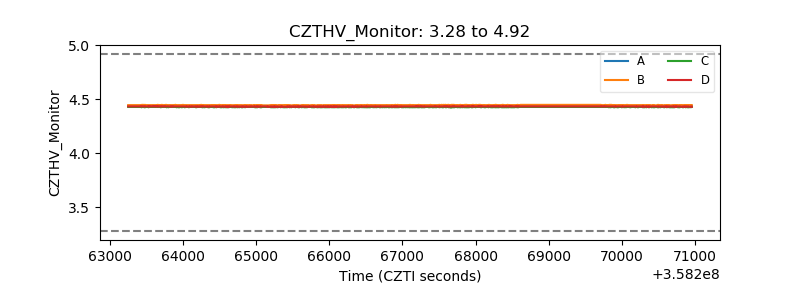 |
| D_VDD | 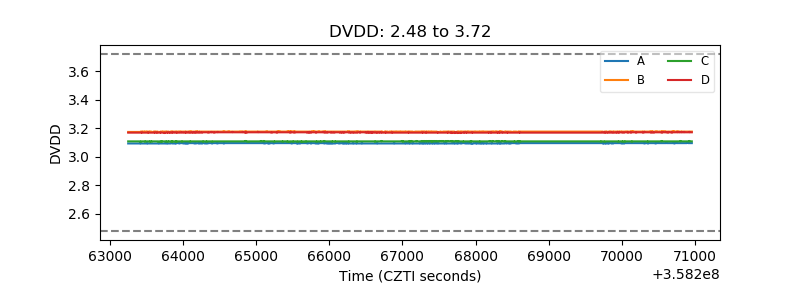 |
| Temperature 1 | 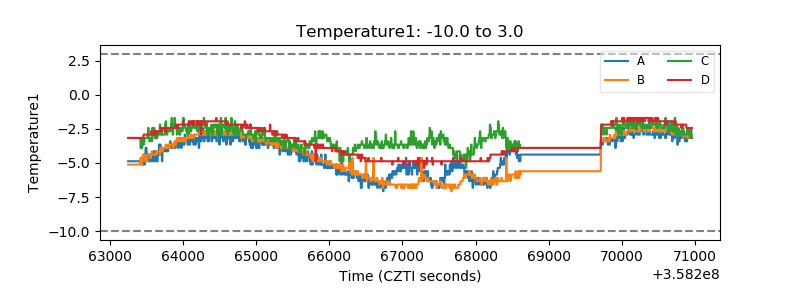 |
| Veto HV Monitor | 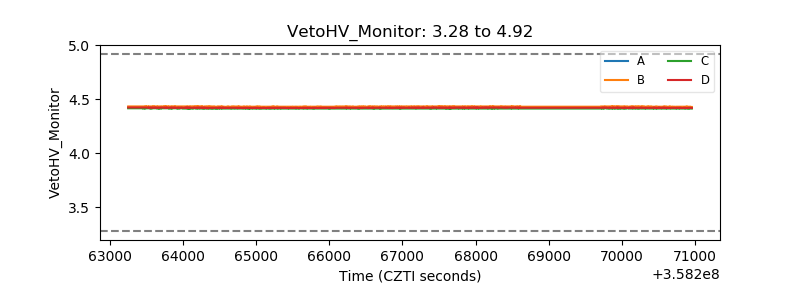 |
| Veto LLD | 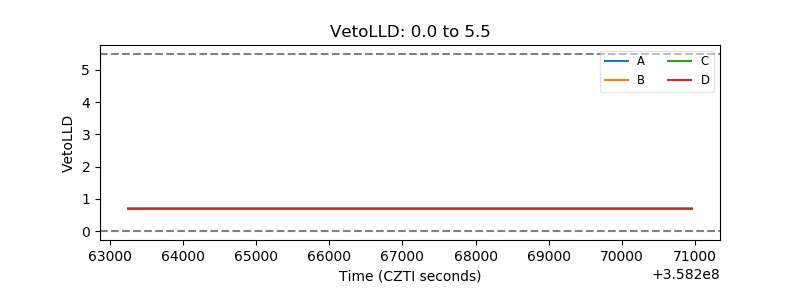 |
| Alpha Counter | 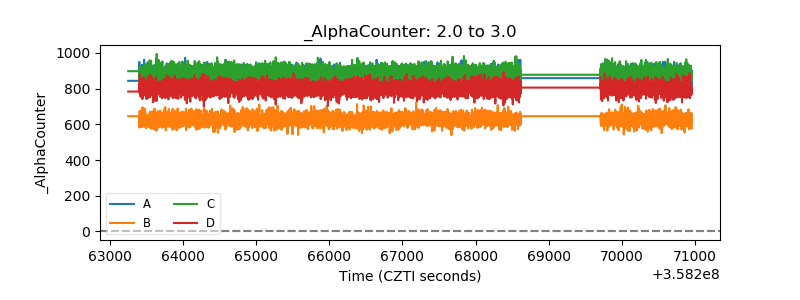 |
| _CPM_Rate | 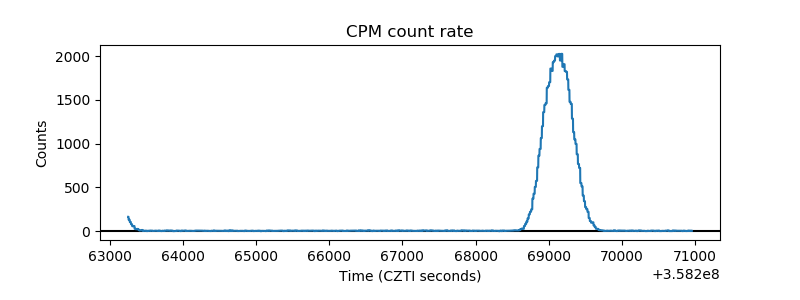 |
| CZT Counter | 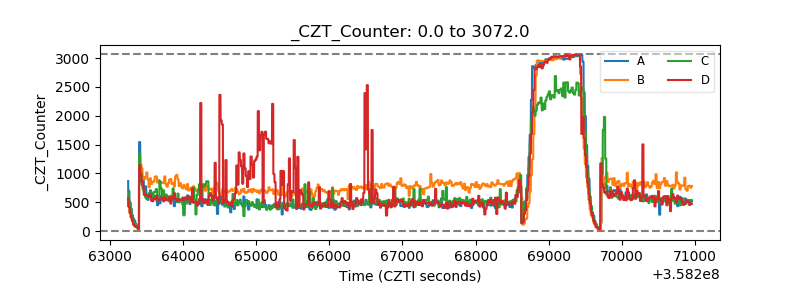 |
| +2.5 Volts monitor | 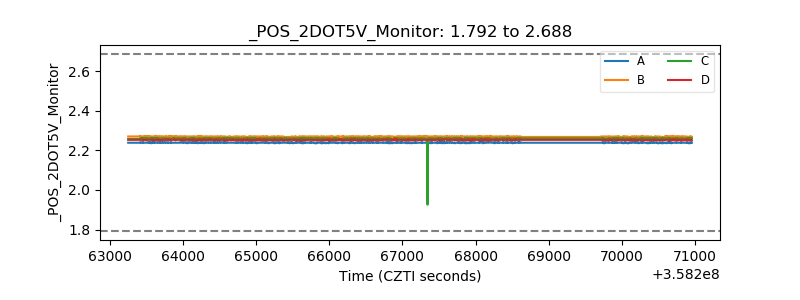 |
| +5 Volts monitor |  |
| _ROLL_ROT |  |
| _Roll_DEC |  |
| _Roll_RA | 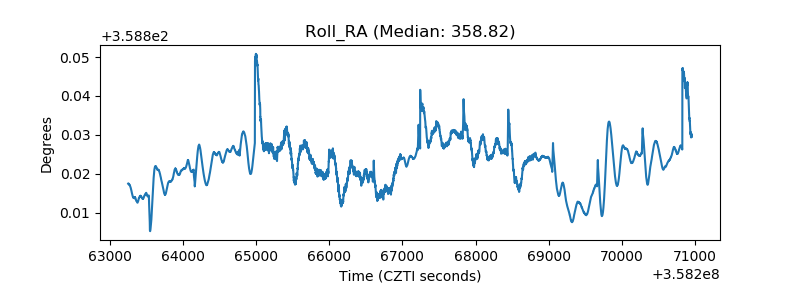 |
| Veto Counter | 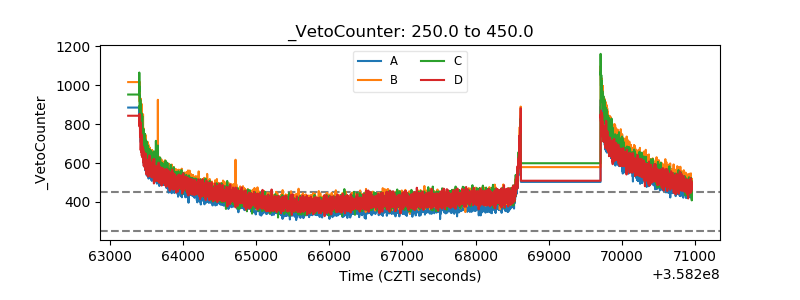 |