| Param | Original file | Final file |
|---|---|---|
| Filename | modeM0/AS1A10_053T15_9000004364_30352cztM0_level2.evt | modeM0/AS1A10_053T15_9000004364_30352cztM0_level2_quad_clean.evt |
| Size (bytes) | 587,312,640 | 65,162,880 |
| Size | 560.1 MB | 62.1 MB |
| Events in quadrant A | 3,181,401 | 401,098 |
| Events in quadrant B | 4,831,671 | 402,750 |
| Events in quadrant C | 4,350,006 | 375,026 |
| Events in quadrant D | 5,016,473 | 373,090 |
| Mode M0 | |||
|---|---|---|---|
| Quadrant | BADHDUFLAG | Total packets | Discarded packets |
| A | 0 | 13215 | 1 |
| B | 0 | 18313 | 1 |
| C | 0 | 16582 | 5 |
| D | 0 | 19105 | 1 |
| Mode M9 | |||
|---|---|---|---|
| Quadrant | BADHDUFLAG | Total packets | Discarded packets |
| A | 0 | 12 | 0 |
| B | 0 | 12 | 0 |
| C | 0 | 12 | 0 |
| D | 0 | 12 | 0 |
| Mode SS | |||
|---|---|---|---|
| Quadrant | BADHDUFLAG | Total packets | Discarded packets |
| A | 0 | 122 | 0 |
| B | 0 | 122 | 0 |
| C | 0 | 122 | 0 |
| D | 0 | 122 | 0 |
| Quadrant | Total seconds | Saturated seconds | Saturation percentage |
|---|---|---|---|
| A | 6031 | 61 | 1.011441% |
| B | 6031 | 92 | 1.525452% |
| C | 6030 | 492 | 8.159204% |
| D | 6031 | 76 | 1.260156% |
Noise dominated data is calculated using 1-second bins in cleaned event files. If a bin has >2000 counts, and if more than 50% of those come from <1% of pixels, then it is considered to be noise-dominated and hence unusable.
| Quadrant | # 1 sec bins | Bins with >0 counts | Bins with >2000 counts | High rate bins dominated by noise | Noise dominated (total time) | Noise dominated (detector-on time) | Marked lightcurve |
|---|---|---|---|---|---|---|---|
| A | 7241 | 6031 | 4 | 4 | 0.06% | 0.07% | 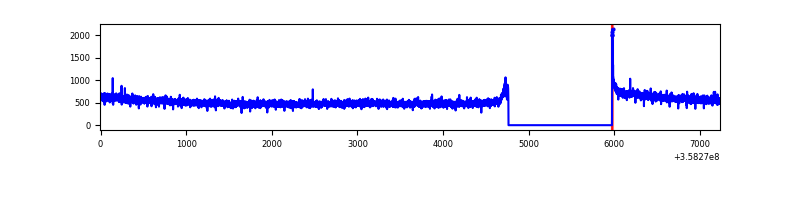 |
| B | 7241 | 6031 | 0 | 0 | 0.00% | 0.00% | 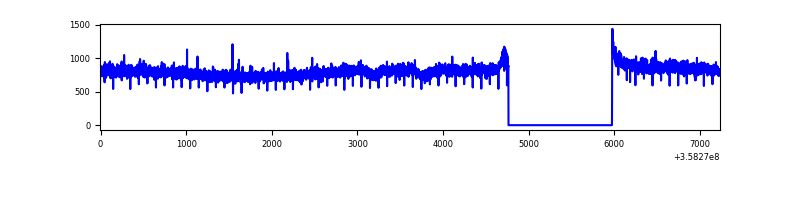 |
| C | 7240 | 6030 | 162 | 162 | 2.24% | 2.69% | 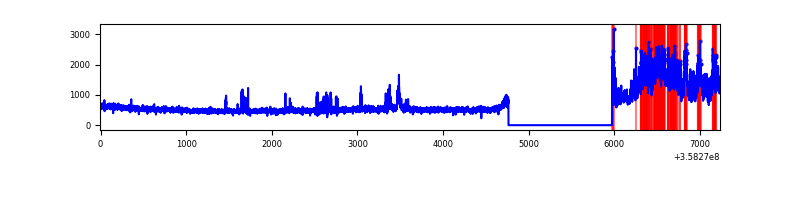 |
| D | 7241 | 6031 | 9 | 9 | 0.12% | 0.15% | 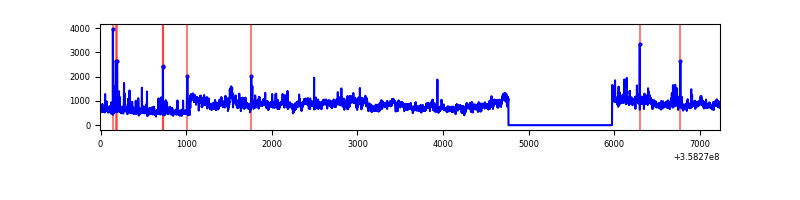 |
Top three noisy pixels from each quadrant. If the there are fewer than three noisy pixels in the level2.evt file, extra rows are filled as -1
| Pixel properties | Quadrant properties | ||||||
|---|---|---|---|---|---|---|---|
| Quadrant | DetID | PixID | Counts | Sigma | Mean | Median | Sigma |
| A | 8 | 192 | 13406 | 78.09 | 820 | 808 | 161.3 |
| A | 13 | 254 | 11157 | 64.15 | 820 | 808 | 161.3 |
| A | 3 | 137 | 7874 | 43.8 | 820 | 808 | 161.3 |
| B | 6 | 159 | 1658342 | 10900.87 | 809 | 789 | 152.1 |
| B | 12 | 111 | 17913 | 112.62 | 809 | 789 | 152.1 |
| B | 11 | 111 | 16564 | 103.74 | 809 | 789 | 152.1 |
| C | 3 | 233 | 1164077 | 6706.12 | 755 | 761 | 173.5 |
| C | 14 | 238 | 156208 | 896.1 | 755 | 761 | 173.5 |
| C | 14 | 254 | 43872 | 248.52 | 755 | 761 | 173.5 |
| D | 1 | 52 | 1776002 | 9128.57 | 777 | 761 | 194.5 |
| D | 2 | 250 | 110847 | 566.08 | 777 | 761 | 194.5 |
| D | 8 | 195 | 102123 | 521.22 | 777 | 761 | 194.5 |
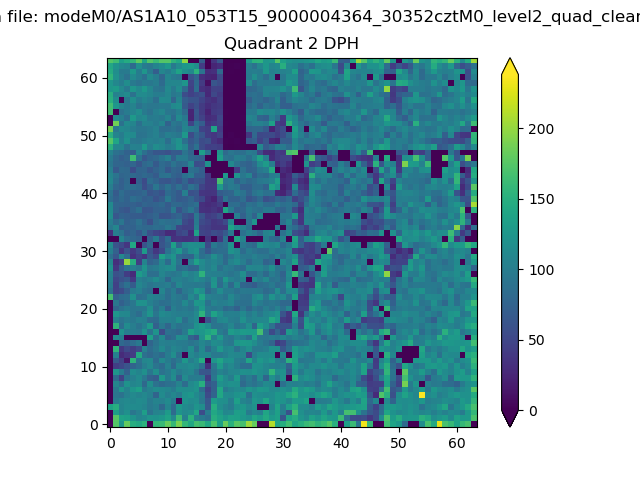
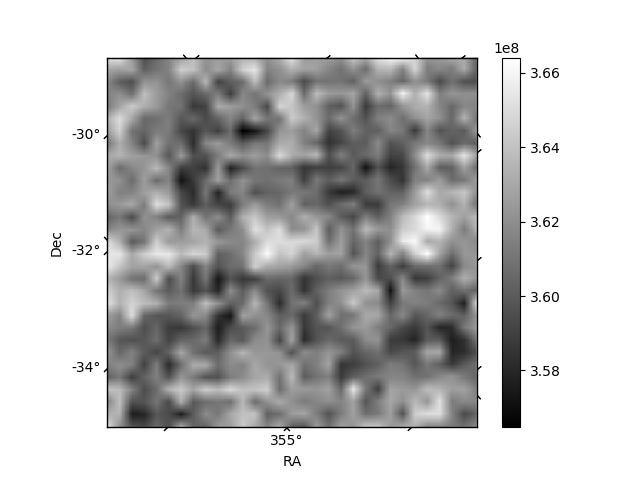
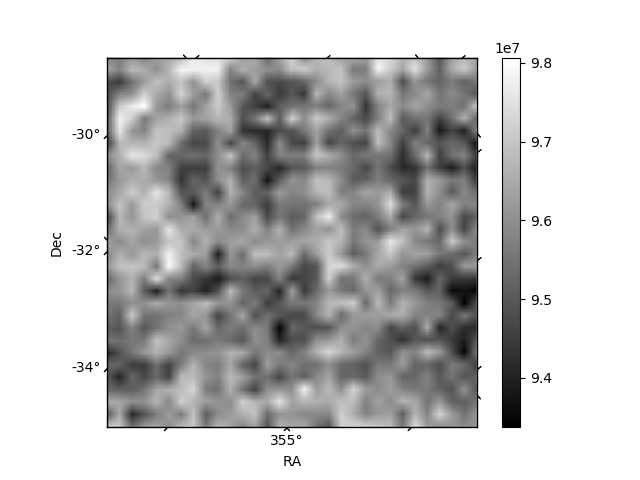
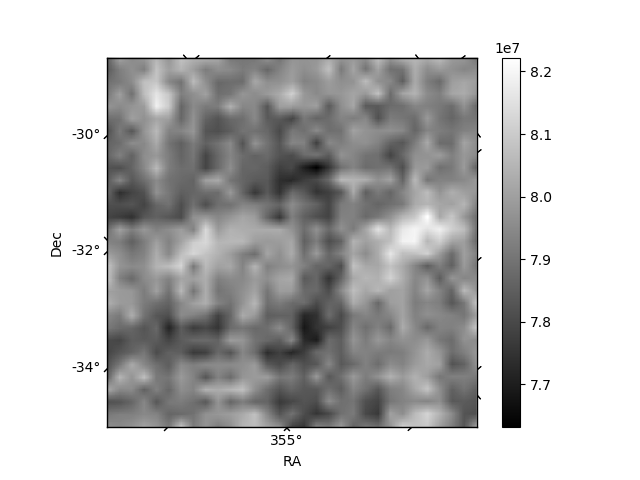
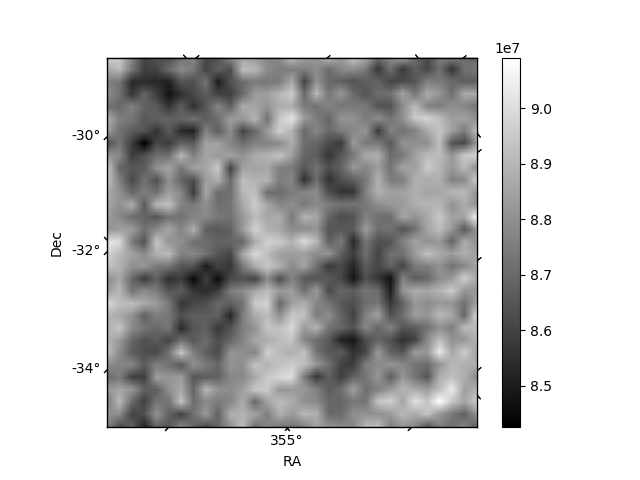
Histogram calculated using DETX and DETY for each event in the final _common_clean file
| Quadrant A | 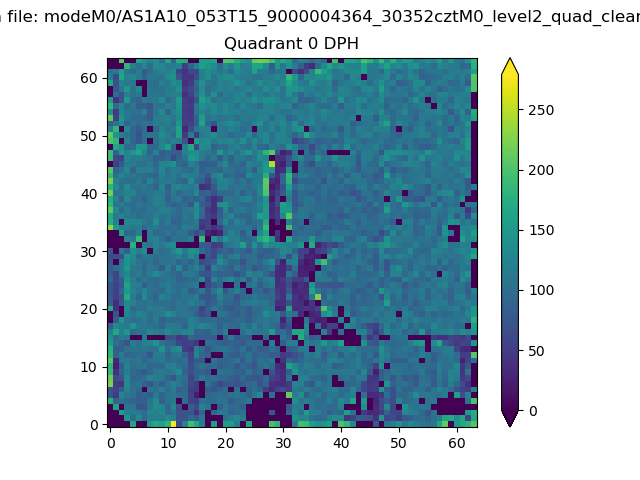 |
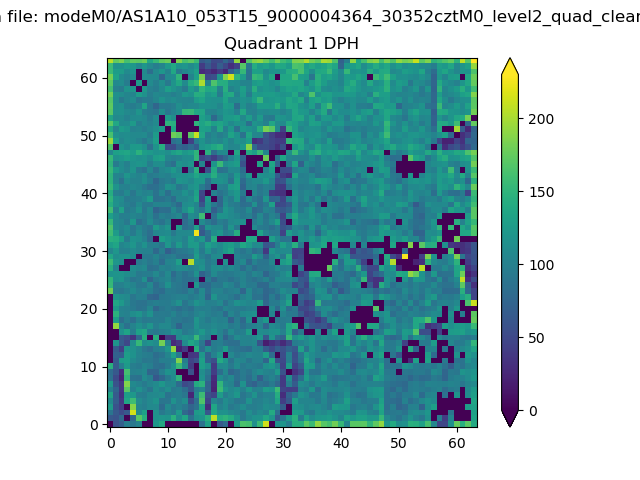 |
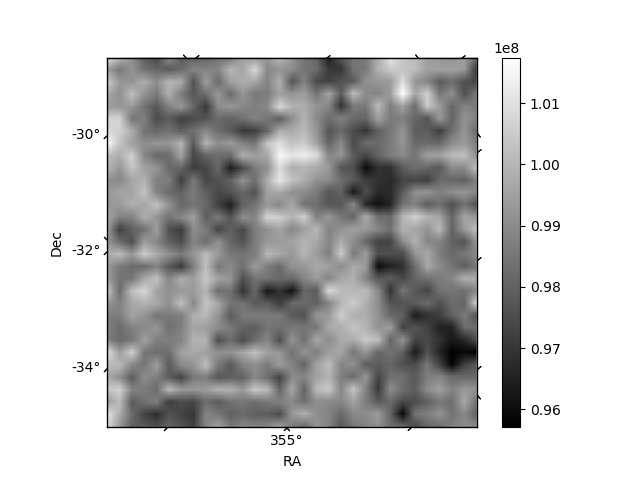
Quadrant B |
|---|---|---|---|
| Quadrant D | 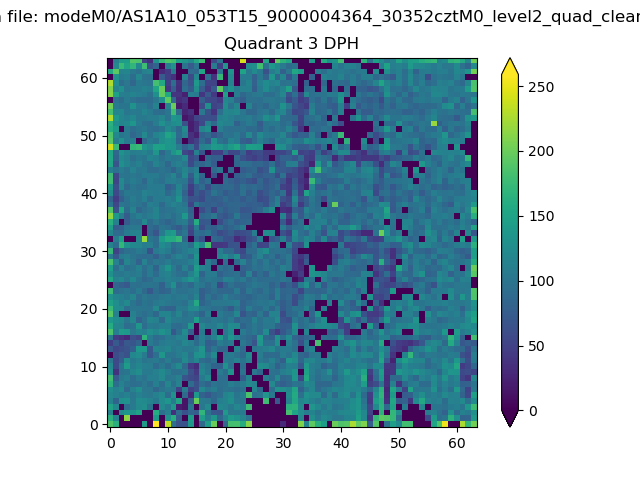 |
 |
Quadrant C |
| Plot type | Count rate plots | Images |
|---|---|---|
| Comparison with Poisson distribution Blue bars denote a histogram of data divided into 1 sec bins. Red curve is a Poisson curve with rate = median count rate of data. |
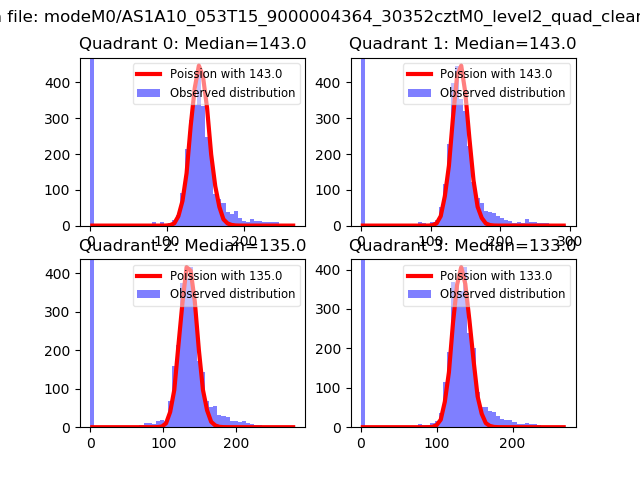 |
 |
| Quadrant-wise count rates Data is divided into 100 sec bins |
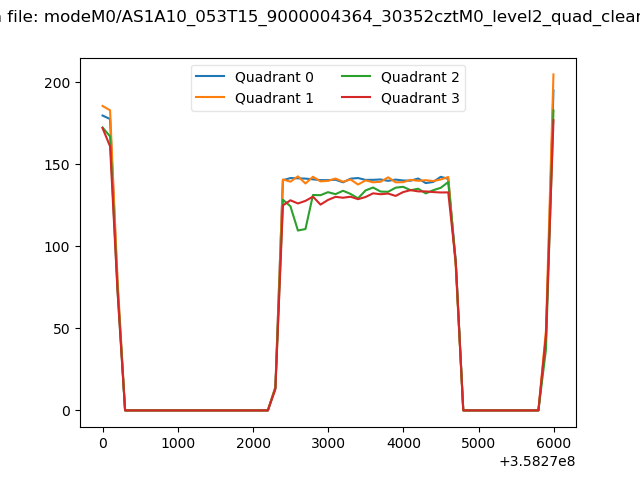 |
|
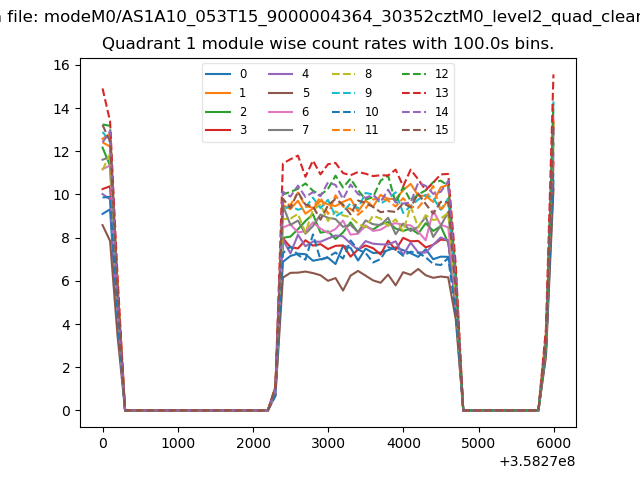
| Module-wise count rates for Quadrant A Data is divided into 100 sec bins |
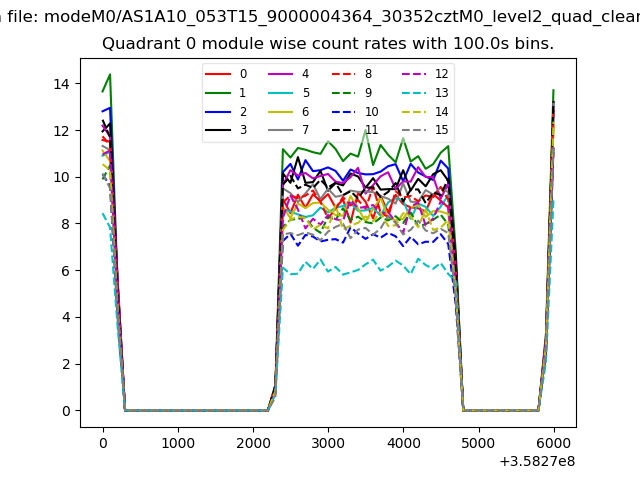 |
 |
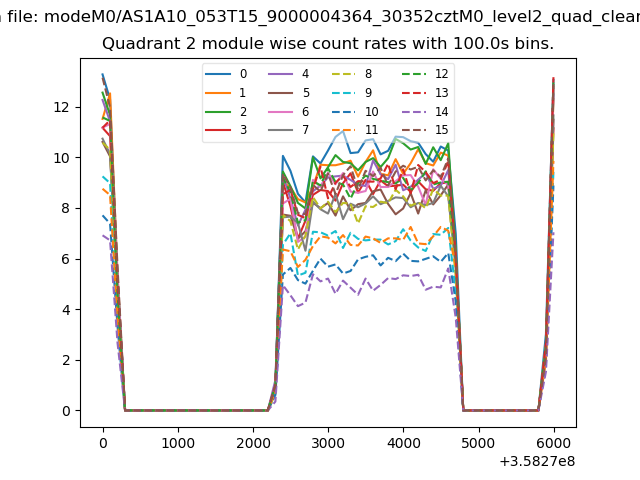
| Module-wise count rates for Quadrant B Data is divided into 100 sec bins |
 |
 |
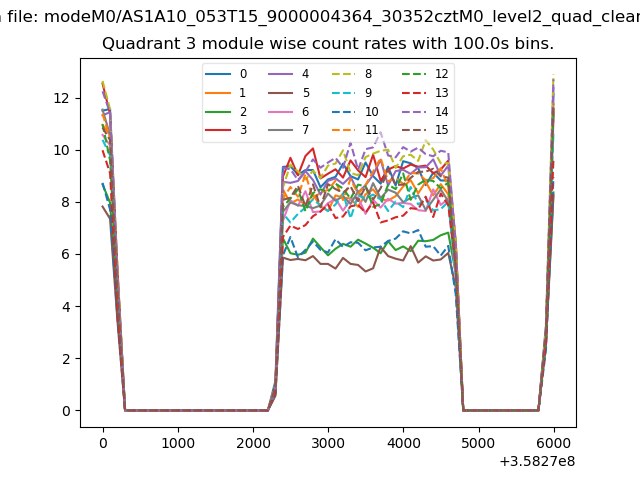
| Module-wise count rates for Quadrant C Data is divided into 100 sec bins |
 |
 |
| Module-wise count rates for Quadrant D Data is divided into 100 sec bins |
 |
 |
| Parameter | Plot |
|---|---|
| CZT HV Monitor | 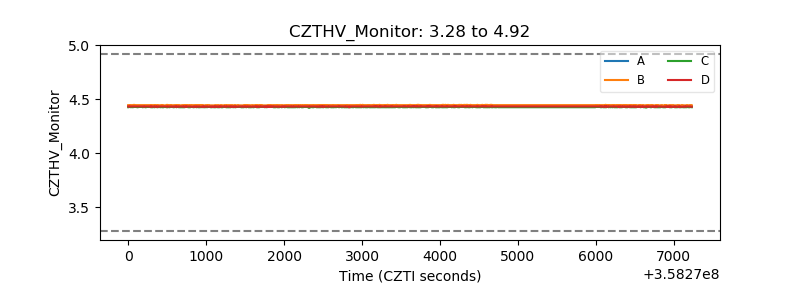 |
| D_VDD | 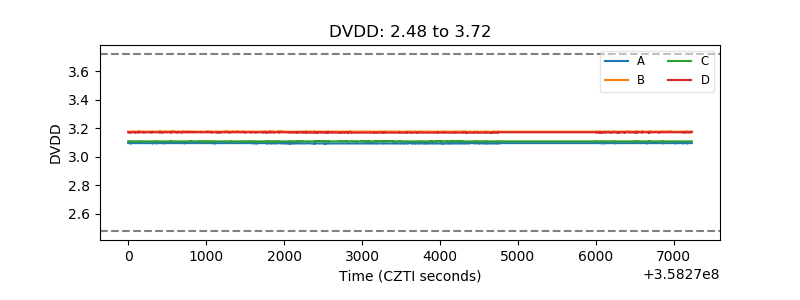 |
| Temperature 1 | 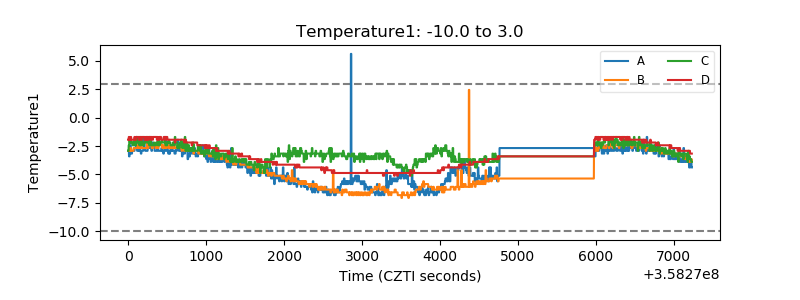 |
| Veto HV Monitor |  |
| Veto LLD | 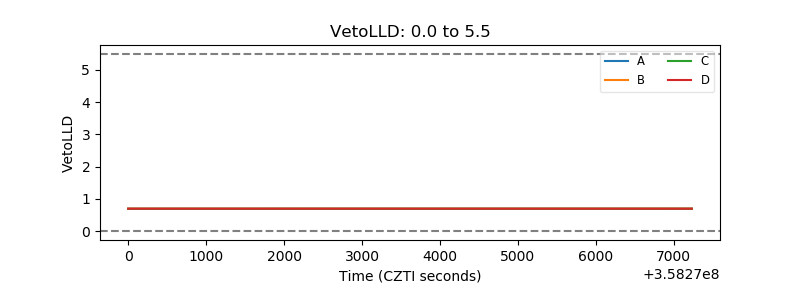 |
| Alpha Counter | 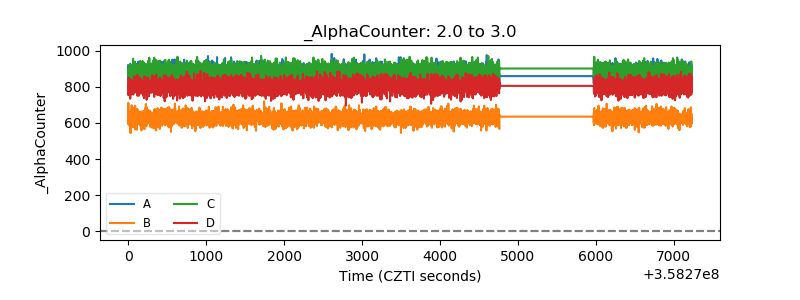 |
| _CPM_Rate | 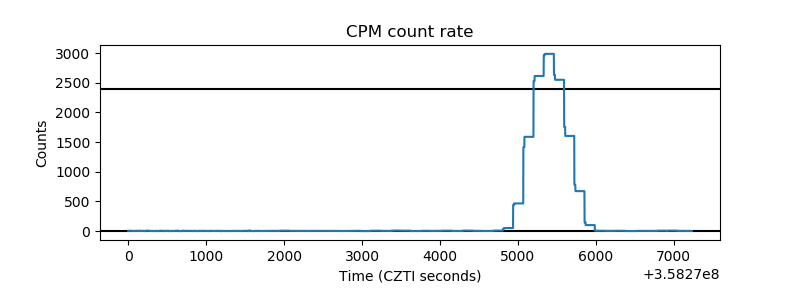 |
| CZT Counter | 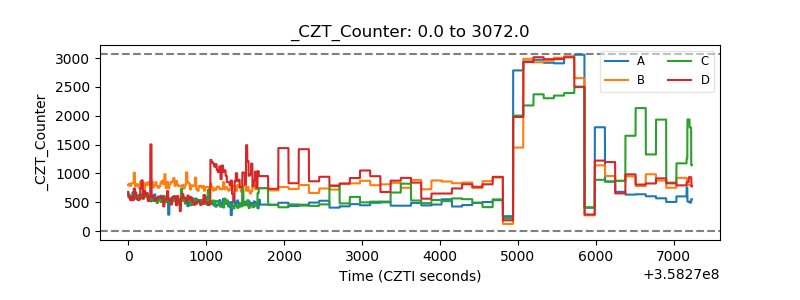 |
| +2.5 Volts monitor | 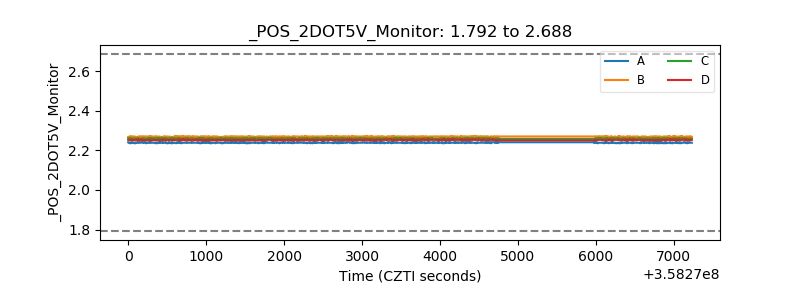 |
| +5 Volts monitor | 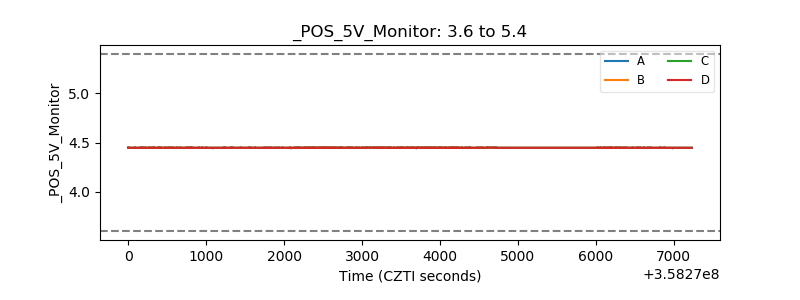 |
| _ROLL_ROT | 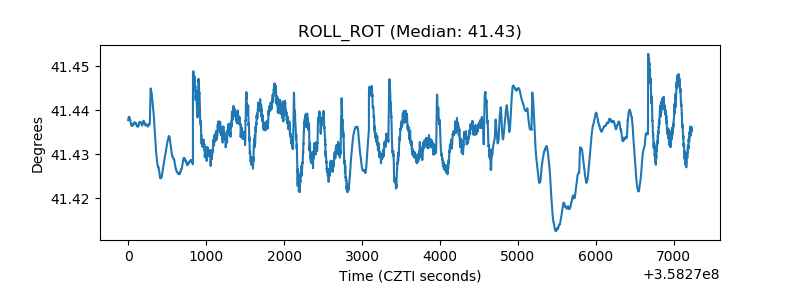 |
| _Roll_DEC | 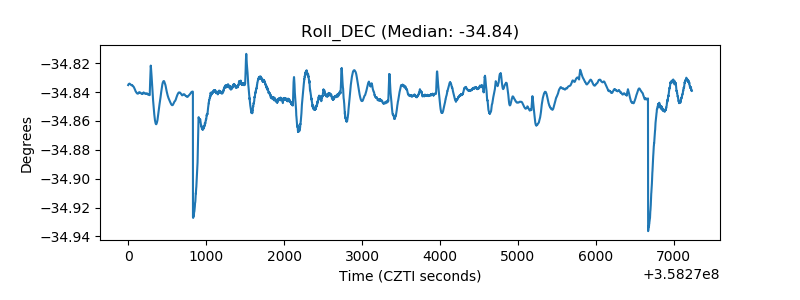 |
| _Roll_RA | 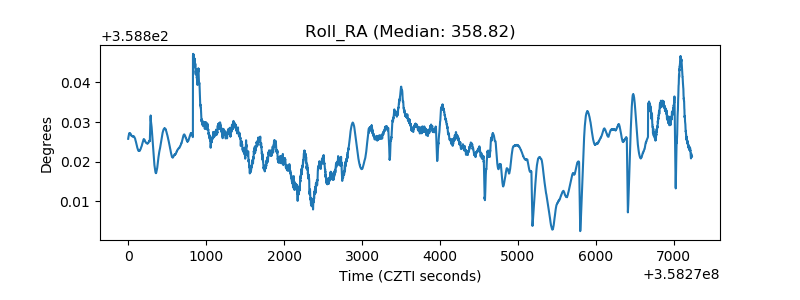 |
| Veto Counter | 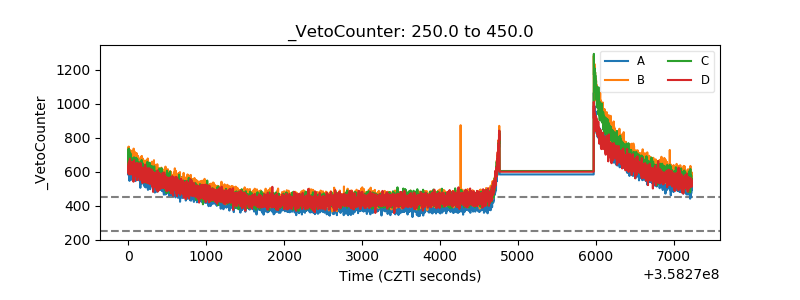 |