| Param | Original file | Final file |
|---|---|---|
| Filename | modeM0/AS1A10_053T15_9000004364_30353cztM0_level2.evt | modeM0/AS1A10_053T15_9000004364_30353cztM0_level2_quad_clean.evt |
| Size (bytes) | 715,291,200 | 68,509,440 |
| Size | 682.2 MB | 65.3 MB |
| Events in quadrant A | 3,511,413 | 423,393 |
| Events in quadrant B | 5,213,346 | 424,777 |
| Events in quadrant C | 7,895,918 | 393,294 |
| Events in quadrant D | 4,623,950 | 399,787 |
| Mode M0 | |||
|---|---|---|---|
| Quadrant | BADHDUFLAG | Total packets | Discarded packets |
| A | 0 | 14332 | 2 |
| B | 0 | 19320 | 2 |
| C | 0 | 27919 | 2 |
| D | 0 | 17699 | 2 |
| Mode M9 | |||
|---|---|---|---|
| Quadrant | BADHDUFLAG | Total packets | Discarded packets |
| A | 0 | 14 | 0 |
| B | 0 | 15 | 0 |
| C | 0 | 15 | 0 |
| D | 0 | 15 | 0 |
| Mode SS | |||
|---|---|---|---|
| Quadrant | BADHDUFLAG | Total packets | Discarded packets |
| A | 0 | 126 | 0 |
| B | 0 | 126 | 0 |
| C | 0 | 126 | 0 |
| D | 0 | 126 | 0 |
| Quadrant | Total seconds | Saturated seconds | Saturation percentage |
|---|---|---|---|
| A | 6204 | 96 | 1.547389% |
| B | 6204 | 132 | 2.127660% |
| C | 6204 | 1285 | 20.712444% |
| D | 6204 | 207 | 3.336557% |
Noise dominated data is calculated using 1-second bins in cleaned event files. If a bin has >2000 counts, and if more than 50% of those come from <1% of pixels, then it is considered to be noise-dominated and hence unusable.
| Quadrant | # 1 sec bins | Bins with >0 counts | Bins with >2000 counts | High rate bins dominated by noise | Noise dominated (total time) | Noise dominated (detector-on time) | Marked lightcurve |
|---|---|---|---|---|---|---|---|
| A | 7504 | 6204 | 7 | 7 | 0.09% | 0.11% | 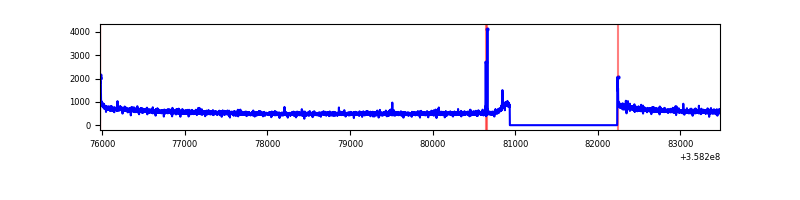 |
| B | 7504 | 6204 | 0 | 0 | 0.00% | 0.00% | 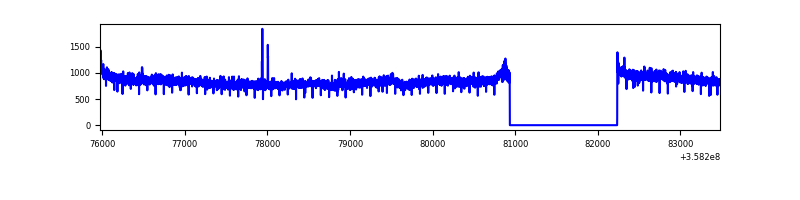 |
| C | 7504 | 6204 | 688 | 688 | 9.17% | 11.09% | 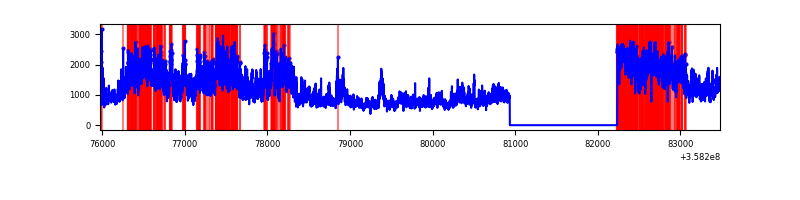 |
| D | 7504 | 6204 | 140 | 140 | 1.87% | 2.26% | 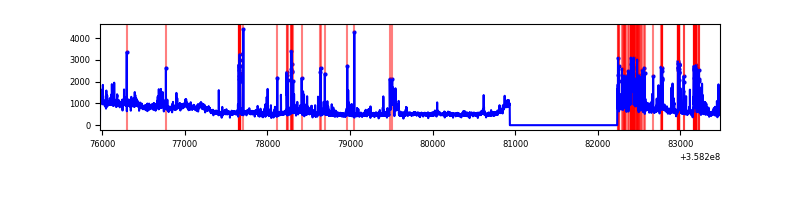 |
Top three noisy pixels from each quadrant. If the there are fewer than three noisy pixels in the level2.evt file, extra rows are filled as -1
| Pixel properties | Quadrant properties | ||||||
|---|---|---|---|---|---|---|---|
| Quadrant | DetID | PixID | Counts | Sigma | Mean | Median | Sigma |
| A | 8 | 192 | 25177 | 138.98 | 895 | 879 | 174.8 |
| A | 14 | 239 | 24442 | 134.77 | 895 | 879 | 174.8 |
| A | 13 | 254 | 11634 | 61.51 | 895 | 879 | 174.8 |
| B | 6 | 159 | 1716843 | 10483.37 | 885 | 867 | 163.7 |
| B | 12 | 111 | 19271 | 112.44 | 885 | 867 | 163.7 |
| B | 11 | 111 | 17536 | 101.84 | 885 | 867 | 163.7 |
| C | 3 | 233 | 4571701 | 24893.95 | 802 | 810 | 183.6 |
| C | 14 | 238 | 134790 | 729.68 | 802 | 810 | 183.6 |
| C | 0 | 10 | 44090 | 235.71 | 802 | 810 | 183.6 |
| D | 1 | 52 | 743487 | 3477.29 | 839 | 823 | 213.6 |
| D | 12 | 233 | 334544 | 1562.54 | 839 | 823 | 213.6 |
| D | 2 | 250 | 156545 | 729.12 | 839 | 823 | 213.6 |
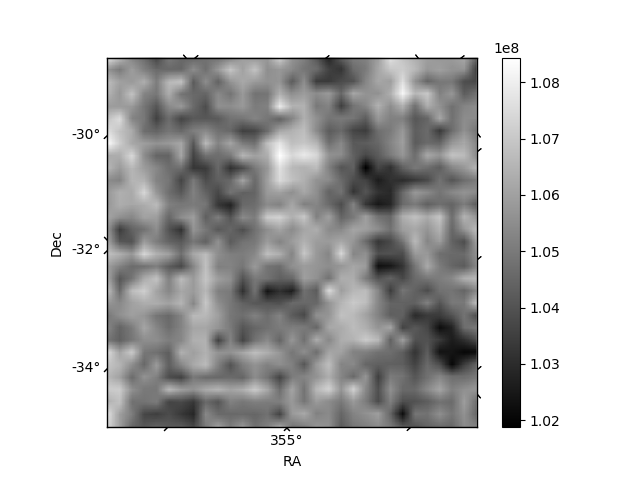
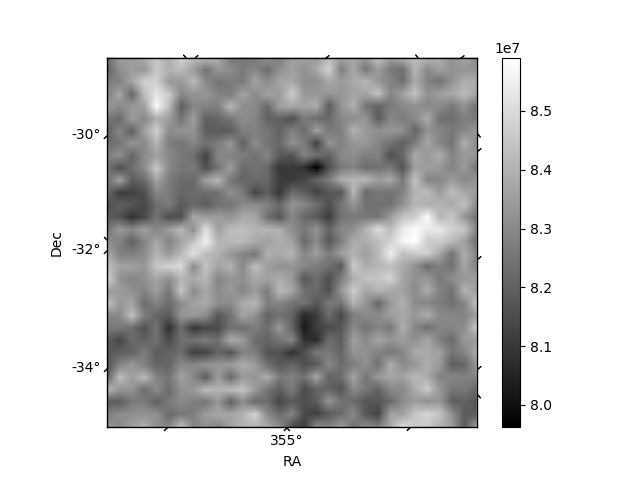
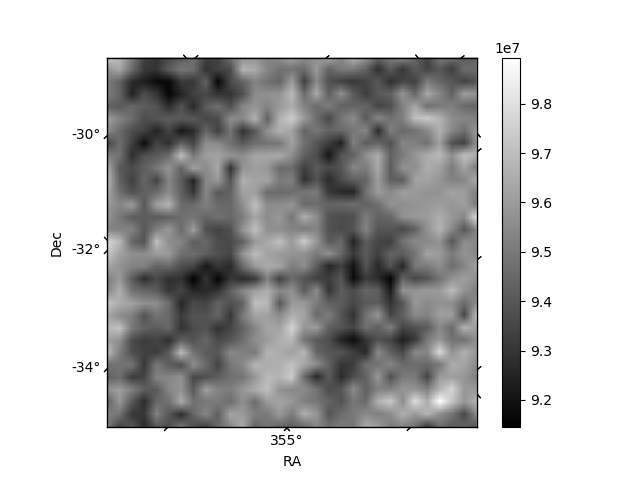
Histogram calculated using DETX and DETY for each event in the final _common_clean file
| Quadrant A | 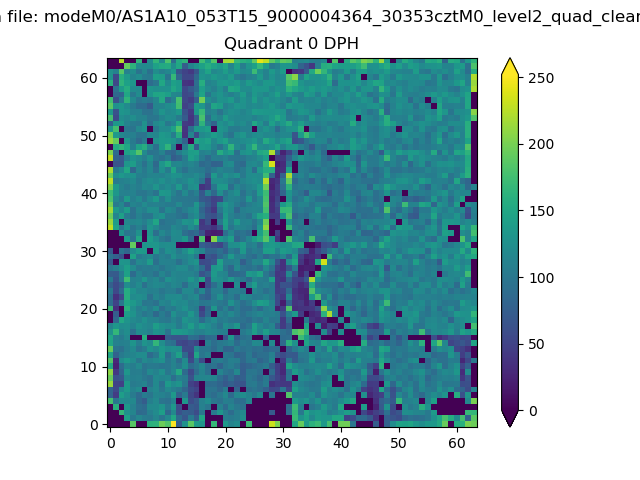 |
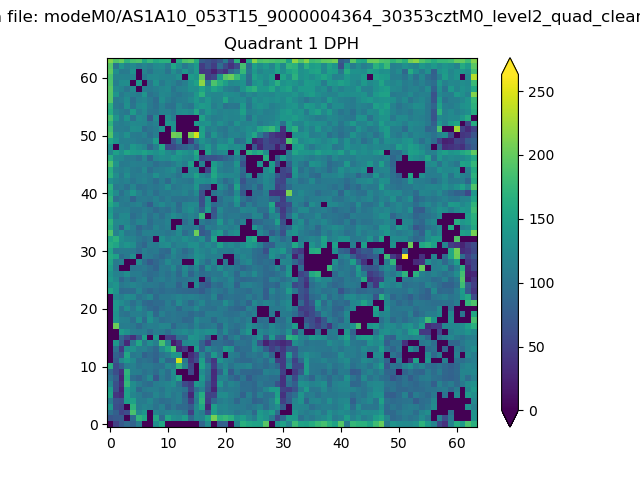 |
Quadrant B |
|---|---|---|---|
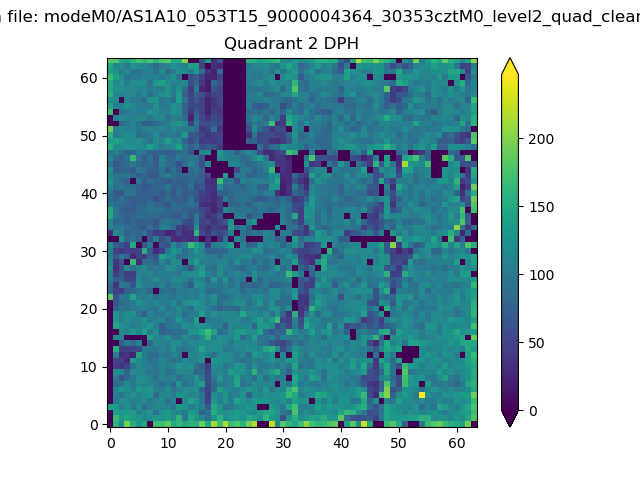
| Quadrant D | 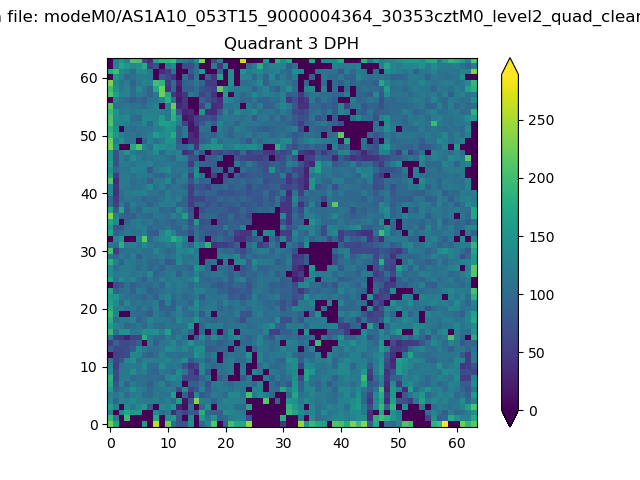 |
 |
Quadrant C |
| Plot type | Count rate plots | Images |
|---|---|---|
| Comparison with Poisson distribution Blue bars denote a histogram of data divided into 1 sec bins. Red curve is a Poisson curve with rate = median count rate of data. |
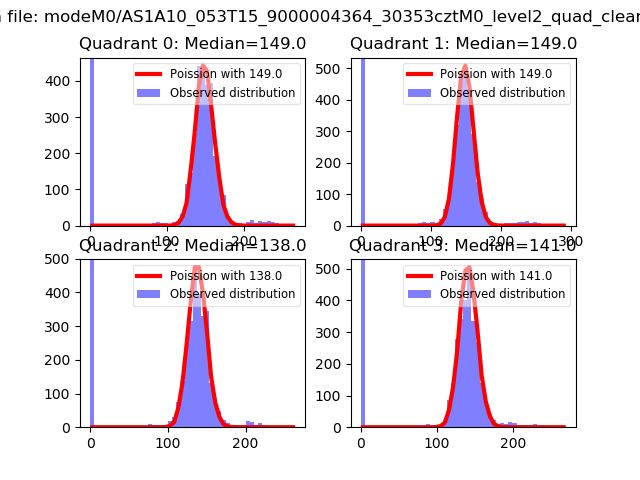 |
 |
| Quadrant-wise count rates Data is divided into 100 sec bins |
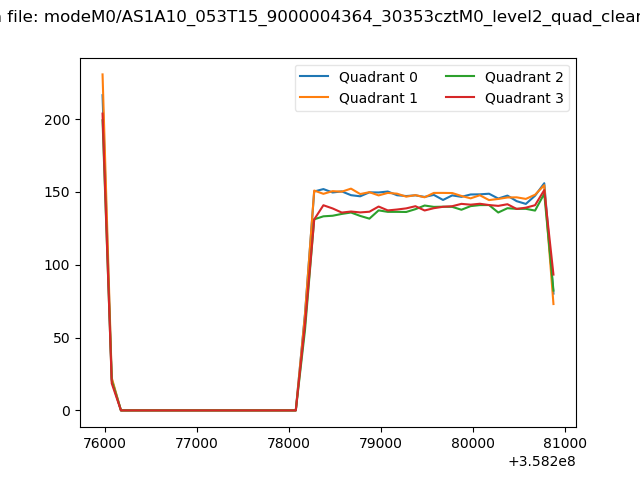 |
|
| Module-wise count rates for Quadrant A Data is divided into 100 sec bins |
 |
 |
| Module-wise count rates for Quadrant B Data is divided into 100 sec bins |
 |
 |
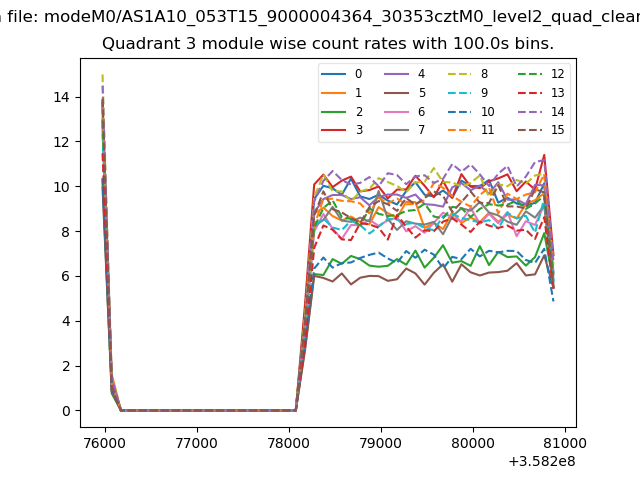
| Module-wise count rates for Quadrant C Data is divided into 100 sec bins |
 |
 |
| Module-wise count rates for Quadrant D Data is divided into 100 sec bins |
 |
 |
| Parameter | Plot |
|---|---|
| CZT HV Monitor |  |
| D_VDD | 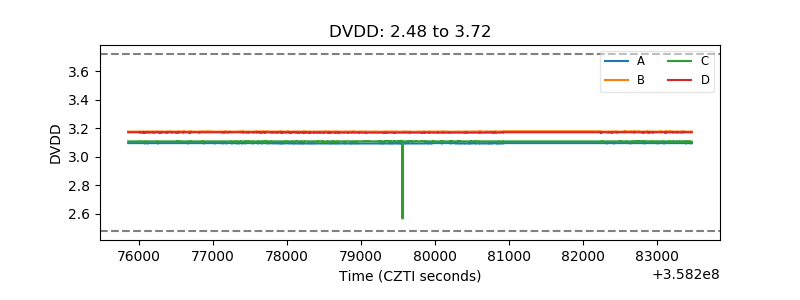 |
| Temperature 1 | 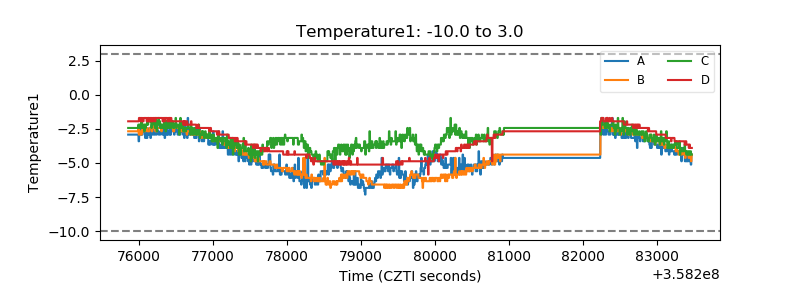 |
| Veto HV Monitor | 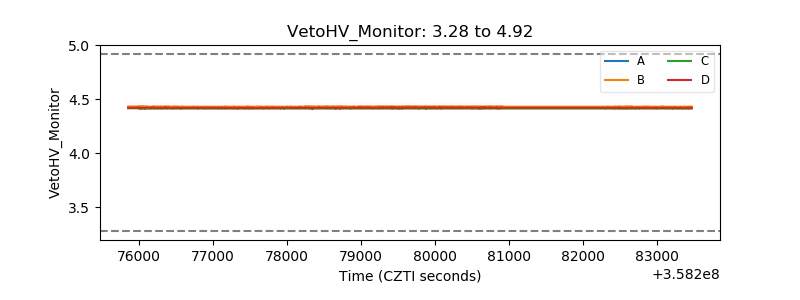 |
| Veto LLD | 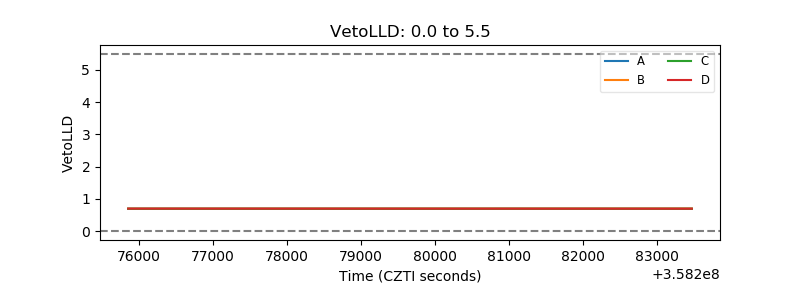 |
| Alpha Counter | 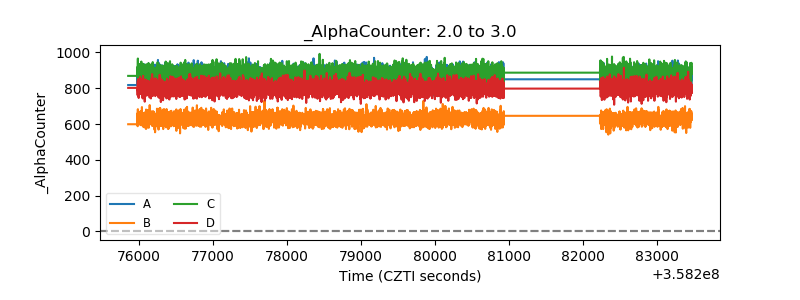 |
| _CPM_Rate | 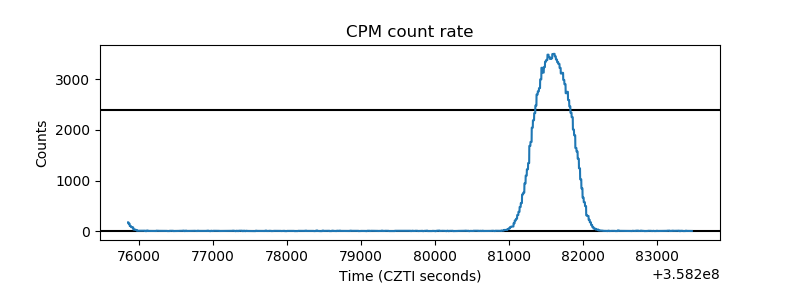 |
| CZT Counter | 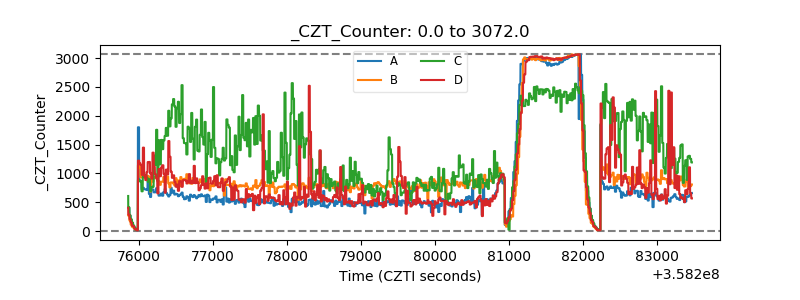 |
| +2.5 Volts monitor |  |
| +5 Volts monitor |  |
| _ROLL_ROT | 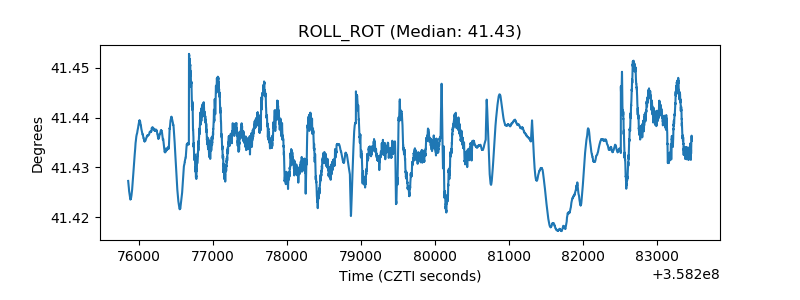 |
| _Roll_DEC | 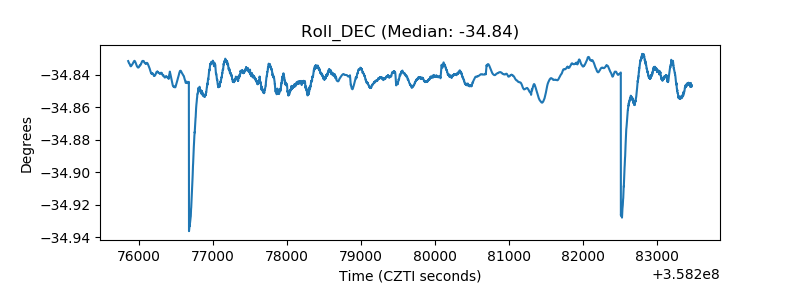 |
| _Roll_RA | 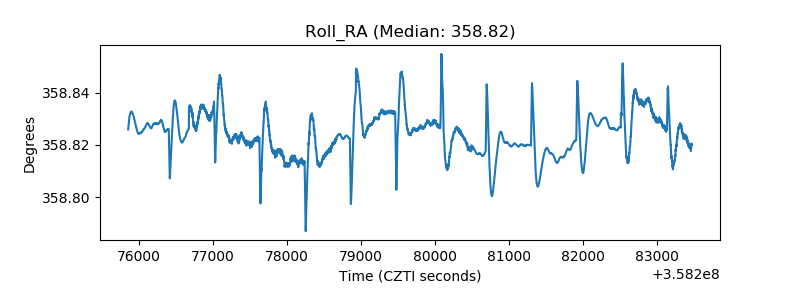 |
| Veto Counter |  |