| Param | Original file | Final file |
|---|---|---|
| Filename | modeM0/AS1A10_053T15_9000004364_30356cztM0_level2.evt | modeM0/AS1A10_053T15_9000004364_30356cztM0_level2_quad_clean.evt |
| Size (bytes) | 640,569,600 | 97,398,720 |
| Size | 610.9 MB | 92.9 MB |
| Events in quadrant A | 3,362,173 | 641,519 |
| Events in quadrant B | 5,282,563 | 644,908 |
| Events in quadrant C | 6,556,417 | 597,686 |
| Events in quadrant D | 3,760,956 | 613,450 |
| Mode M0 | |||
|---|---|---|---|
| Quadrant | BADHDUFLAG | Total packets | Discarded packets |
| A | 0 | 13841 | 2 |
| B | 0 | 19667 | 2 |
| C | 0 | 24186 | 2 |
| D | 0 | 15197 | 2 |
| Mode M9 | |||
|---|---|---|---|
| Quadrant | BADHDUFLAG | Total packets | Discarded packets |
| A | 0 | 24 | 0 |
| B | 0 | 25 | 0 |
| C | 0 | 25 | 0 |
| D | 0 | 25 | 0 |
| Mode SS | |||
|---|---|---|---|
| Quadrant | BADHDUFLAG | Total packets | Discarded packets |
| A | 0 | 134 | 0 |
| B | 0 | 134 | 0 |
| C | 0 | 134 | 0 |
| D | 0 | 134 | 0 |
| Quadrant | Total seconds | Saturated seconds | Saturation percentage |
|---|---|---|---|
| A | 6480 | 86 | 1.327160% |
| B | 6480 | 136 | 2.098765% |
| C | 6480 | 547 | 8.441358% |
| D | 6480 | 129 | 1.990741% |
Noise dominated data is calculated using 1-second bins in cleaned event files. If a bin has >2000 counts, and if more than 50% of those come from <1% of pixels, then it is considered to be noise-dominated and hence unusable.
| Quadrant | # 1 sec bins | Bins with >0 counts | Bins with >2000 counts | High rate bins dominated by noise | Noise dominated (total time) | Noise dominated (detector-on time) | Marked lightcurve |
|---|---|---|---|---|---|---|---|
| A | 7625 | 6480 | 2 | 2 | 0.03% | 0.03% | 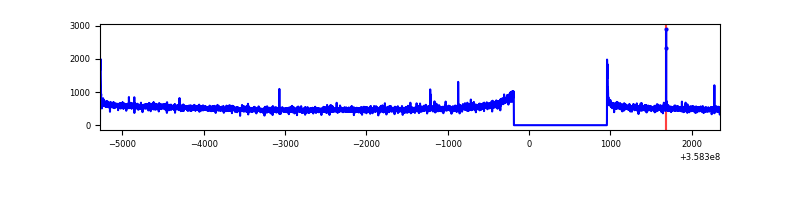 |
| B | 7625 | 6480 | 1 | 1 | 0.01% | 0.02% | 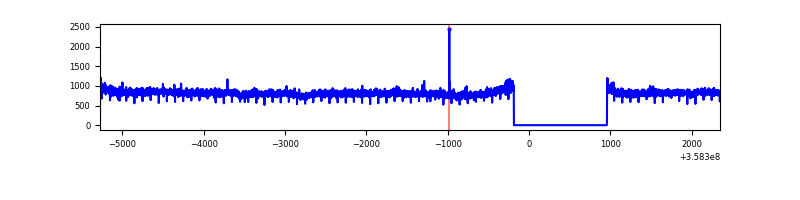 |
| C | 7625 | 6480 | 138 | 138 | 1.81% | 2.13% | 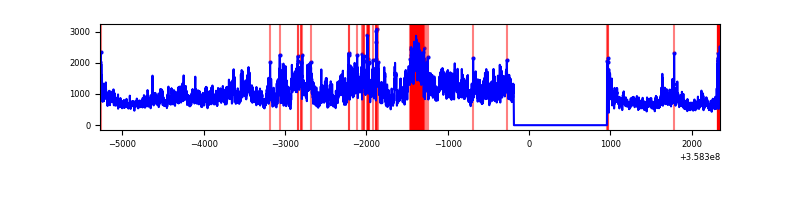 |
| D | 7625 | 6481 | 50 | 50 | 0.66% | 0.77% | 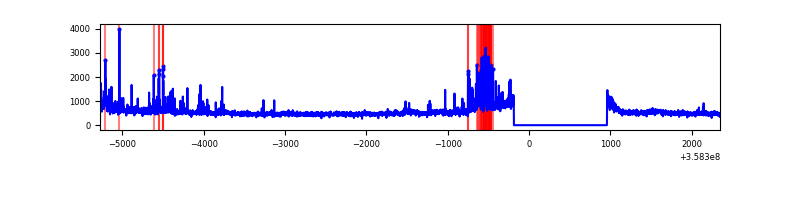 |
Top three noisy pixels from each quadrant. If the there are fewer than three noisy pixels in the level2.evt file, extra rows are filled as -1
| Pixel properties | Quadrant properties | ||||||
|---|---|---|---|---|---|---|---|
| Quadrant | DetID | PixID | Counts | Sigma | Mean | Median | Sigma |
| A | 8 | 192 | 26260 | 150.47 | 862 | 846 | 168.9 |
| A | 13 | 254 | 12363 | 68.19 | 862 | 846 | 168.9 |
| A | 3 | 137 | 8401 | 44.73 | 862 | 846 | 168.9 |
| B | 6 | 159 | 1927344 | 11937.42 | 854 | 833 | 161.4 |
| B | 12 | 111 | 19586 | 116.2 | 854 | 833 | 161.4 |
| B | 11 | 111 | 18064 | 106.77 | 854 | 833 | 161.4 |
| C | 3 | 233 | 3160838 | 16895.26 | 815 | 822 | 187.0 |
| C | 14 | 238 | 136449 | 725.14 | 815 | 822 | 187.0 |
| C | 4 | 224 | 32869 | 171.34 | 815 | 822 | 187.0 |
| D | 8 | 195 | 276165 | 1342.91 | 832 | 812 | 205.0 |
| D | 12 | 233 | 161599 | 784.17 | 832 | 812 | 205.0 |
| D | 2 | 250 | 145824 | 707.23 | 832 | 812 | 205.0 |
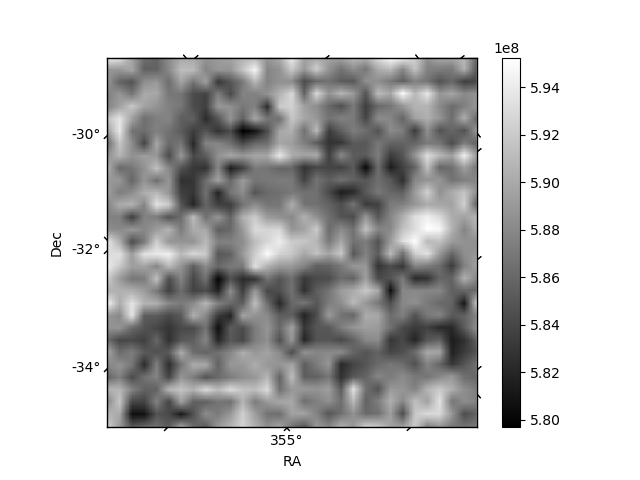
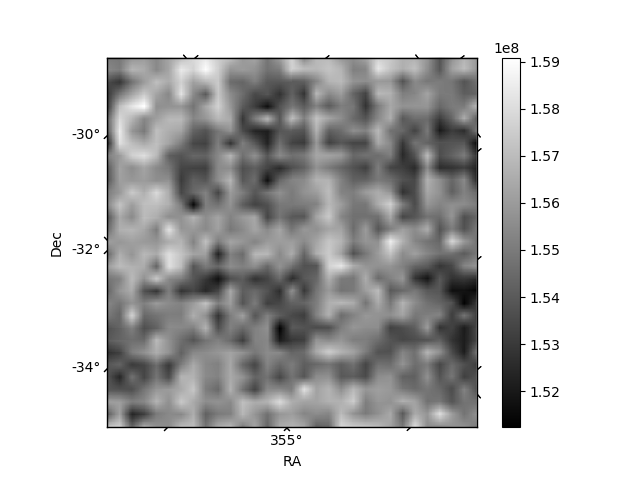
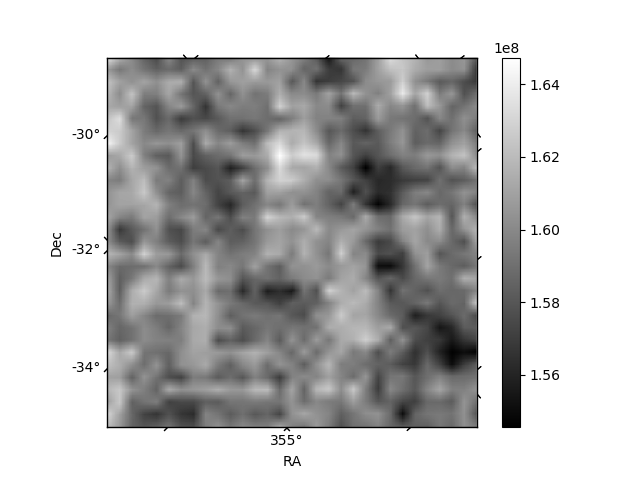
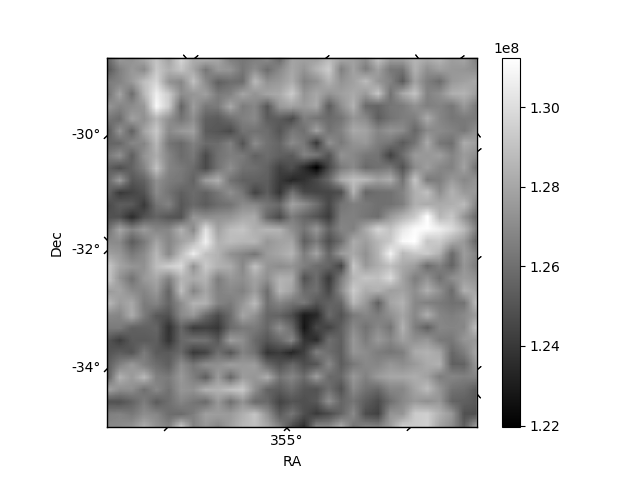
Histogram calculated using DETX and DETY for each event in the final _common_clean file
| Quadrant A | 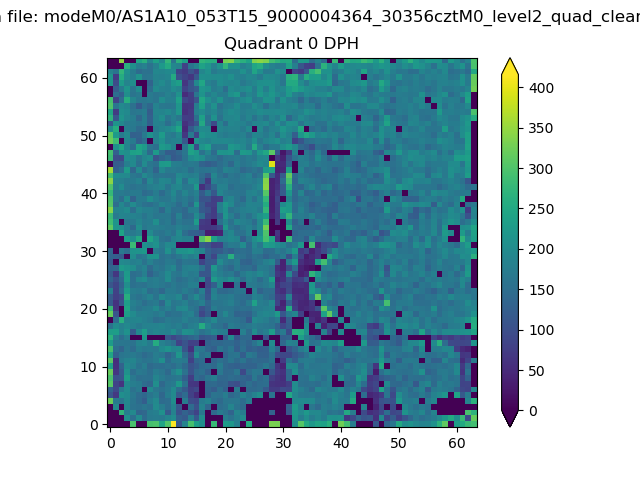 |
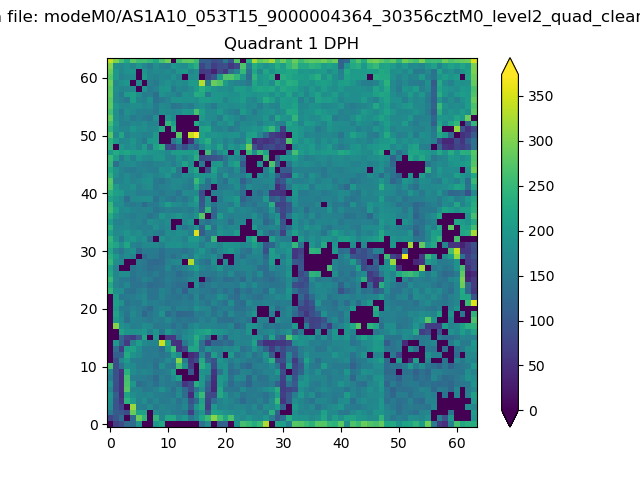 |
Quadrant B |
|---|---|---|---|
| Quadrant D | 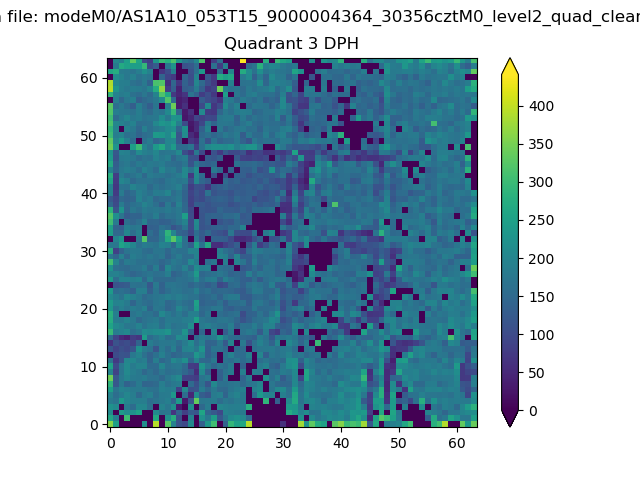 |
 |
Quadrant C |
| Plot type | Count rate plots | Images |
|---|---|---|
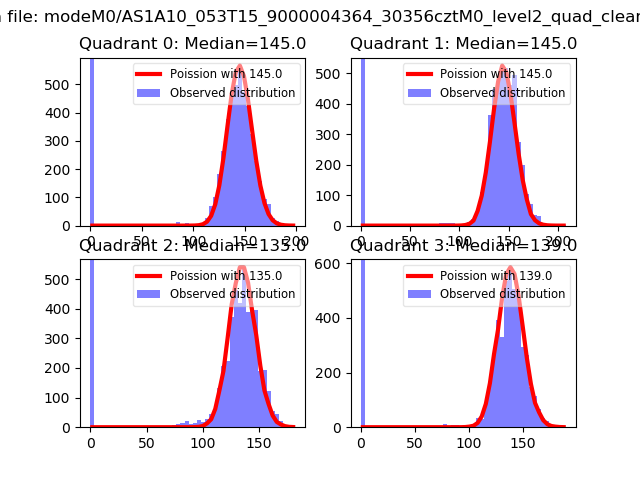
| Comparison with Poisson distribution Blue bars denote a histogram of data divided into 1 sec bins. Red curve is a Poisson curve with rate = median count rate of data. |
 |
 |
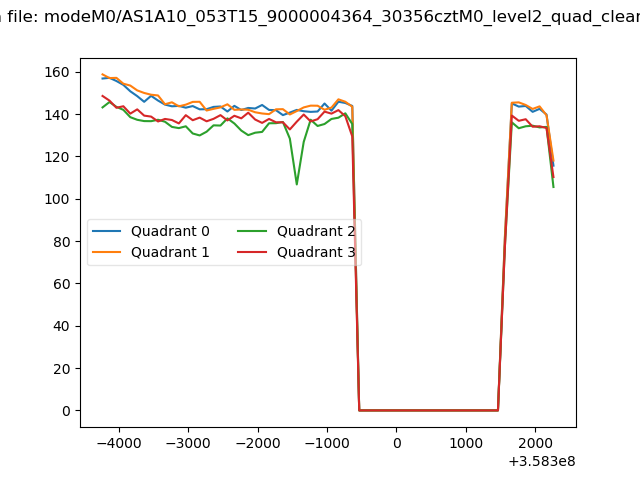
| Quadrant-wise count rates Data is divided into 100 sec bins |
 |
|
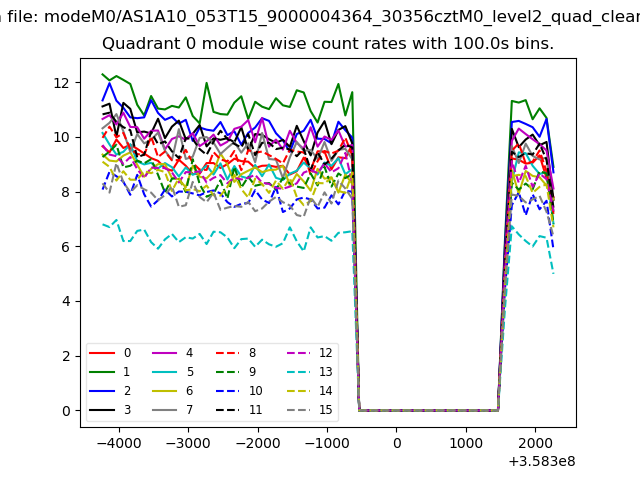
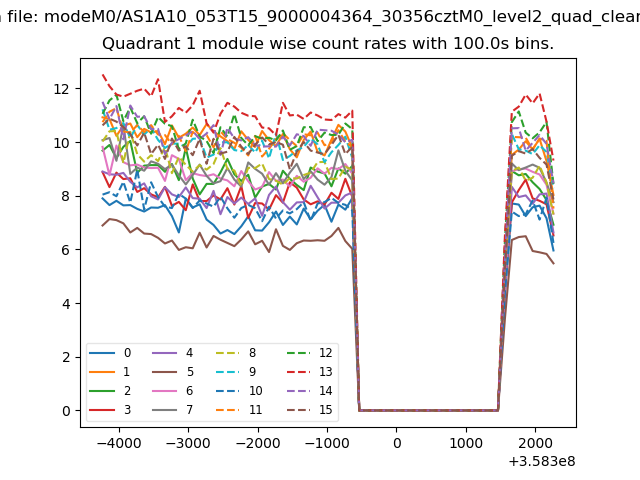
| Module-wise count rates for Quadrant A Data is divided into 100 sec bins |
 |
 |
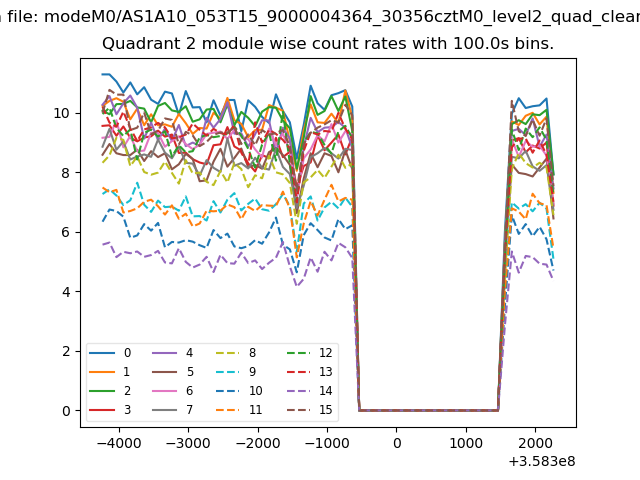
| Module-wise count rates for Quadrant B Data is divided into 100 sec bins |
 |
 |
| Module-wise count rates for Quadrant C Data is divided into 100 sec bins |
 |
 |
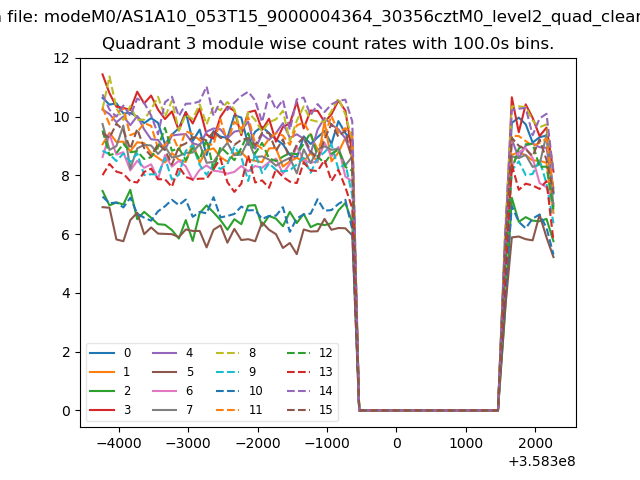
| Module-wise count rates for Quadrant D Data is divided into 100 sec bins |
 |
 |
| Parameter | Plot |
|---|---|
| CZT HV Monitor | 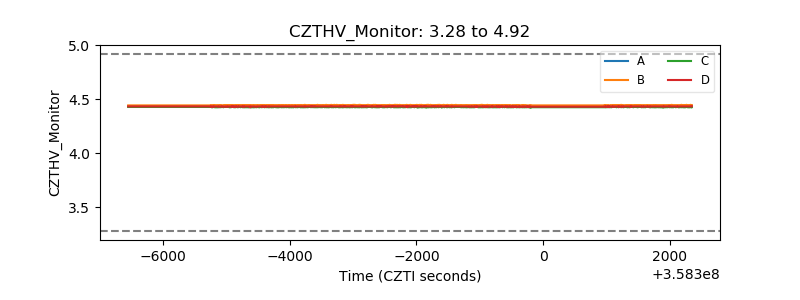 |
| D_VDD | 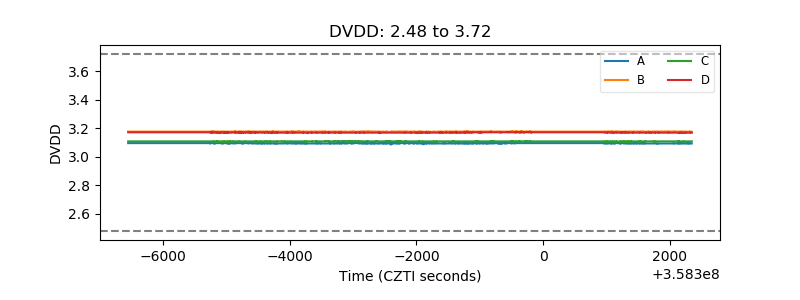 |
| Temperature 1 |  |
| Veto HV Monitor | 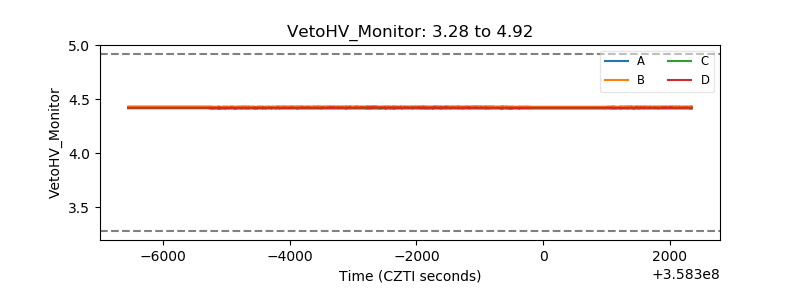 |
| Veto LLD | 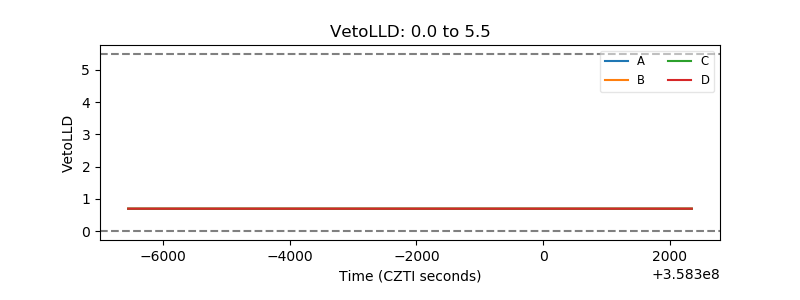 |
| Alpha Counter | 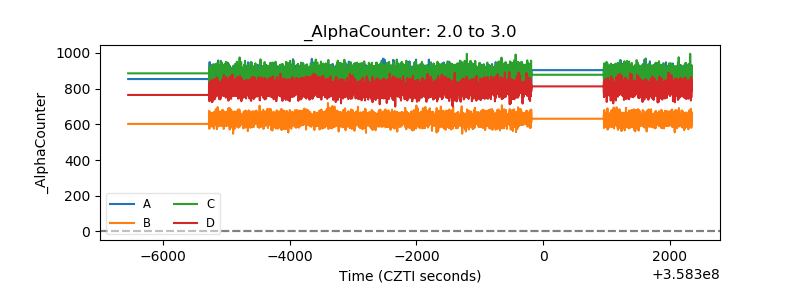 |
| _CPM_Rate | 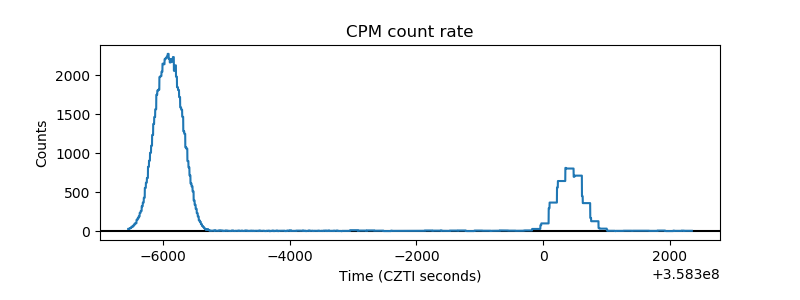 |
| CZT Counter | 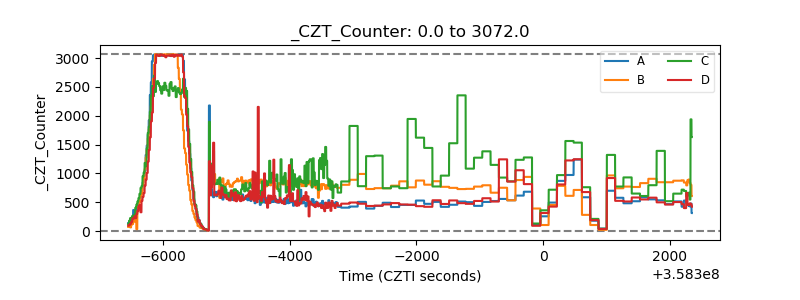 |
| +2.5 Volts monitor |  |
| +5 Volts monitor |  |
| _ROLL_ROT | 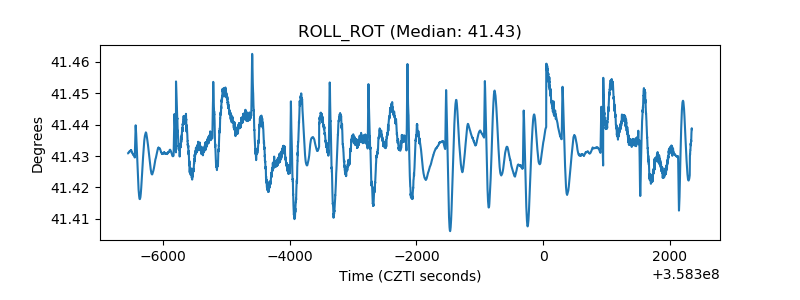 |
| _Roll_DEC | 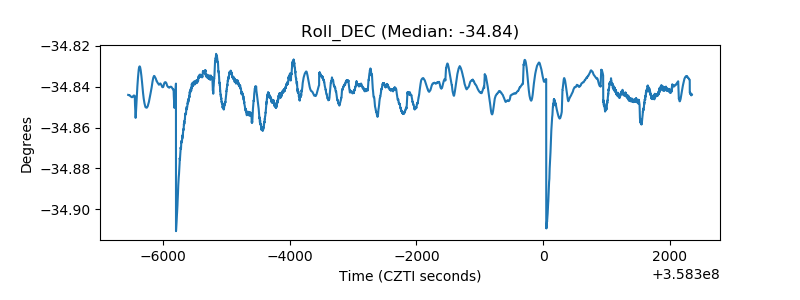 |
| _Roll_RA | 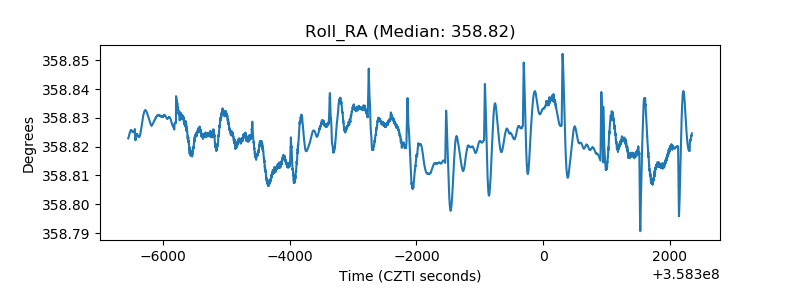 |
| Veto Counter | 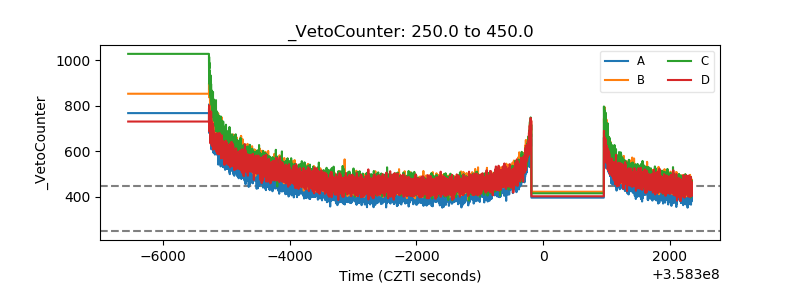 |