| Param | Original file | Final file |
|---|---|---|
| Filename | modeM0/AS1A10_053T15_9000004364_30358cztM0_level2.evt | modeM0/AS1A10_053T15_9000004364_30358cztM0_level2_quad_clean.evt |
| Size (bytes) | 658,661,760 | 104,616,000 |
| Size | 628.1 MB | 99.8 MB |
| Events in quadrant A | 3,496,118 | 691,069 |
| Events in quadrant B | 5,424,197 | 689,498 |
| Events in quadrant C | 7,012,127 | 627,058 |
| Events in quadrant D | 3,532,882 | 663,623 |
| Mode M0 | |||
|---|---|---|---|
| Quadrant | BADHDUFLAG | Total packets | Discarded packets |
| A | 0 | 14889 | 1 |
| B | 0 | 21544 | 1 |
| C | 0 | 25724 | 1 |
| D | 0 | 15238 | 1 |
| Mode M9 | |||
|---|---|---|---|
| Quadrant | BADHDUFLAG | Total packets | Discarded packets |
| A | 0 | 4 | 0 |
| B | 0 | 4 | 0 |
| C | 0 | 4 | 0 |
| D | 0 | 4 | 0 |
| Mode SS | |||
|---|---|---|---|
| Quadrant | BADHDUFLAG | Total packets | Discarded packets |
| A | 0 | 144 | 0 |
| B | 0 | 144 | 0 |
| C | 0 | 144 | 0 |
| D | 0 | 144 | 0 |
| Quadrant | Total seconds | Saturated seconds | Saturation percentage |
|---|---|---|---|
| A | 7134 | 74 | 1.037286% |
| B | 7135 | 167 | 2.340575% |
| C | 7135 | 943 | 13.216538% |
| D | 7135 | 77 | 1.079187% |
Noise dominated data is calculated using 1-second bins in cleaned event files. If a bin has >2000 counts, and if more than 50% of those come from <1% of pixels, then it is considered to be noise-dominated and hence unusable.
| Quadrant | # 1 sec bins | Bins with >0 counts | Bins with >2000 counts | High rate bins dominated by noise | Noise dominated (total time) | Noise dominated (detector-on time) | Marked lightcurve |
|---|---|---|---|---|---|---|---|
| A | 7494 | 7135 | 11 | 11 | 0.15% | 0.15% | 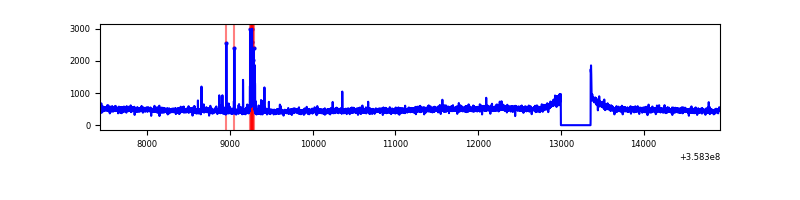 |
| B | 7495 | 7136 | 3 | 3 | 0.04% | 0.04% | 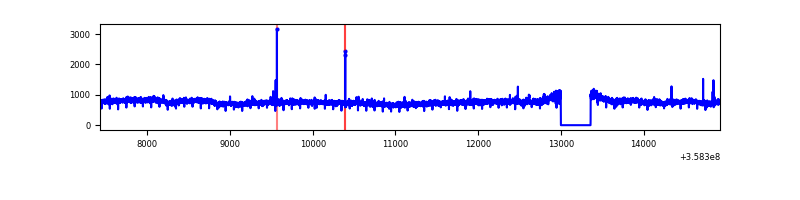 |
| C | 7495 | 7136 | 523 | 523 | 6.98% | 7.33% | 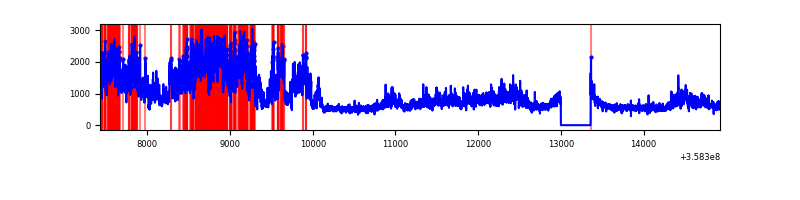 |
| D | 7495 | 7136 | 17 | 17 | 0.23% | 0.24% | 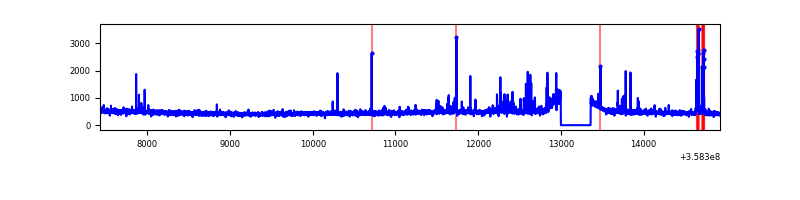 |
Top three noisy pixels from each quadrant. If the there are fewer than three noisy pixels in the level2.evt file, extra rows are filled as -1
| Pixel properties | Quadrant properties | ||||||
|---|---|---|---|---|---|---|---|
| Quadrant | DetID | PixID | Counts | Sigma | Mean | Median | Sigma |
| A | 12 | 96 | 87663 | 489.05 | 879 | 858 | 177.5 |
| A | 13 | 254 | 13567 | 71.6 | 879 | 858 | 177.5 |
| A | 8 | 192 | 11871 | 62.05 | 879 | 858 | 177.5 |
| B | 6 | 159 | 1992640 | 12002.64 | 868 | 846 | 165.9 |
| B | 12 | 111 | 21006 | 121.49 | 868 | 846 | 165.9 |
| B | 11 | 111 | 19252 | 110.92 | 868 | 846 | 165.9 |
| C | 3 | 233 | 3646958 | 18639.64 | 826 | 830 | 195.6 |
| C | 14 | 238 | 131936 | 670.24 | 826 | 830 | 195.6 |
| C | 2 | 114 | 16037 | 77.74 | 826 | 830 | 195.6 |
| D | 2 | 250 | 109414 | 531.73 | 857 | 839 | 204.2 |
| D | 13 | 104 | 92303 | 447.93 | 857 | 839 | 204.2 |
| D | 8 | 195 | 61304 | 296.12 | 857 | 839 | 204.2 |
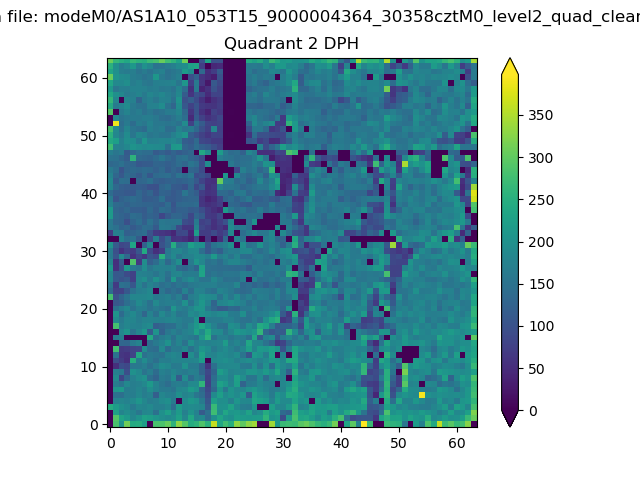
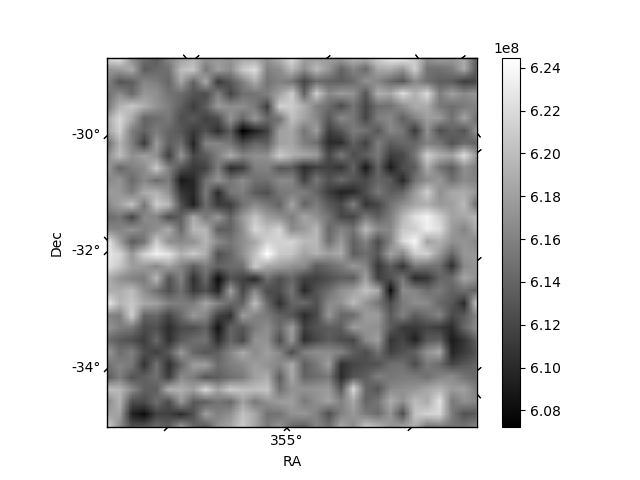
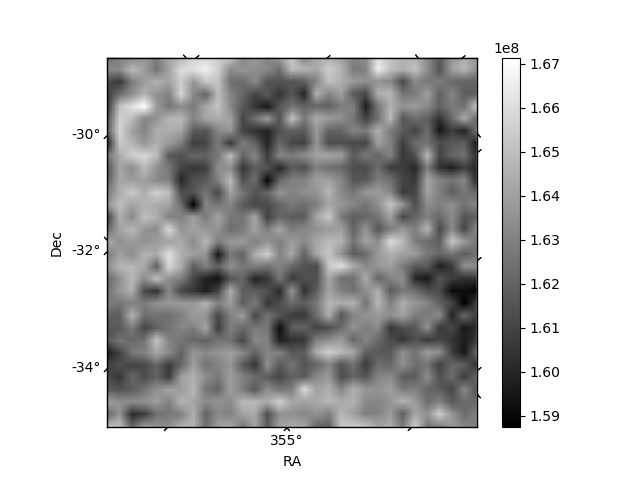
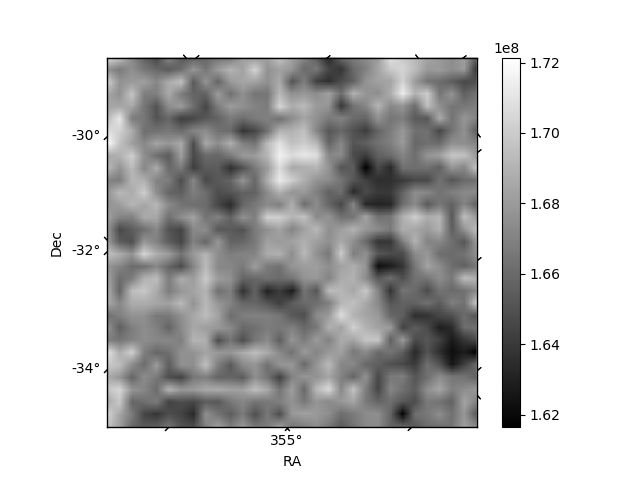
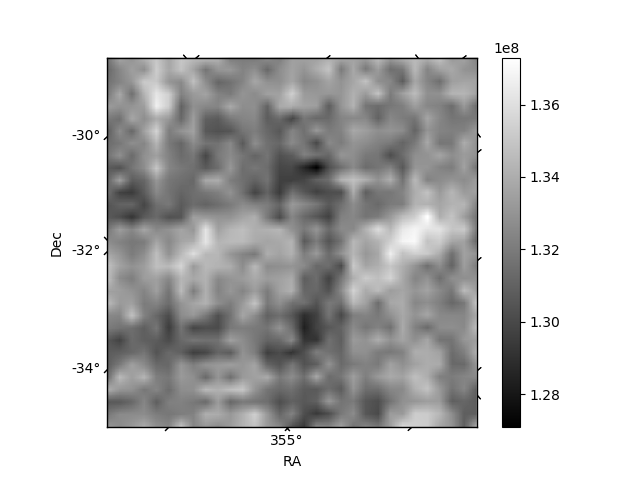
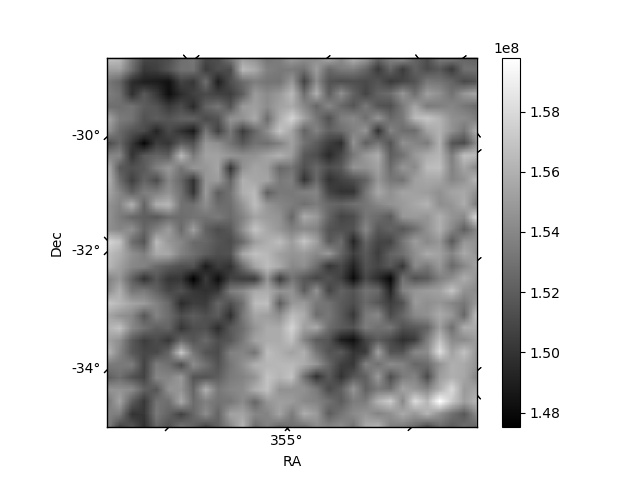
Histogram calculated using DETX and DETY for each event in the final _common_clean file
| Quadrant A | 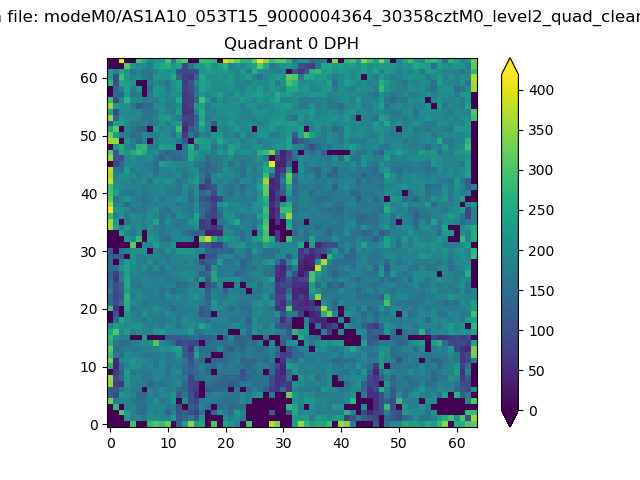 |
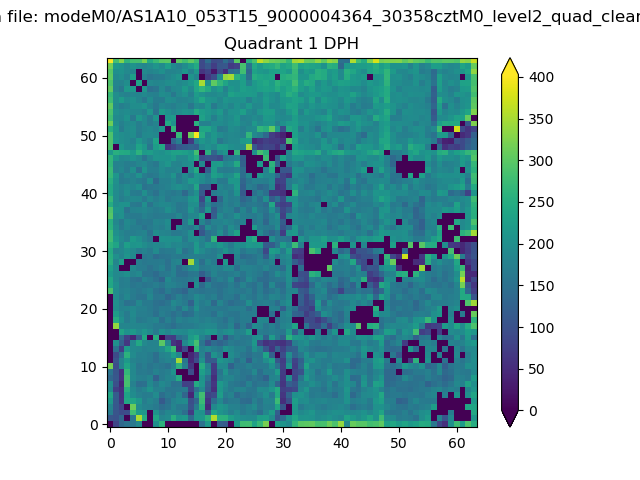 |
Quadrant B |
|---|---|---|---|
| Quadrant D | 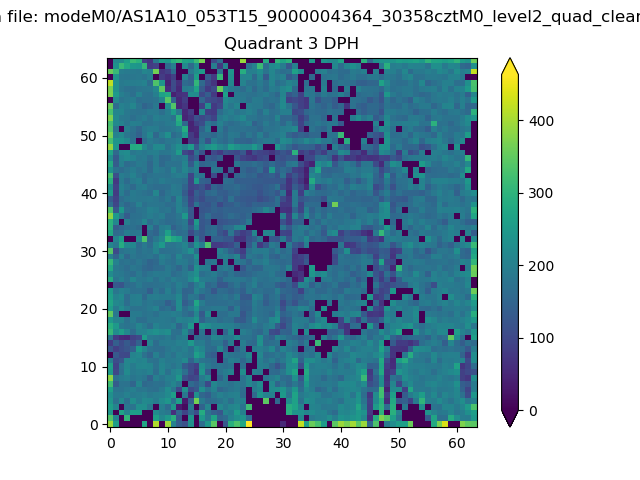 |
 |
Quadrant C |
| Plot type | Count rate plots | Images |
|---|---|---|
| Comparison with Poisson distribution Blue bars denote a histogram of data divided into 1 sec bins. Red curve is a Poisson curve with rate = median count rate of data. |
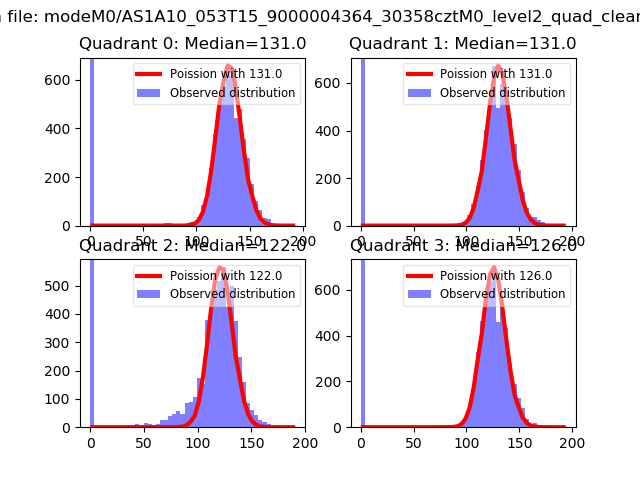 |
 |
| Quadrant-wise count rates Data is divided into 100 sec bins |
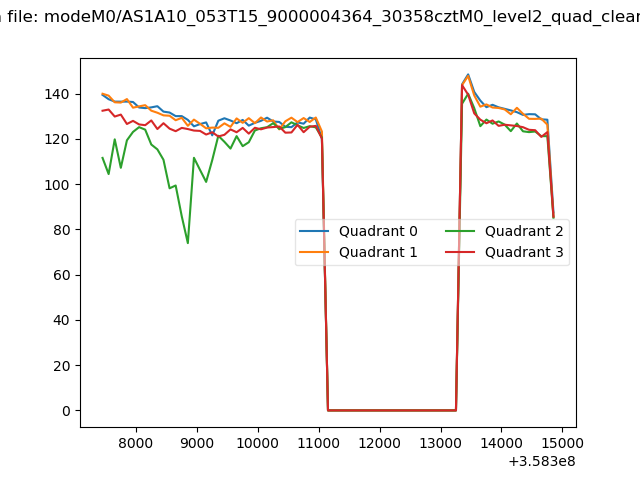 |
|
| Module-wise count rates for Quadrant A Data is divided into 100 sec bins |
 |
 |
| Module-wise count rates for Quadrant B Data is divided into 100 sec bins |
 |
 |
| Module-wise count rates for Quadrant C Data is divided into 100 sec bins |
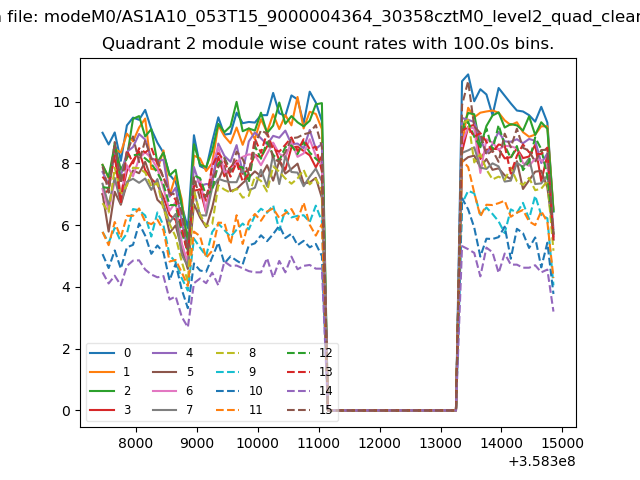 |
 |
| Module-wise count rates for Quadrant D Data is divided into 100 sec bins |
 |
 |
| Parameter | Plot |
|---|---|
| CZT HV Monitor | 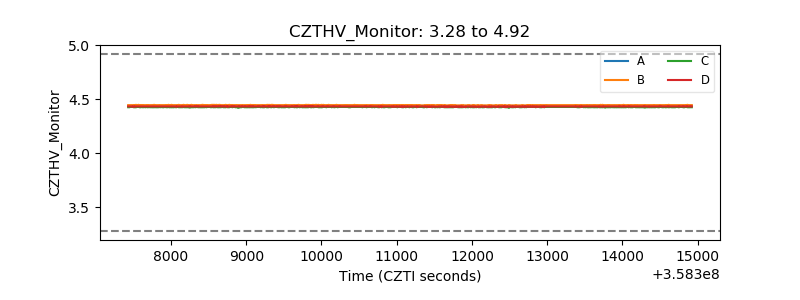 |
| D_VDD | 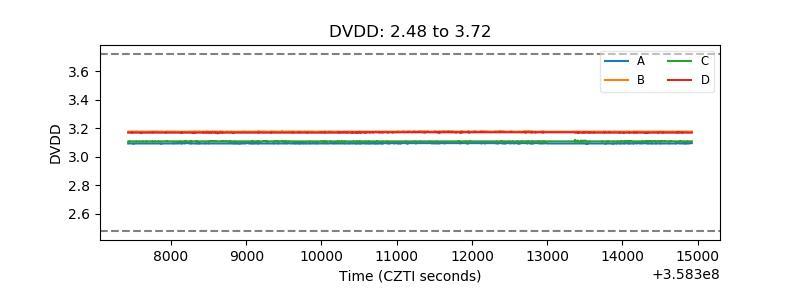 |
| Temperature 1 |  |
| Veto HV Monitor |  |
| Veto LLD | 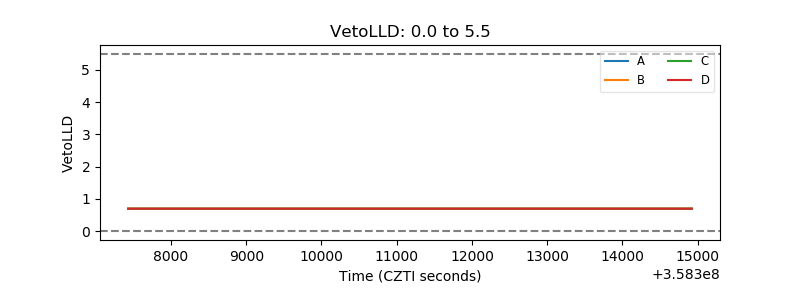 |
| Alpha Counter | 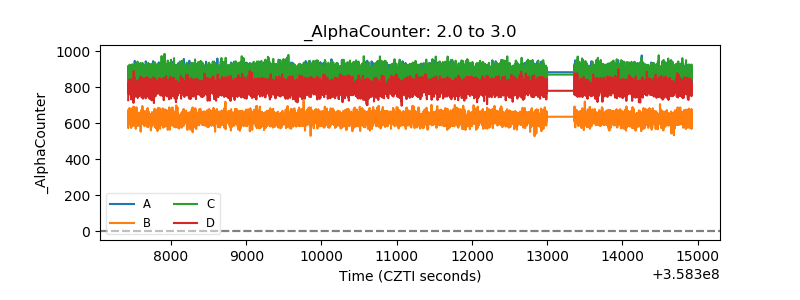 |
| _CPM_Rate | 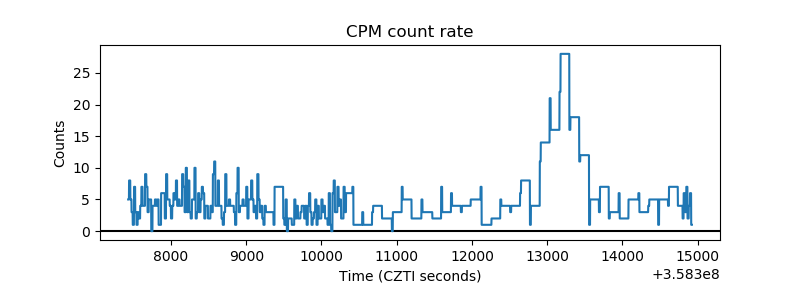 |
| CZT Counter | 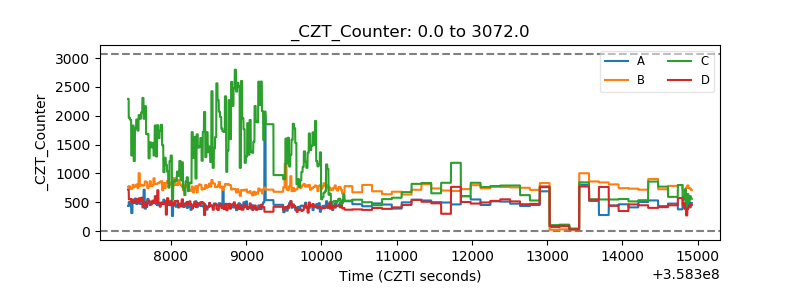 |
| +2.5 Volts monitor | 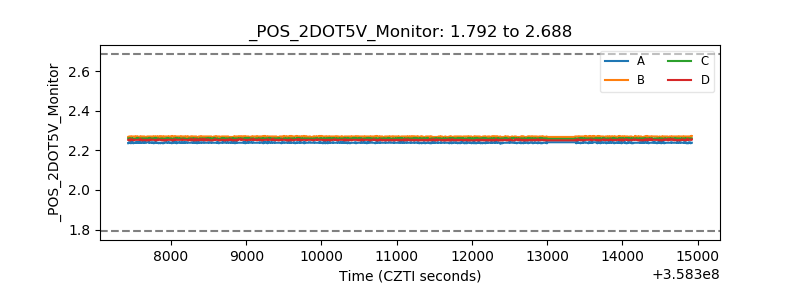 |
| +5 Volts monitor |  |
| _ROLL_ROT |  |
| _Roll_DEC | 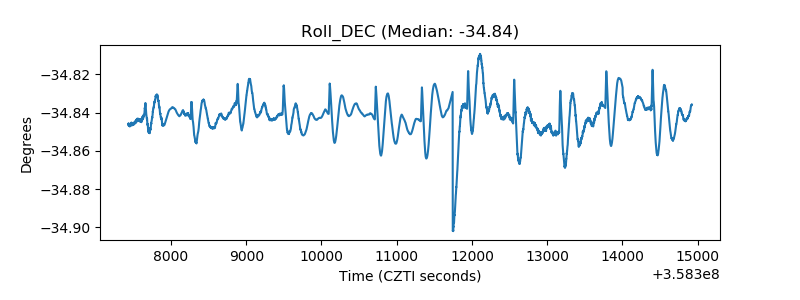 |
| _Roll_RA | 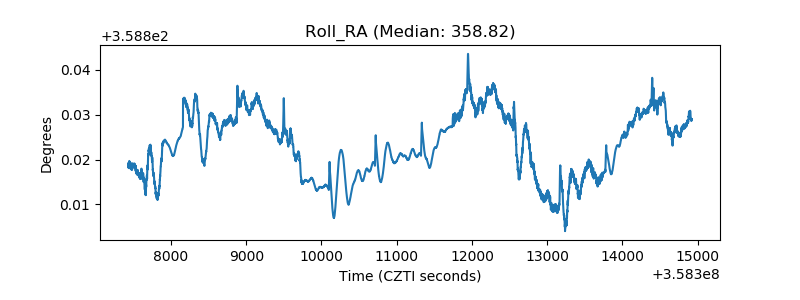 |
| Veto Counter |  |