| Param | Original file | Final file |
|---|---|---|
| Filename | modeM0/AS1A10_053T15_9000004364_30359cztM0_level2.evt | modeM0/AS1A10_053T15_9000004364_30359cztM0_level2_quad_clean.evt |
| Size (bytes) | 616,654,080 | 96,822,720 |
| Size | 588.1 MB | 92.3 MB |
| Events in quadrant A | 3,406,830 | 623,285 |
| Events in quadrant B | 5,293,269 | 623,102 |
| Events in quadrant C | 5,963,184 | 592,757 |
| Events in quadrant D | 3,538,231 | 605,054 |
| Mode M0 | |||
|---|---|---|---|
| Quadrant | BADHDUFLAG | Total packets | Discarded packets |
| A | 0 | 14605 | 2 |
| B | 0 | 21202 | 1 |
| C | 0 | 22808 | 1 |
| D | 0 | 15220 | 1 |
| Mode M9 | |||
|---|---|---|---|
| Quadrant | BADHDUFLAG | Total packets | Discarded packets |
| A | 0 | 2 | 0 |
| B | 0 | 2 | 0 |
| C | 0 | 2 | 0 |
| D | 0 | 2 | 0 |
| Mode SS | |||
|---|---|---|---|
| Quadrant | BADHDUFLAG | Total packets | Discarded packets |
| A | 0 | 142 | 0 |
| B | 0 | 142 | 0 |
| C | 0 | 142 | 0 |
| D | 0 | 142 | 0 |
| Quadrant | Total seconds | Saturated seconds | Saturation percentage |
|---|---|---|---|
| A | 7004 | 82 | 1.170760% |
| B | 7005 | 214 | 3.054961% |
| C | 7005 | 411 | 5.867238% |
| D | 7005 | 112 | 1.598858% |
Noise dominated data is calculated using 1-second bins in cleaned event files. If a bin has >2000 counts, and if more than 50% of those come from <1% of pixels, then it is considered to be noise-dominated and hence unusable.
| Quadrant | # 1 sec bins | Bins with >0 counts | Bins with >2000 counts | High rate bins dominated by noise | Noise dominated (total time) | Noise dominated (detector-on time) | Marked lightcurve |
|---|---|---|---|---|---|---|---|
| A | 7174 | 7006 | 1 | 1 | 0.01% | 0.01% | 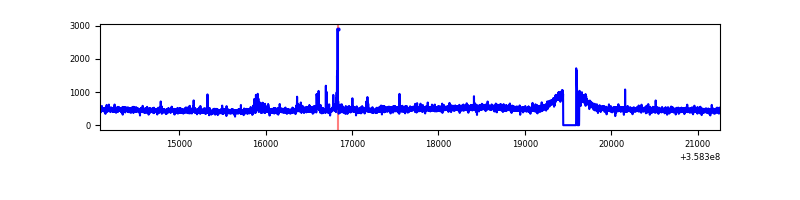 |
| B | 7175 | 7006 | 0 | 0 | 0.00% | 0.00% | 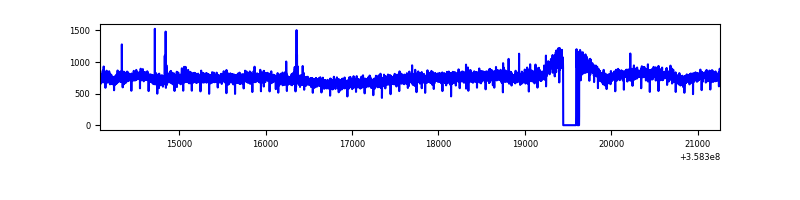 |
| C | 7175 | 7006 | 41 | 41 | 0.57% | 0.59% | 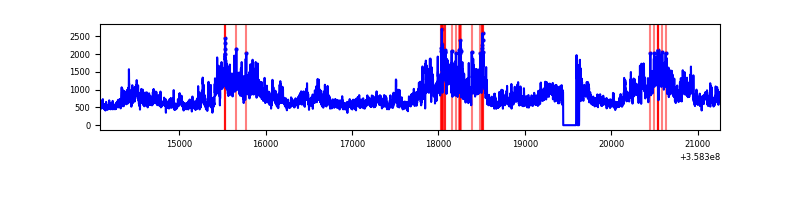 |
| D | 7175 | 7006 | 21 | 21 | 0.29% | 0.30% | 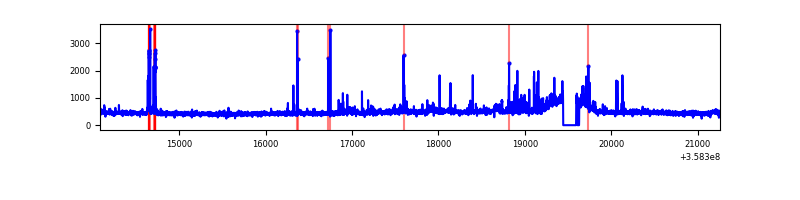 |
Top three noisy pixels from each quadrant. If the there are fewer than three noisy pixels in the level2.evt file, extra rows are filled as -1
| Pixel properties | Quadrant properties | ||||||
|---|---|---|---|---|---|---|---|
| Quadrant | DetID | PixID | Counts | Sigma | Mean | Median | Sigma |
| A | 14 | 239 | 64809 | 369.61 | 860 | 842 | 173.1 |
| A | 13 | 254 | 14104 | 76.63 | 860 | 842 | 173.1 |
| A | 8 | 192 | 10064 | 53.29 | 860 | 842 | 173.1 |
| B | 6 | 159 | 1949613 | 11825.8 | 847 | 823 | 164.8 |
| B | 12 | 111 | 20734 | 120.83 | 847 | 823 | 164.8 |
| B | 11 | 111 | 19162 | 111.29 | 847 | 823 | 164.8 |
| C | 3 | 233 | 2615972 | 13537.89 | 821 | 826 | 193.2 |
| C | 14 | 238 | 130543 | 671.51 | 821 | 826 | 193.2 |
| C | 2 | 114 | 16209 | 79.63 | 821 | 826 | 193.2 |
| D | 13 | 104 | 141332 | 692.57 | 841 | 822 | 202.9 |
| D | 2 | 250 | 122850 | 601.47 | 841 | 822 | 202.9 |
| D | 8 | 195 | 52773 | 256.07 | 841 | 822 | 202.9 |
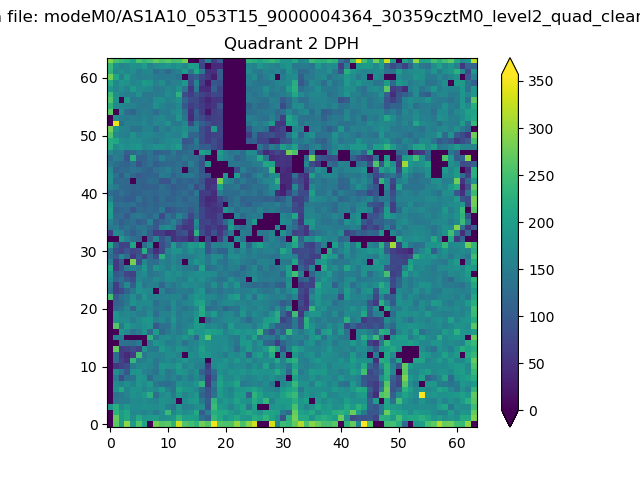
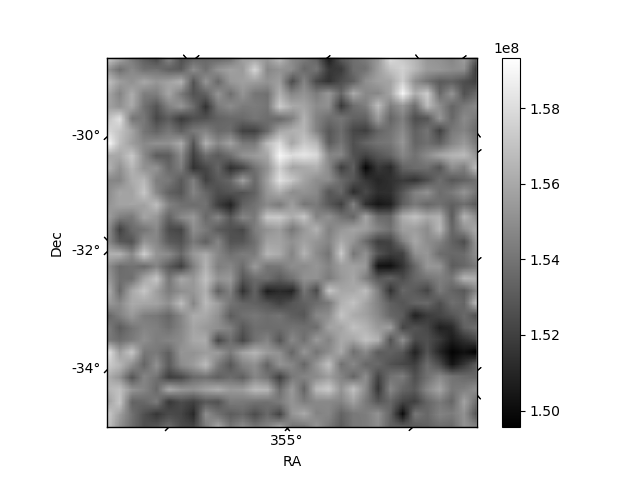
Histogram calculated using DETX and DETY for each event in the final _common_clean file
| Quadrant A | 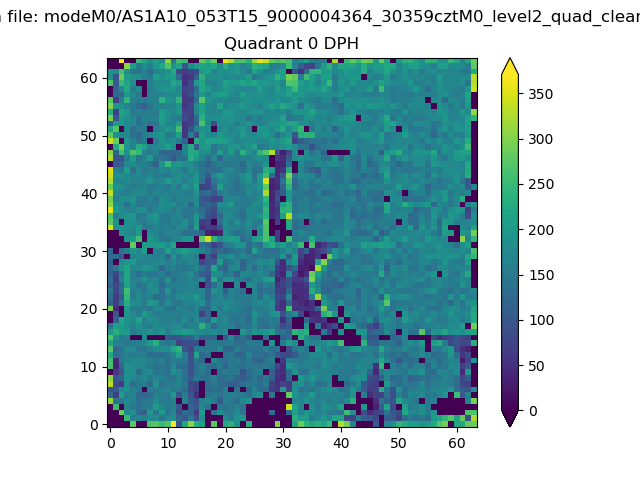 |
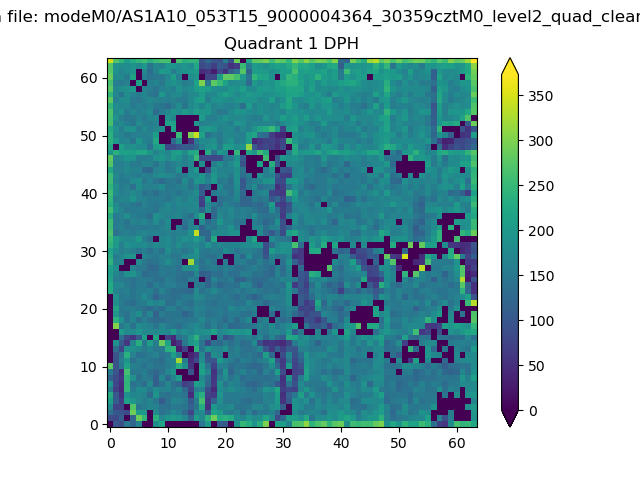 |
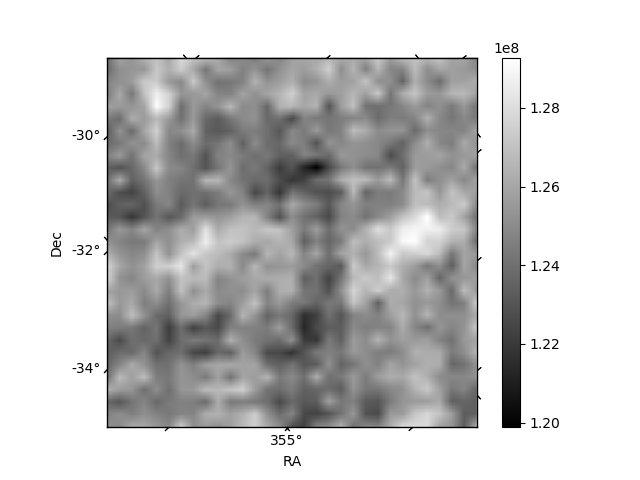
Quadrant B |
|---|---|---|---|
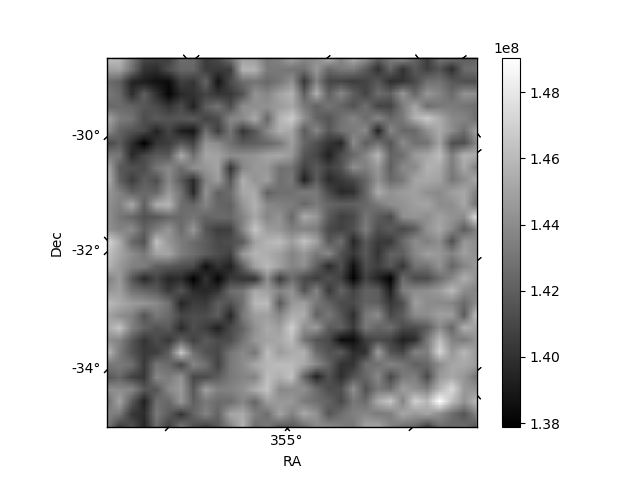
| Quadrant D | 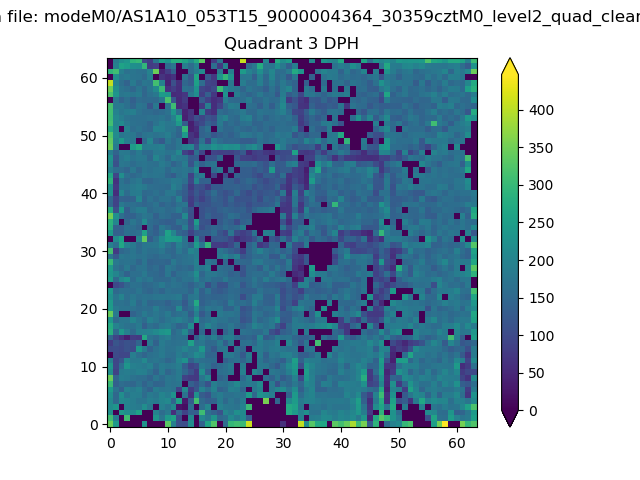 |
 |
Quadrant C |
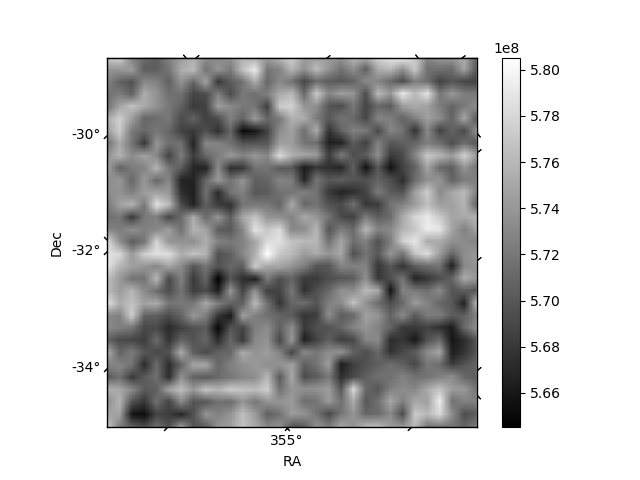
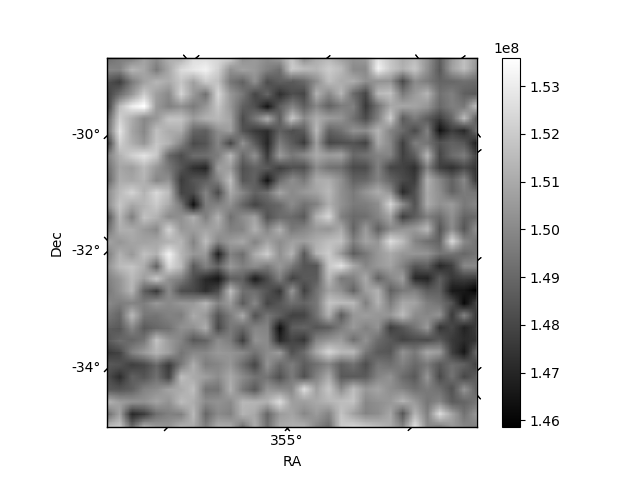
| Plot type | Count rate plots | Images |
|---|---|---|
| Comparison with Poisson distribution Blue bars denote a histogram of data divided into 1 sec bins. Red curve is a Poisson curve with rate = median count rate of data. |
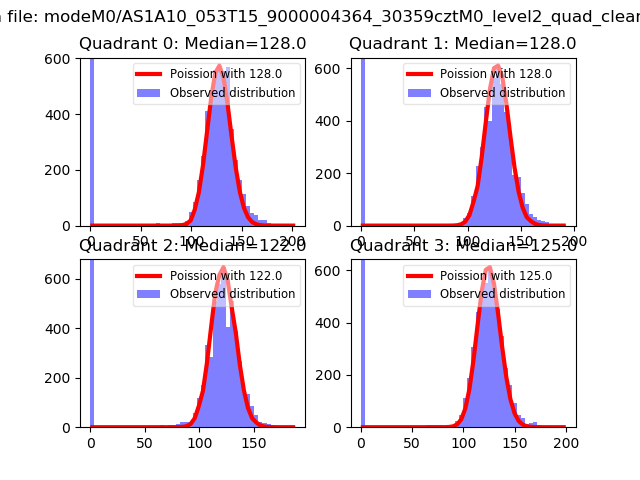 |
 |
| Quadrant-wise count rates Data is divided into 100 sec bins |
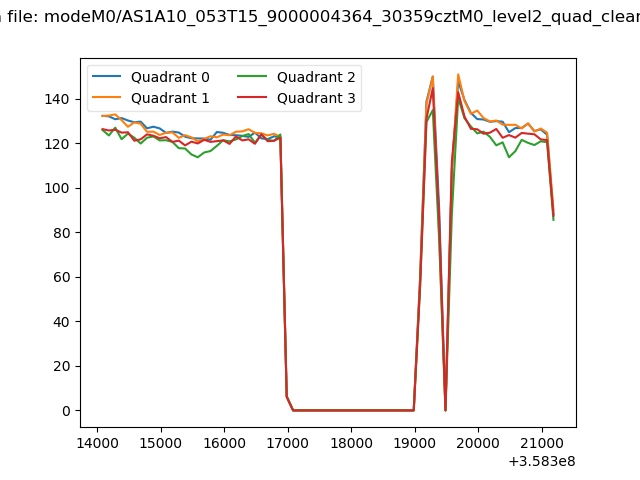 |
|
| Module-wise count rates for Quadrant A Data is divided into 100 sec bins |
 |
 |
| Module-wise count rates for Quadrant B Data is divided into 100 sec bins |
 |
 |
| Module-wise count rates for Quadrant C Data is divided into 100 sec bins |
 |
 |
| Module-wise count rates for Quadrant D Data is divided into 100 sec bins |
 |
 |
| Parameter | Plot |
|---|---|
| CZT HV Monitor |  |
| D_VDD | 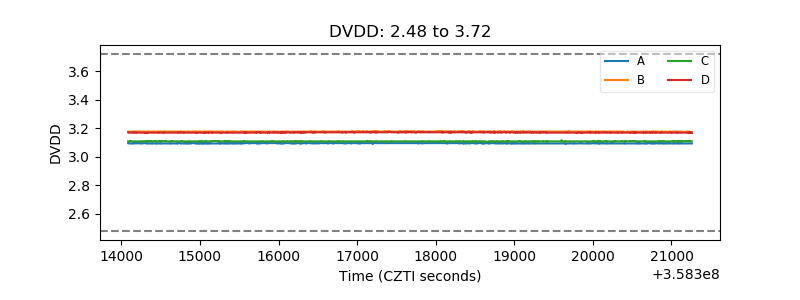 |
| Temperature 1 | 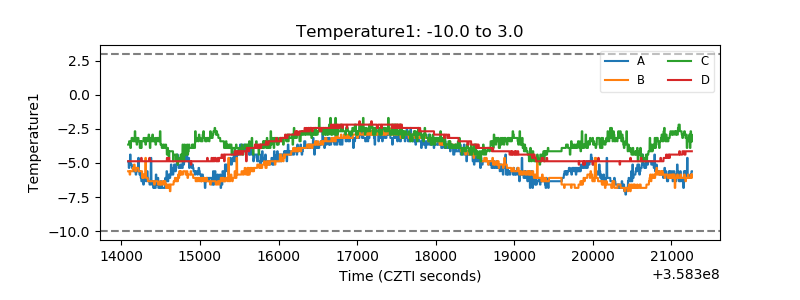 |
| Veto HV Monitor | 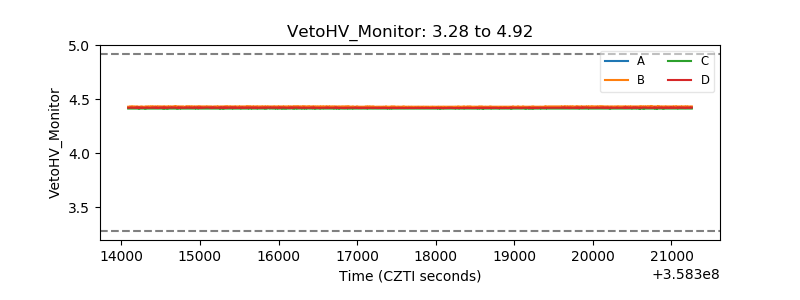 |
| Veto LLD | 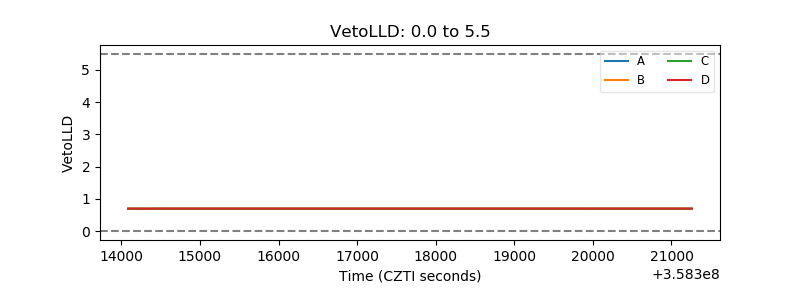 |
| Alpha Counter | 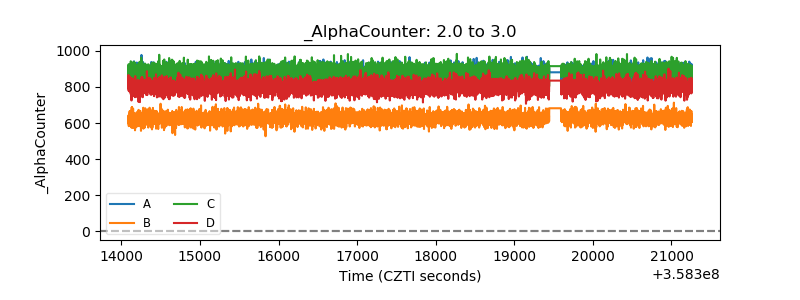 |
| _CPM_Rate | 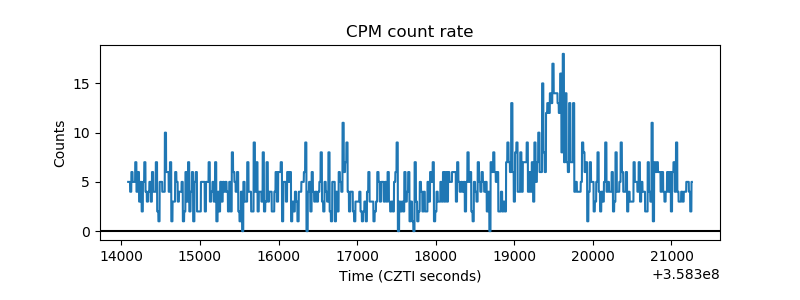 |
| CZT Counter | 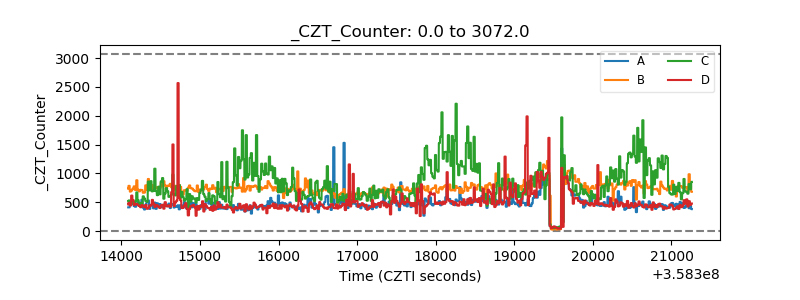 |
| +2.5 Volts monitor |  |
| +5 Volts monitor |  |
| _ROLL_ROT | 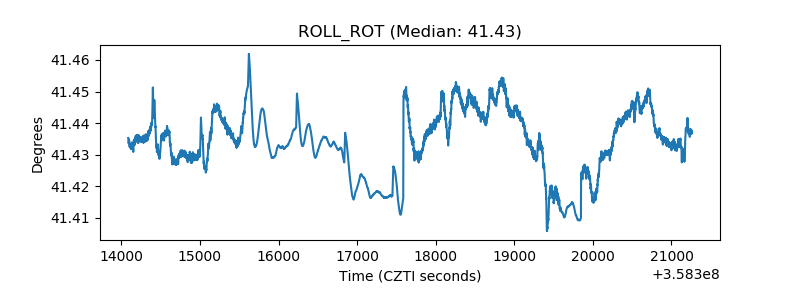 |
| _Roll_DEC | 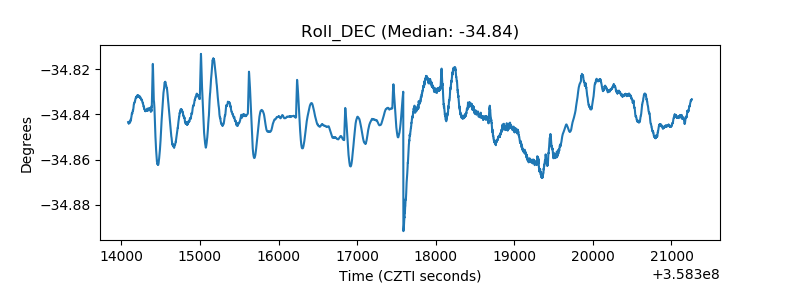 |
| _Roll_RA | 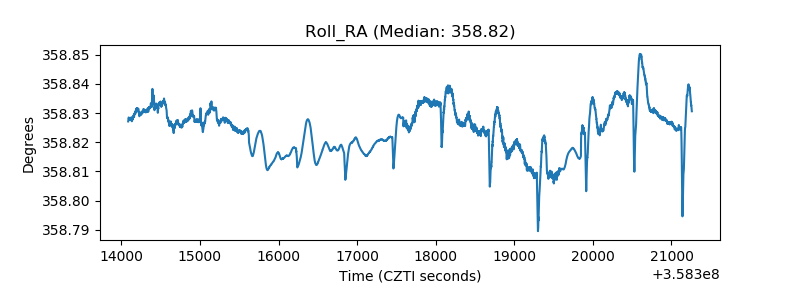 |
| Veto Counter | 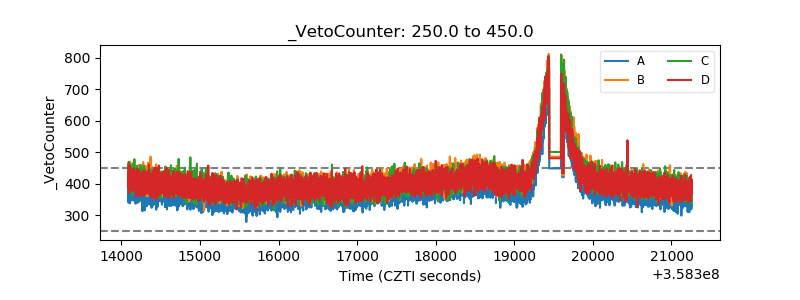 |