| Param | Original file | Final file |
|---|---|---|
| Filename | modeM0/AS1A10_053T15_9000004364_30360cztM0_level2.evt | modeM0/AS1A10_053T15_9000004364_30360cztM0_level2_quad_clean.evt |
| Size (bytes) | 744,770,880 | 91,195,200 |
| Size | 710.3 MB | 87.0 MB |
| Events in quadrant A | 3,244,411 | 598,567 |
| Events in quadrant B | 5,170,460 | 602,040 |
| Events in quadrant C | 10,229,655 | 497,028 |
| Events in quadrant D | 3,445,375 | 583,023 |
| Mode M0 | |||
|---|---|---|---|
| Quadrant | BADHDUFLAG | Total packets | Discarded packets |
| A | 0 | 14133 | 1 |
| B | 0 | 20763 | 1 |
| C | 0 | 35298 | 6 |
| D | 0 | 14762 | 1 |
| Mode M9 | |||
|---|---|---|---|
| Quadrant | BADHDUFLAG | Total packets | Discarded packets |
| A | 0 | 3 | 0 |
| B | 0 | 3 | 0 |
| C | 0 | 3 | 0 |
| D | 0 | 3 | 0 |
| Mode SS | |||
|---|---|---|---|
| Quadrant | BADHDUFLAG | Total packets | Discarded packets |
| A | 0 | 140 | 0 |
| B | 0 | 140 | 0 |
| C | 0 | 140 | 0 |
| D | 0 | 140 | 0 |
| Quadrant | Total seconds | Saturated seconds | Saturation percentage |
|---|---|---|---|
| A | 6891 | 83 | 1.204470% |
| B | 6892 | 145 | 2.103889% |
| C | 6891 | 2382 | 34.566826% |
| D | 6891 | 89 | 1.291540% |
Noise dominated data is calculated using 1-second bins in cleaned event files. If a bin has >2000 counts, and if more than 50% of those come from <1% of pixels, then it is considered to be noise-dominated and hence unusable.
| Quadrant | # 1 sec bins | Bins with >0 counts | Bins with >2000 counts | High rate bins dominated by noise | Noise dominated (total time) | Noise dominated (detector-on time) | Marked lightcurve |
|---|---|---|---|---|---|---|---|
| A | 7211 | 6891 | 2 | 2 | 0.03% | 0.03% | 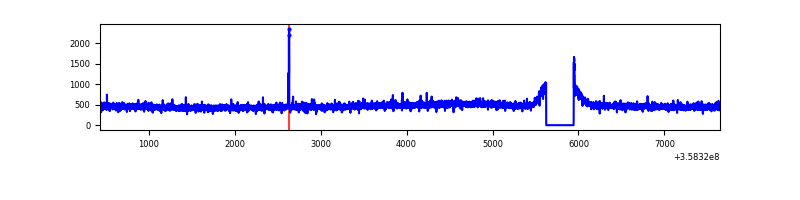 |
| B | 7212 | 6892 | 0 | 0 | 0.00% | 0.00% | 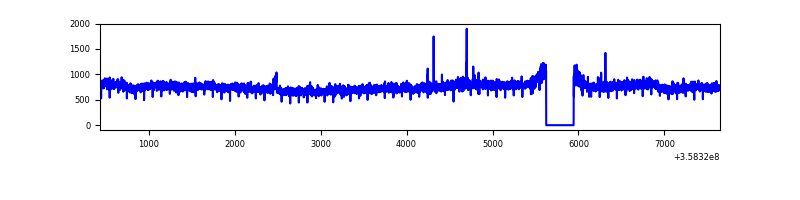 |
| C | 7211 | 6891 | 1733 | 1733 | 24.03% | 25.15% | 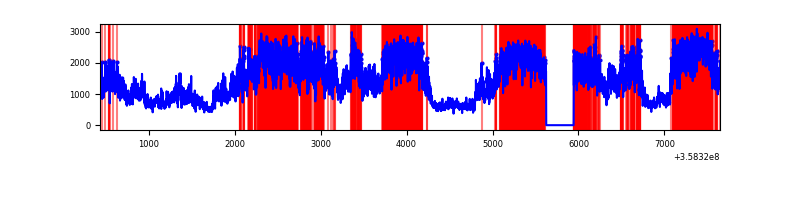 |
| D | 7211 | 6892 | 20 | 20 | 0.28% | 0.29% | 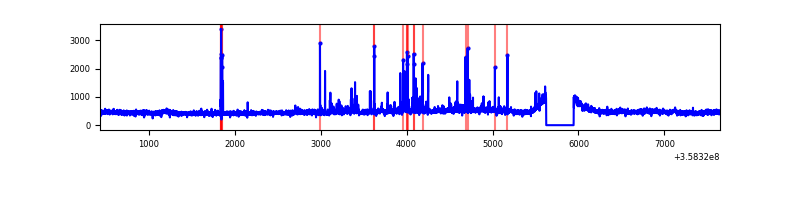 |
Top three noisy pixels from each quadrant. If the there are fewer than three noisy pixels in the level2.evt file, extra rows are filled as -1
| Pixel properties | Quadrant properties | ||||||
|---|---|---|---|---|---|---|---|
| Quadrant | DetID | PixID | Counts | Sigma | Mean | Median | Sigma |
| A | 13 | 254 | 13773 | 76.76 | 833 | 814 | 168.8 |
| A | 8 | 192 | 11615 | 63.98 | 833 | 814 | 168.8 |
| A | 12 | 96 | 9736 | 52.85 | 833 | 814 | 168.8 |
| B | 6 | 159 | 1919232 | 12071.34 | 819 | 798 | 158.9 |
| B | 0 | 190 | 21940 | 133.03 | 819 | 798 | 158.9 |
| B | 12 | 111 | 20164 | 121.86 | 819 | 798 | 158.9 |
| C | 3 | 233 | 7292313 | 42978.54 | 721 | 724 | 169.7 |
| C | 14 | 238 | 112052 | 656.2 | 721 | 724 | 169.7 |
| C | 2 | 114 | 14443 | 80.86 | 721 | 724 | 169.7 |
| D | 2 | 250 | 156216 | 802.3 | 815 | 795 | 193.7 |
| D | 8 | 195 | 128461 | 659.03 | 815 | 795 | 193.7 |
| D | 13 | 249 | 36284 | 183.2 | 815 | 795 | 193.7 |
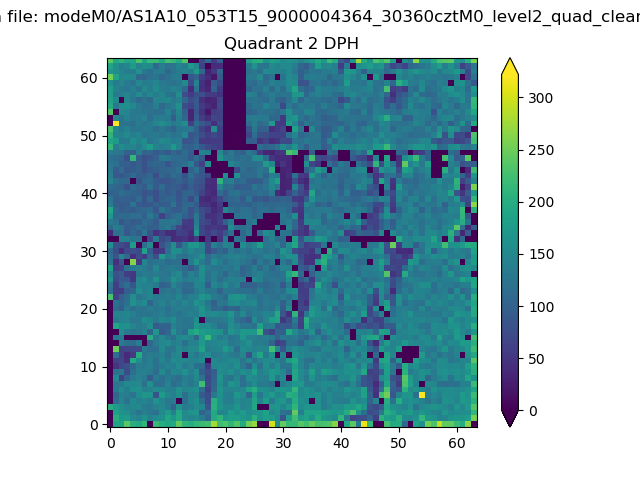
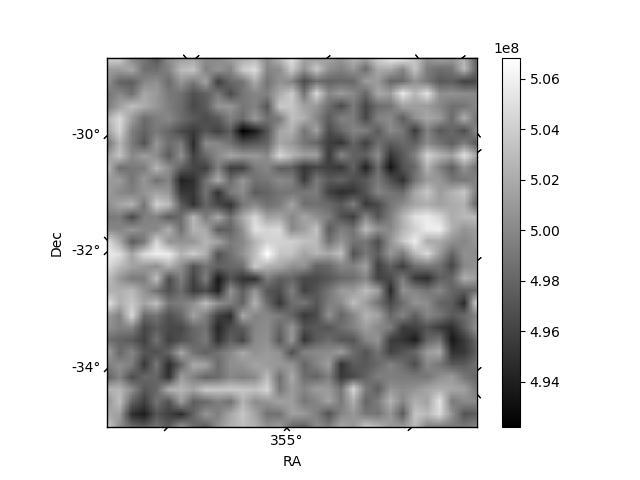
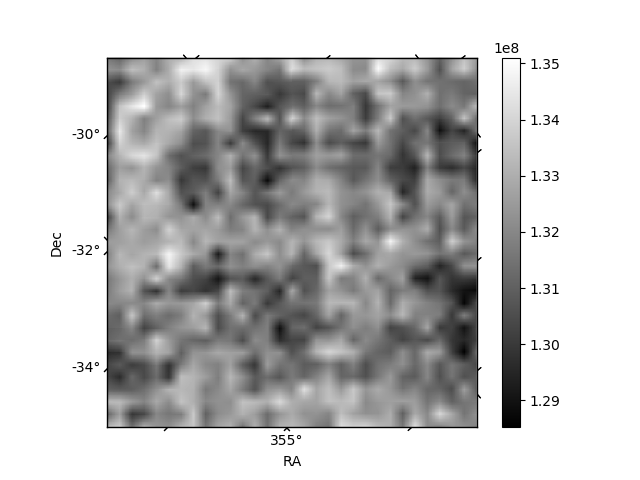
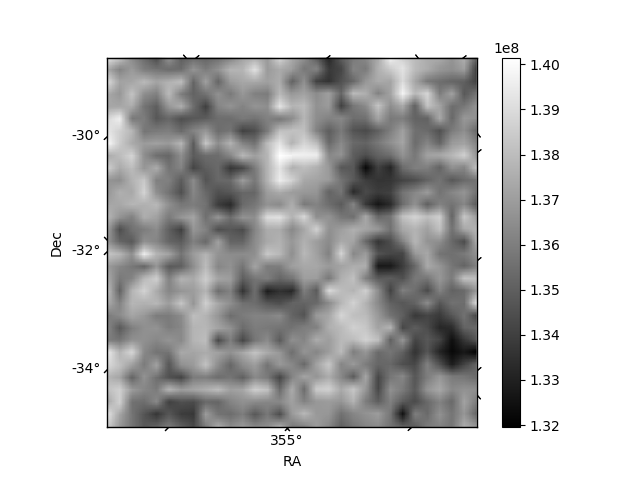
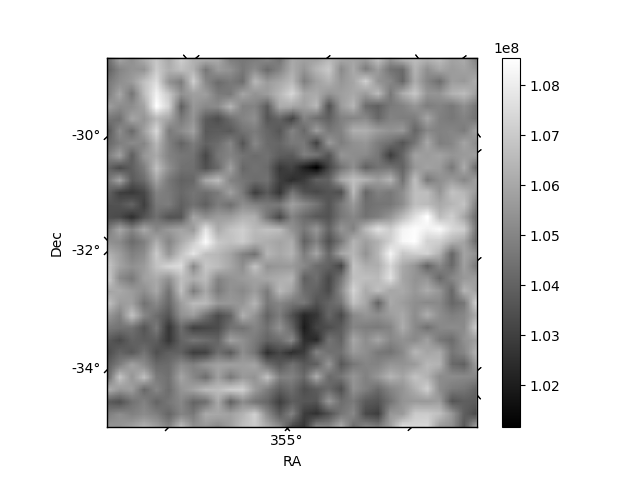
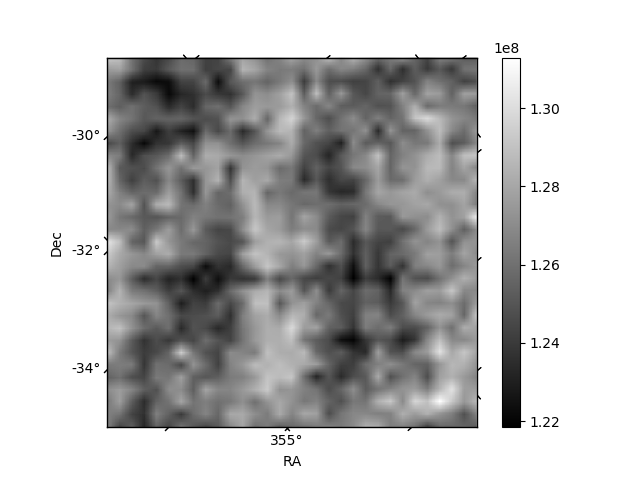
Histogram calculated using DETX and DETY for each event in the final _common_clean file
| Quadrant A | 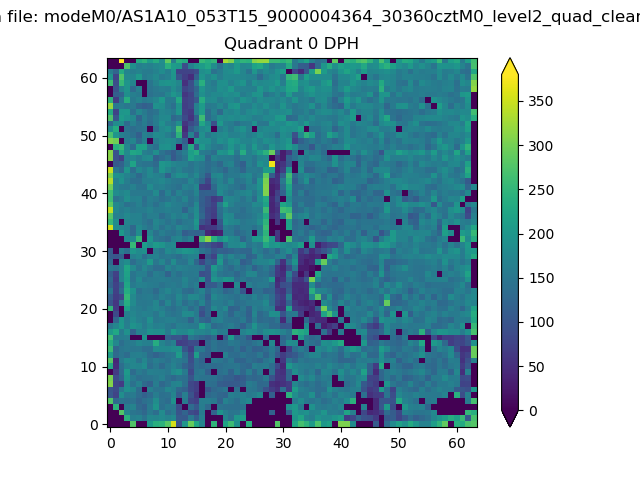 |
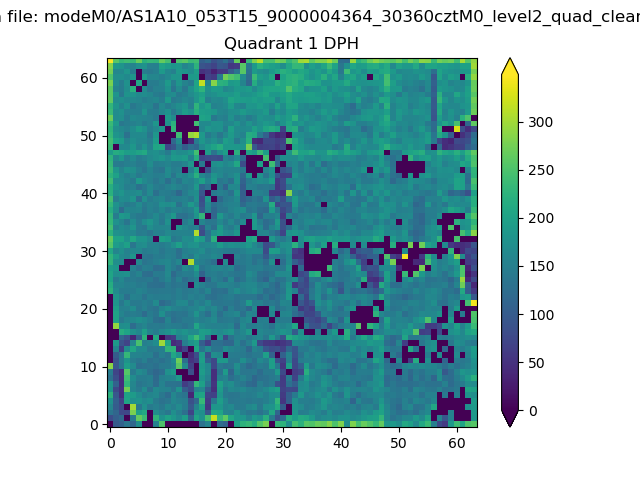 |
Quadrant B |
|---|---|---|---|
| Quadrant D | 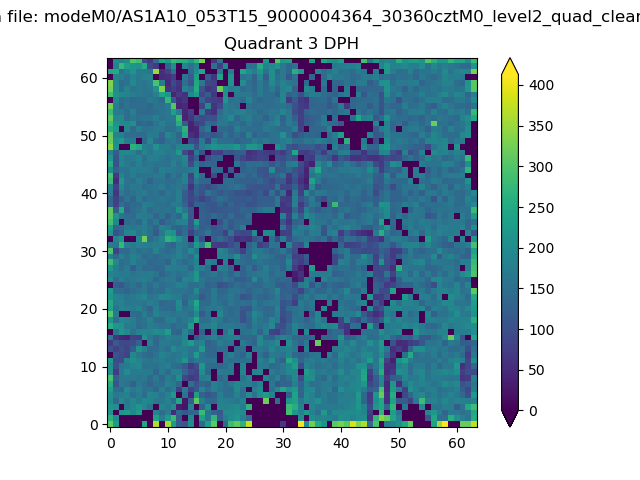 |
 |
Quadrant C |
| Plot type | Count rate plots | Images |
|---|---|---|
| Comparison with Poisson distribution Blue bars denote a histogram of data divided into 1 sec bins. Red curve is a Poisson curve with rate = median count rate of data. |
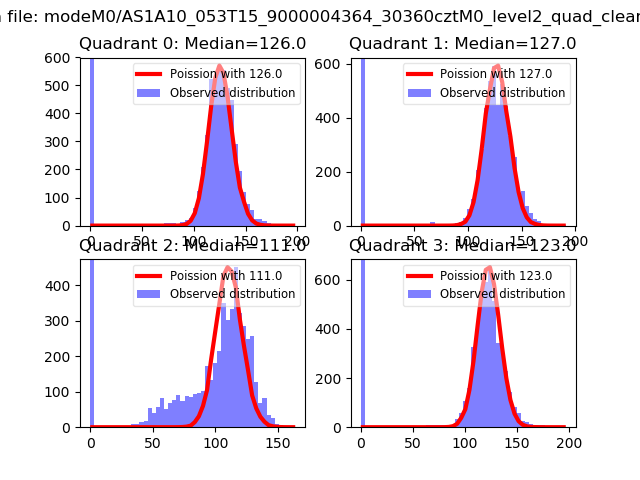 |
 |
| Quadrant-wise count rates Data is divided into 100 sec bins |
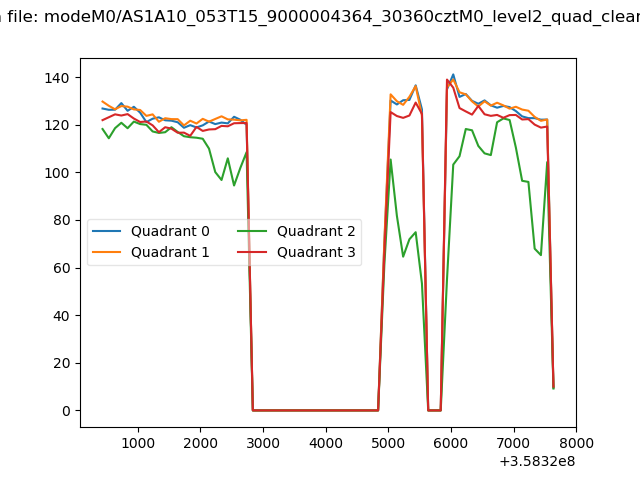 |
|
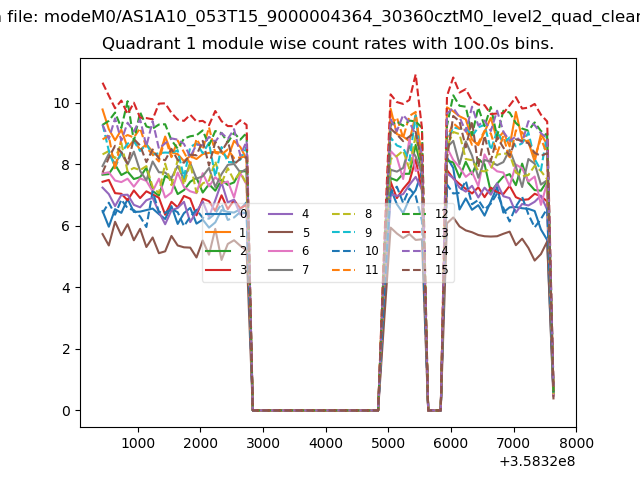
| Module-wise count rates for Quadrant A Data is divided into 100 sec bins |
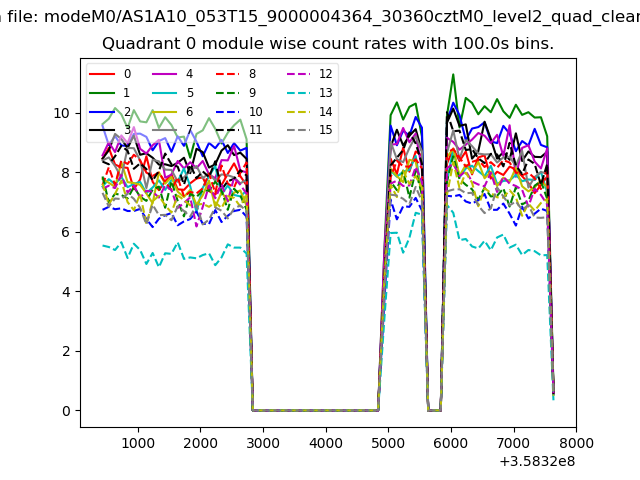 |
 |
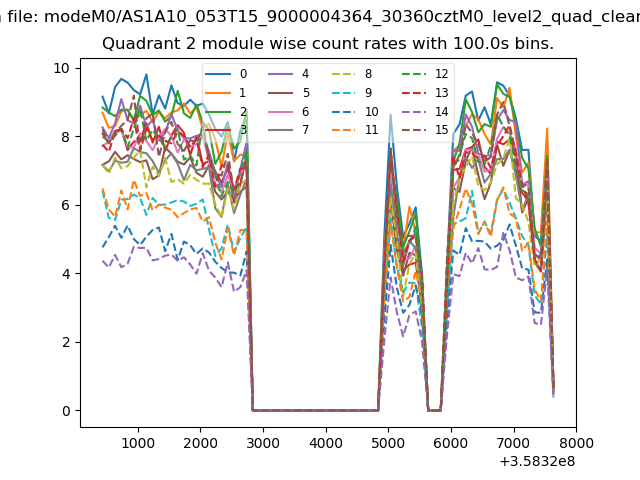
| Module-wise count rates for Quadrant B Data is divided into 100 sec bins |
 |
 |
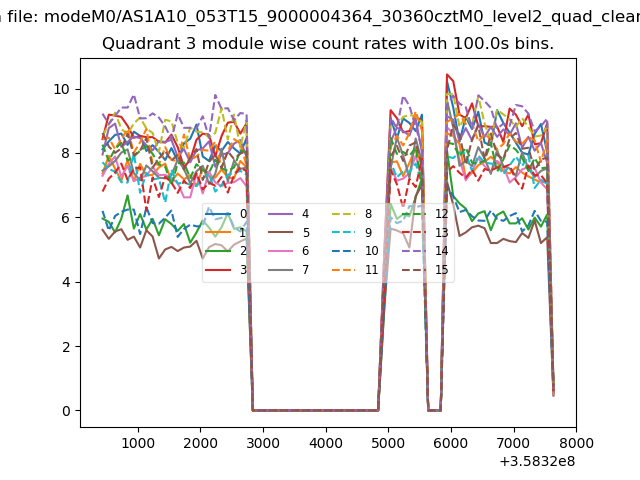
| Module-wise count rates for Quadrant C Data is divided into 100 sec bins |
 |
 |
| Module-wise count rates for Quadrant D Data is divided into 100 sec bins |
 |
 |
| Parameter | Plot |
|---|---|
| CZT HV Monitor | 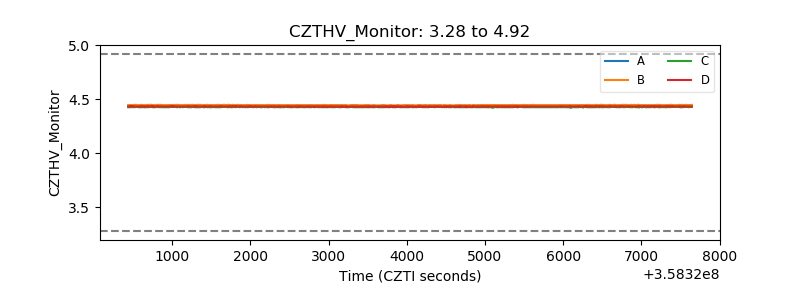 |
| D_VDD | 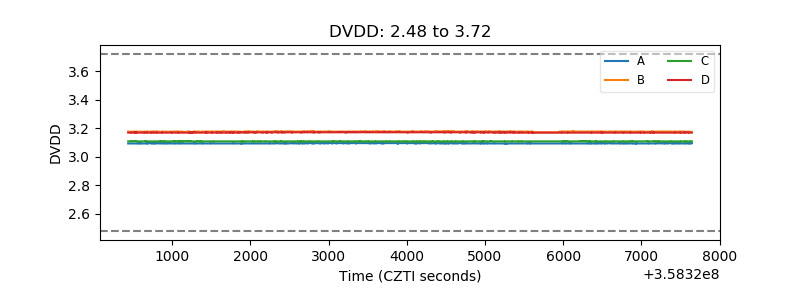 |
| Temperature 1 | 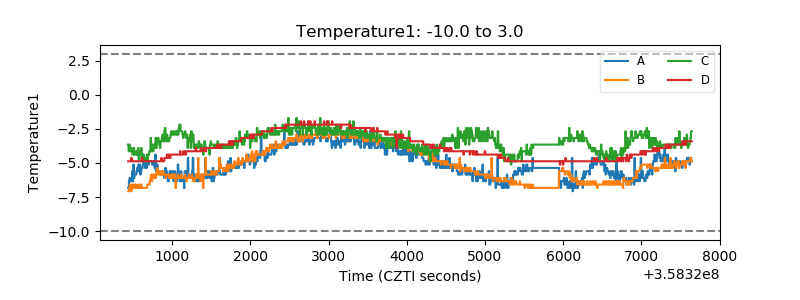 |
| Veto HV Monitor | 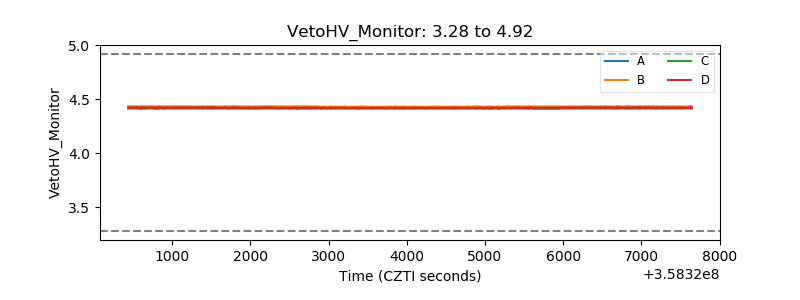 |
| Veto LLD | 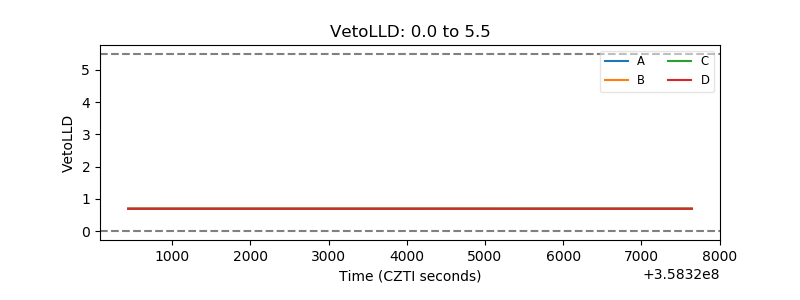 |
| Alpha Counter | 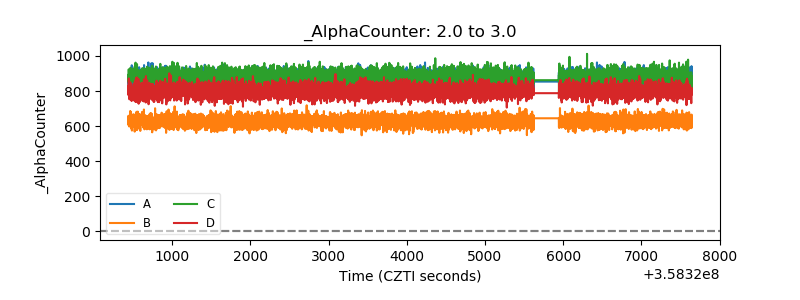 |
| _CPM_Rate | 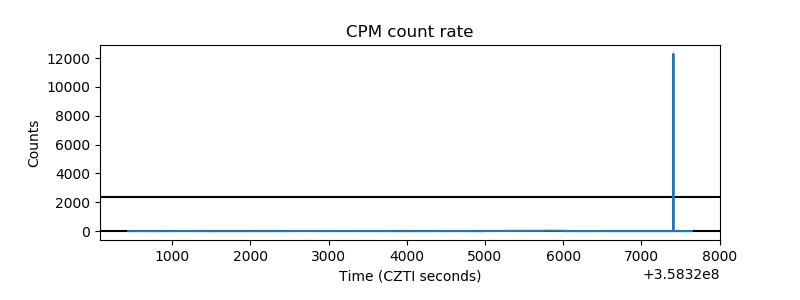 |
| CZT Counter | 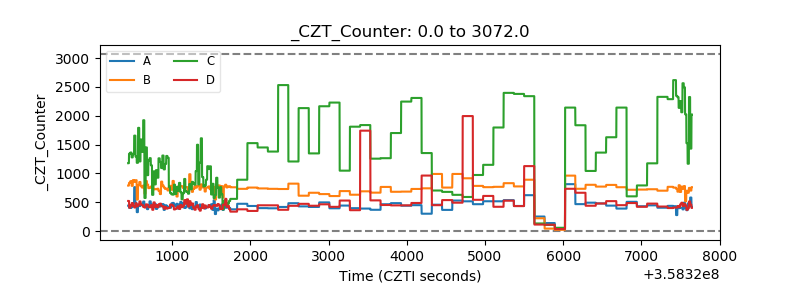 |
| +2.5 Volts monitor |  |
| +5 Volts monitor | 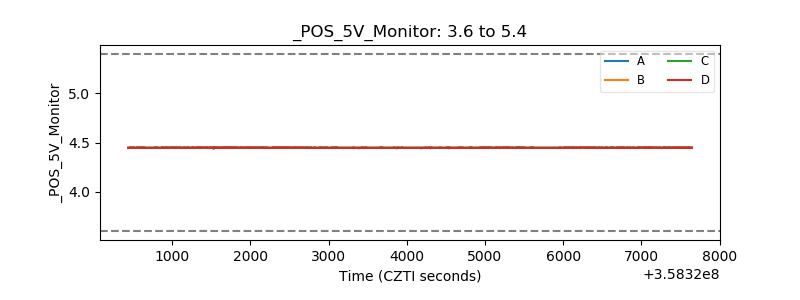 |
| _ROLL_ROT | 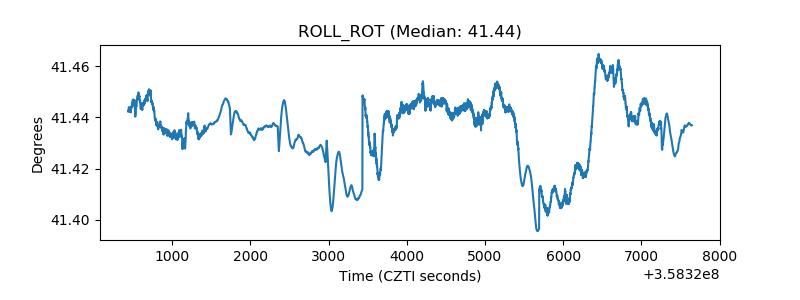 |
| _Roll_DEC | 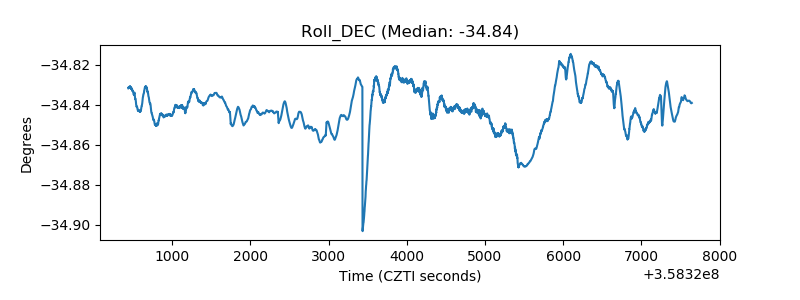 |
| _Roll_RA | 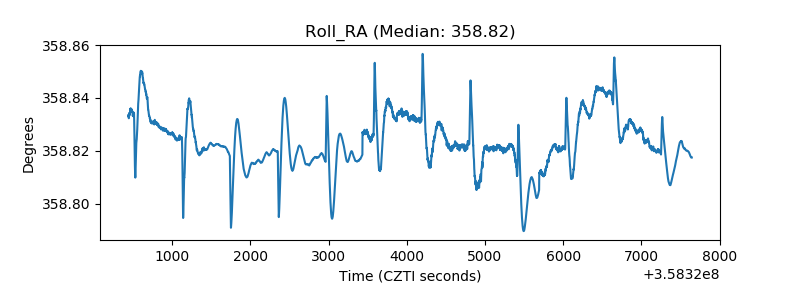 |
| Veto Counter | 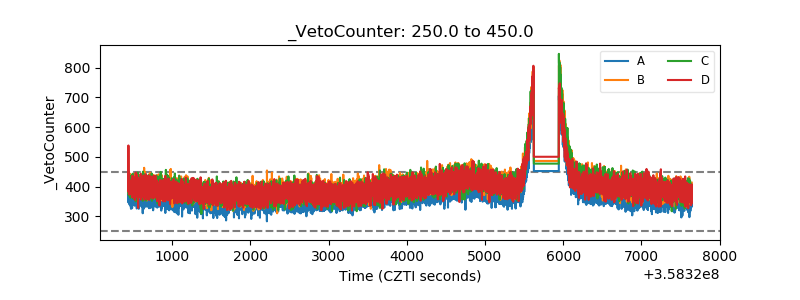 |