| Param | Original file | Final file |
|---|---|---|
| Filename | modeM0/AS1A10_053T15_9000004364_30362cztM0_level2.evt | modeM0/AS1A10_053T15_9000004364_30362cztM0_level2_quad_clean.evt |
| Size (bytes) | 300,009,600 | 38,773,440 |
| Size | 286.1 MB | 37.0 MB |
| Events in quadrant A | 1,175,155 | 255,709 |
| Events in quadrant B | 1,926,735 | 256,892 |
| Events in quadrant C | 4,559,115 | 215,616 |
| Events in quadrant D | 1,239,114 | 251,294 |
| Mode M0 | |||
|---|---|---|---|
| Quadrant | BADHDUFLAG | Total packets | Discarded packets |
| A | 0 | 5426 | 0 |
| B | 0 | 8060 | 0 |
| C | 0 | 15426 | 0 |
| D | 0 | 5524 | 0 |
| Mode SS | |||
|---|---|---|---|
| Quadrant | BADHDUFLAG | Total packets | Discarded packets |
| A | 0 | 54 | 0 |
| B | 0 | 54 | 0 |
| C | 0 | 54 | 0 |
| D | 0 | 54 | 0 |
| Quadrant | Total seconds | Saturated seconds | Saturation percentage |
|---|---|---|---|
| A | 2710 | 2 | 0.073801% |
| B | 2710 | 2 | 0.073801% |
| C | 2710 | 1291 | 47.638376% |
| D | 2710 | 0 | 0.000000% |
Noise dominated data is calculated using 1-second bins in cleaned event files. If a bin has >2000 counts, and if more than 50% of those come from <1% of pixels, then it is considered to be noise-dominated and hence unusable.
| Quadrant | # 1 sec bins | Bins with >0 counts | Bins with >2000 counts | High rate bins dominated by noise | Noise dominated (total time) | Noise dominated (detector-on time) | Marked lightcurve |
|---|---|---|---|---|---|---|---|
| A | 2710 | 2710 | 0 | 0 | 0.00% | 0.00% | 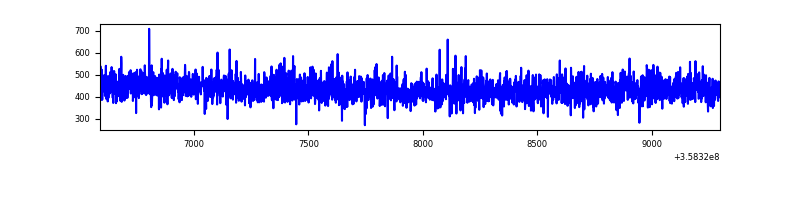 |
| B | 2710 | 2710 | 0 | 0 | 0.00% | 0.00% | 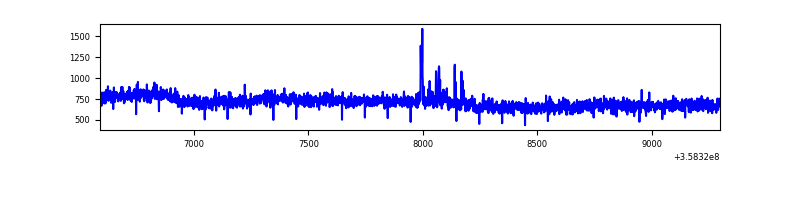 |
| C | 2709 | 2709 | 1179 | 1179 | 43.52% | 43.52% | 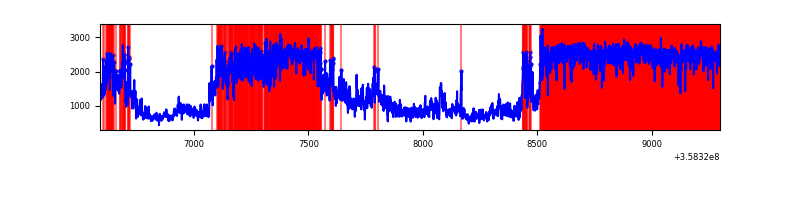 |
| D | 2710 | 2710 | 1 | 1 | 0.04% | 0.04% | 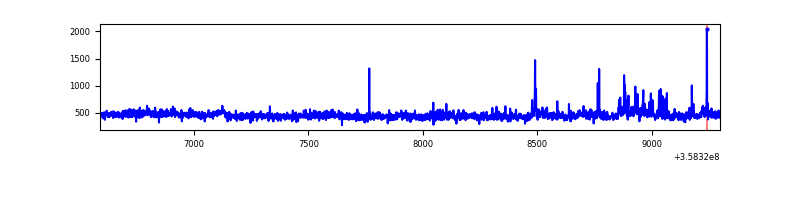 |
Top three noisy pixels from each quadrant. If the there are fewer than three noisy pixels in the level2.evt file, extra rows are filled as -1
| Pixel properties | Quadrant properties | ||||||
|---|---|---|---|---|---|---|---|
| Quadrant | DetID | PixID | Counts | Sigma | Mean | Median | Sigma |
| A | 13 | 254 | 5187 | 77.86 | 304 | 297 | 62.8 |
| A | 3 | 137 | 3105 | 44.71 | 304 | 297 | 62.8 |
| A | 0 | 226 | 2529 | 35.54 | 304 | 297 | 62.8 |
| B | 6 | 159 | 735237 | 12511.41 | 297 | 290 | 58.7 |
| B | 0 | 190 | 14957 | 249.68 | 297 | 290 | 58.7 |
| B | 12 | 111 | 7069 | 115.4 | 297 | 290 | 58.7 |
| C | 3 | 233 | 3578494 | 62515.26 | 239 | 240 | 57.2 |
| C | 14 | 238 | 37386 | 648.97 | 239 | 240 | 57.2 |
| C | 2 | 114 | 4952 | 82.32 | 239 | 240 | 57.2 |
| D | 8 | 195 | 62996 | 868.39 | 298 | 291 | 72.2 |
| D | 2 | 250 | 29318 | 401.99 | 298 | 291 | 72.2 |
| D | 2 | 234 | 12151 | 164.25 | 298 | 291 | 72.2 |
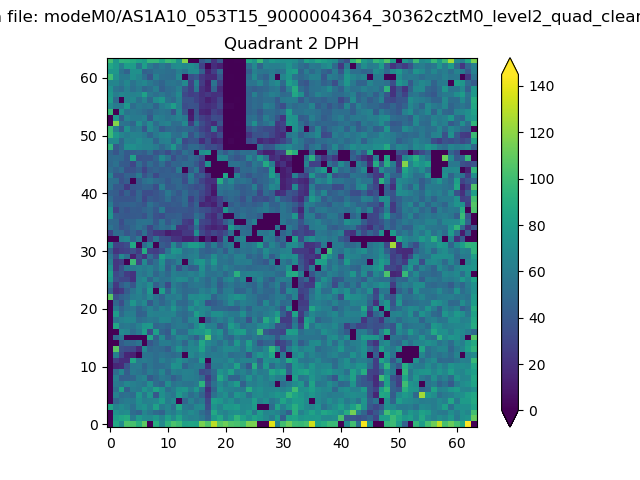
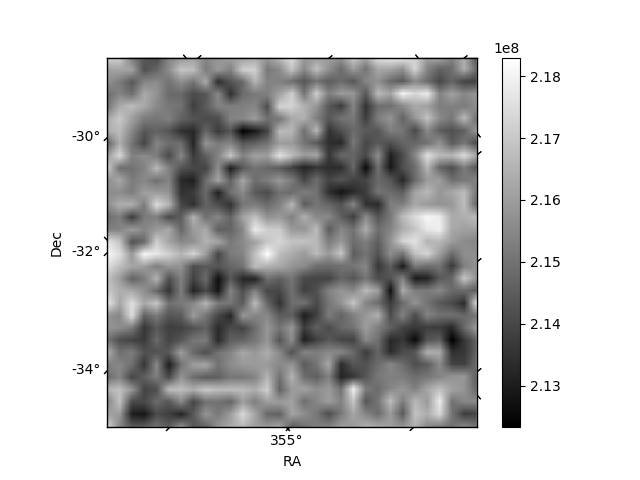
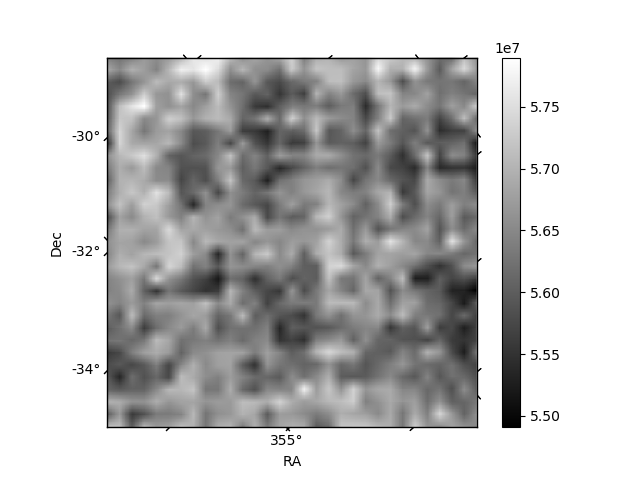
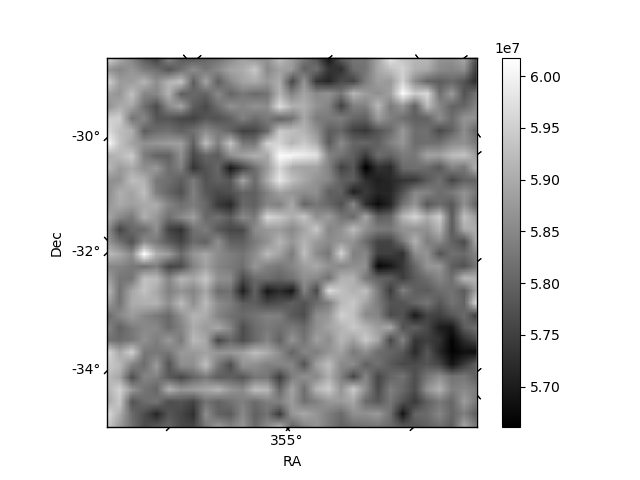
Histogram calculated using DETX and DETY for each event in the final _common_clean file
| Quadrant A | 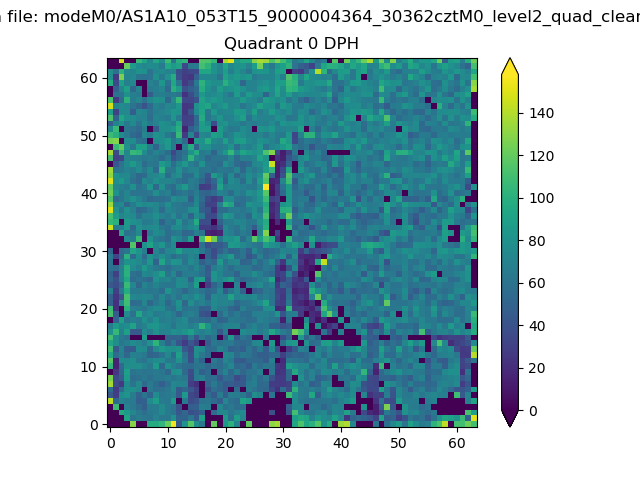 |
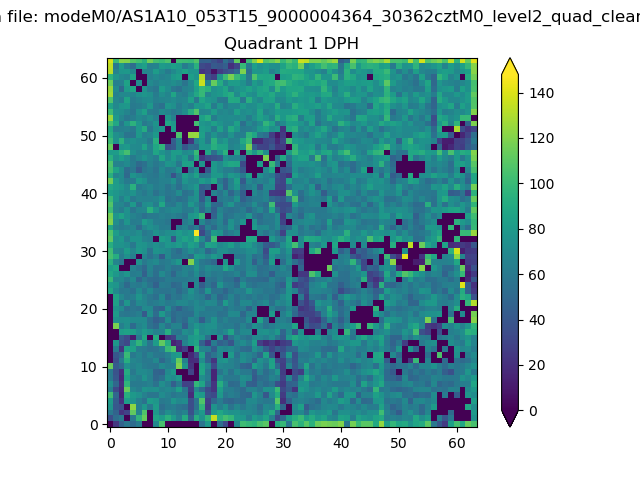 |
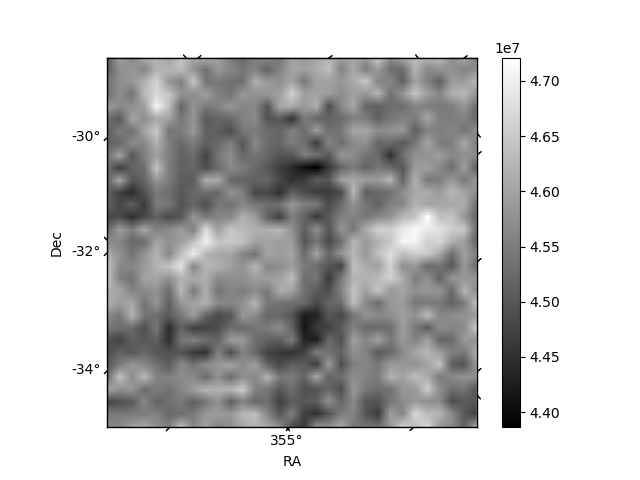
Quadrant B |
|---|---|---|---|
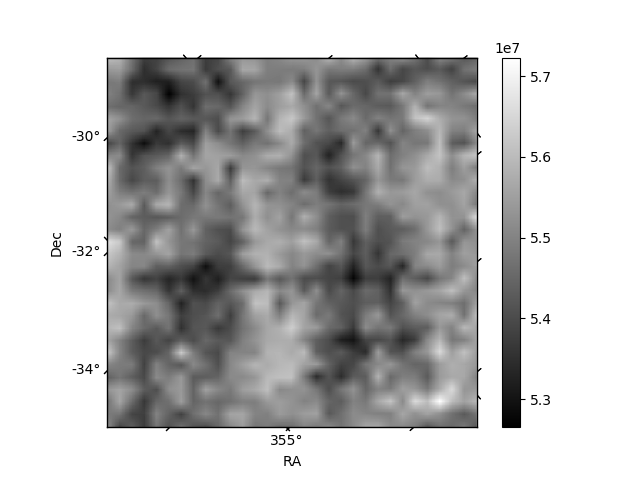
| Quadrant D | 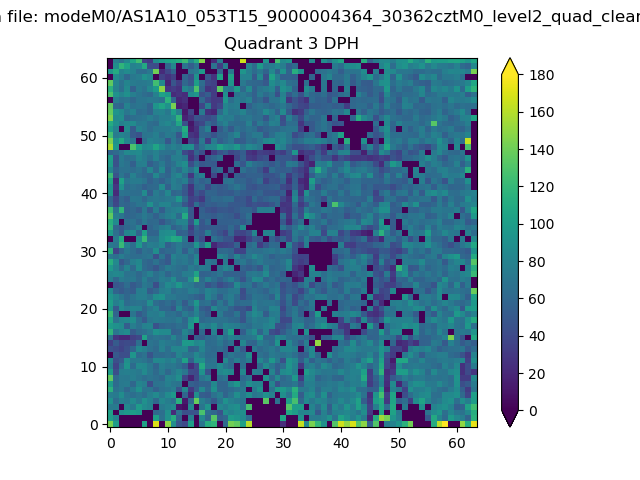 |
 |
Quadrant C |
| Plot type | Count rate plots | Images |
|---|---|---|
| Comparison with Poisson distribution Blue bars denote a histogram of data divided into 1 sec bins. Red curve is a Poisson curve with rate = median count rate of data. |
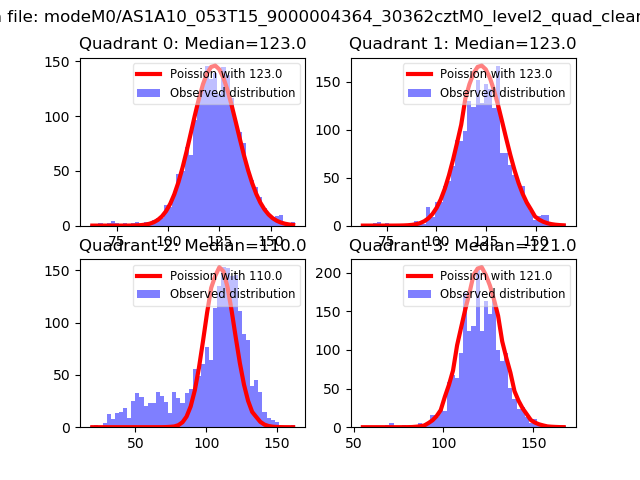 |
 |
| Quadrant-wise count rates Data is divided into 100 sec bins |
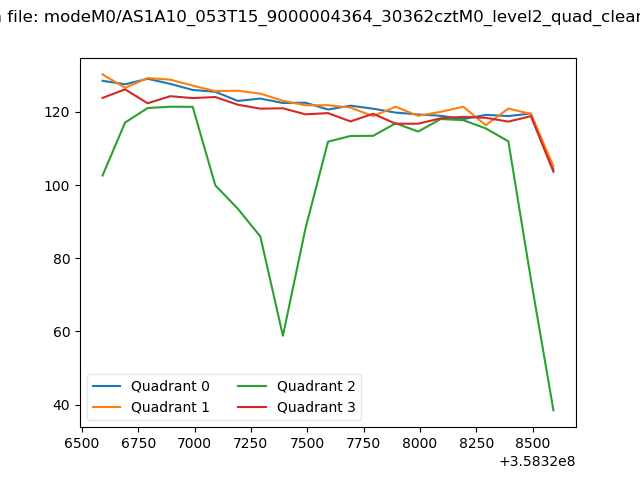 |
|
| Module-wise count rates for Quadrant A Data is divided into 100 sec bins |
 |
 |
| Module-wise count rates for Quadrant B Data is divided into 100 sec bins |
 |
 |
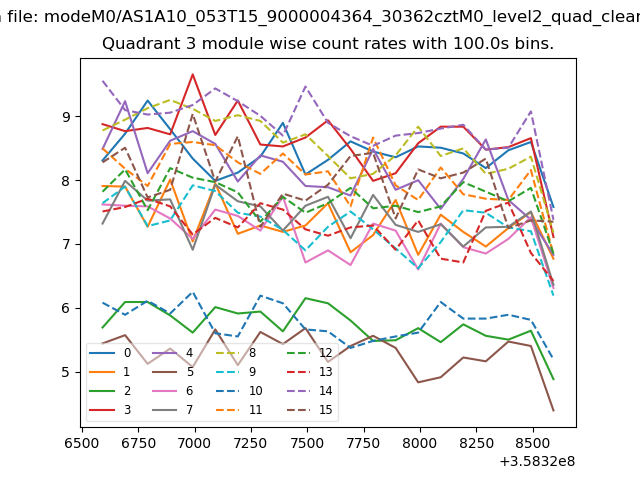
| Module-wise count rates for Quadrant C Data is divided into 100 sec bins |
 |
 |
| Module-wise count rates for Quadrant D Data is divided into 100 sec bins |
 |
 |
| Parameter | Plot |
|---|---|
| CZT HV Monitor |  |
| D_VDD | 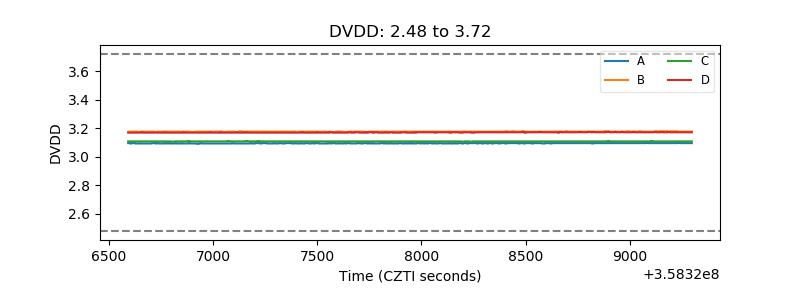 |
| Temperature 1 | 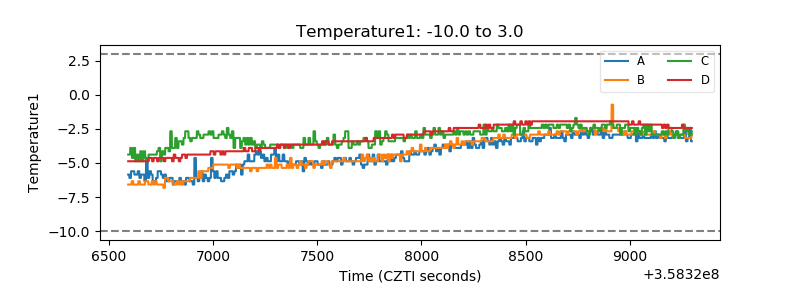 |
| Veto HV Monitor | 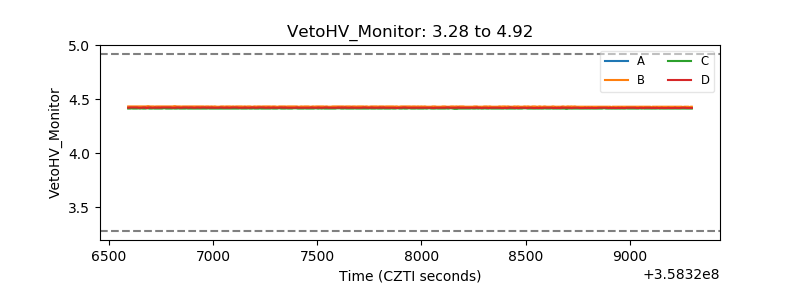 |
| Veto LLD | 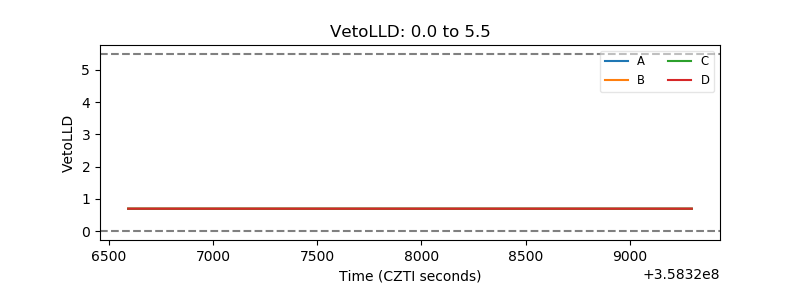 |
| Alpha Counter | 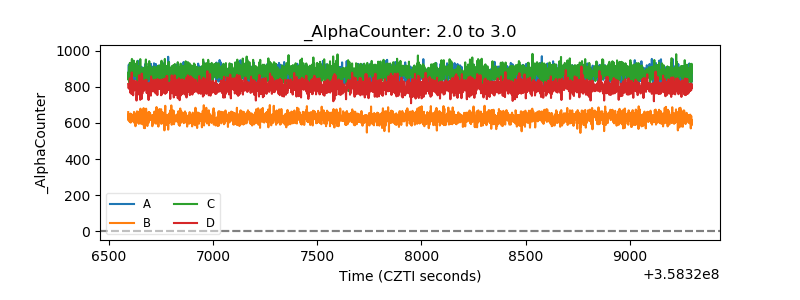 |
| _CPM_Rate | 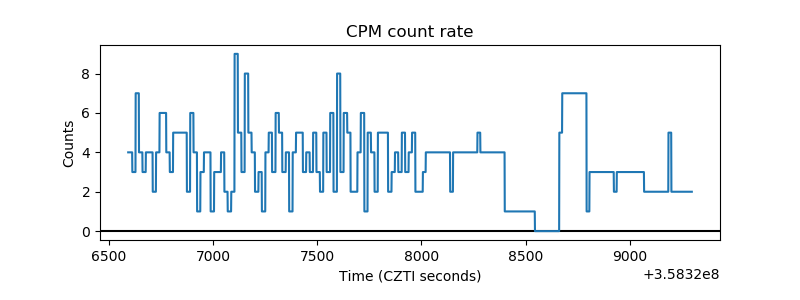 |
| CZT Counter | 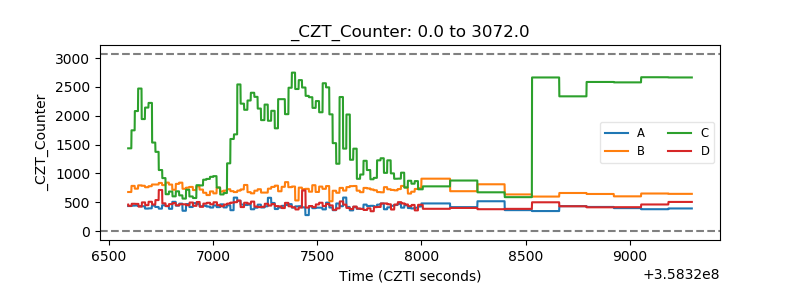 |
| +2.5 Volts monitor | 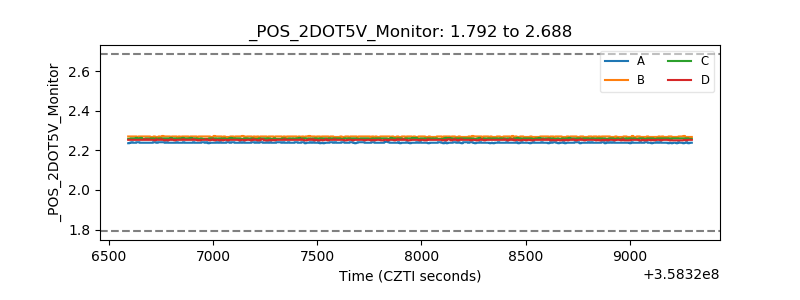 |
| +5 Volts monitor | 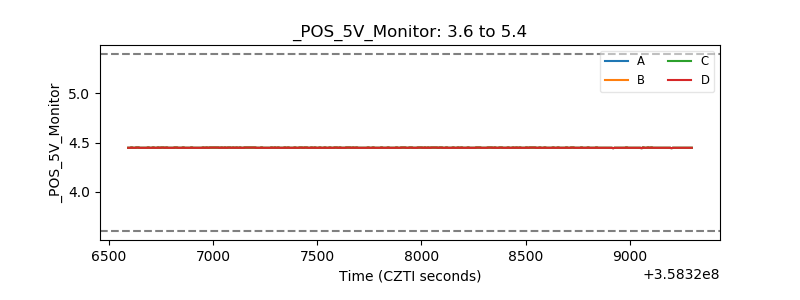 |
| _ROLL_ROT | 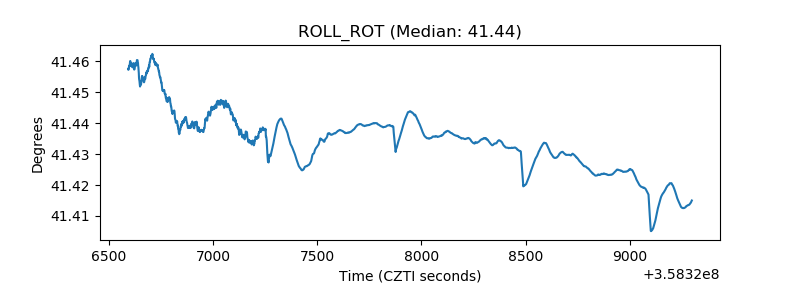 |
| _Roll_DEC |  |
| _Roll_RA | 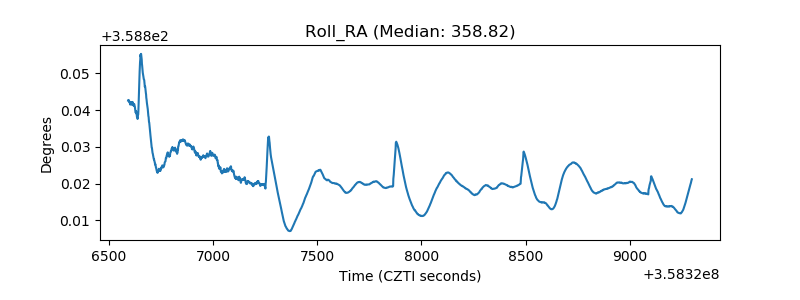 |
| Veto Counter |  |