| Param | Original file | Final file |
|---|---|---|
| Filename | modeM0/AS1A10_053T17_9000004366cztM0_level2.fits | modeM0/AS1A10_053T17_9000004366cztM0_level2_quad_clean.evt |
| Size (bytes) | 528,318,720 | 350,242,560 |
| Size | 503.8 MB | 334.0 MB |
| Events in quadrant A | 3,332,228 | 1,877,937 |
| Events in quadrant B | 3,162,270 | 1,881,346 |
| Events in quadrant C | 3,175,092 | 1,719,828 |
| Events in quadrant D | 2,869,060 | 1,663,429 |
| Mode M0 | |||
|---|---|---|---|
| Quadrant | BADHDUFLAG | Total packets | Discarded packets |
| A | 0 | 112456 | 0 |
| B | 0 | 152893 | 0 |
| C | 0 | 136476 | 0 |
| D | 0 | 110789 | 0 |
| Mode M9 | |||
|---|---|---|---|
| Quadrant | BADHDUFLAG | Total packets | Discarded packets |
| A | 0 | 104 | 0 |
| B | 0 | 104 | 0 |
| C | 0 | 104 | 0 |
| D | 0 | 104 | 0 |
| Mode SS | |||
|---|---|---|---|
| Quadrant | BADHDUFLAG | Total packets | Discarded packets |
| A | 0 | 1030 | 0 |
| B | 0 | 1030 | 0 |
| C | 0 | 1030 | 0 |
| D | 0 | 1030 | 0 |
| Quadrant | Total seconds | Saturated seconds | Saturation percentage |
|---|---|---|---|
| A | 50436 | 1048 | 2.077881% |
| B | 50436 | 948 | 1.879610% |
| C | 50436 | 2420 | 4.798160% |
| D | 50436 | 614 | 1.217384% |
Noise dominated data is calculated using 1-second bins in cleaned event files. If a bin has >2000 counts, and if more than 50% of those come from <1% of pixels, then it is considered to be noise-dominated and hence unusable.
| Quadrant | # 1 sec bins | Bins with >0 counts | Bins with >2000 counts | High rate bins dominated by noise | Noise dominated (total time) | Noise dominated (detector-on time) | Marked lightcurve |
|---|---|---|---|---|---|---|---|
| A | 60862 | 50417 | 0 | 0 | 0.00% | 0.00% | 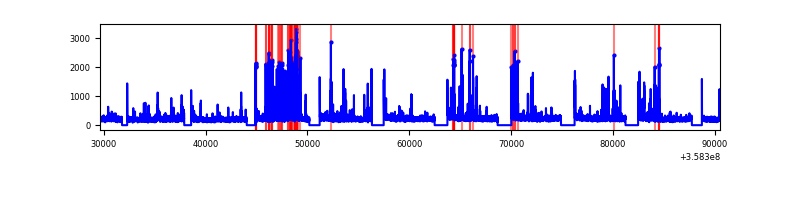 |
| B | 60862 | 50425 | 0 | 0 | 0.00% | 0.00% |  |
| C | 60862 | 50426 | 0 | 0 | 0.00% | 0.00% |  |
| D | 60862 | 50427 | 0 | 0 | 0.00% | 0.00% |  |
Top three noisy pixels from each quadrant. If the there are fewer than three noisy pixels in the level2.evt file, extra rows are filled as -1
| Pixel properties | Quadrant properties | ||||||
|---|---|---|---|---|---|---|---|
| Quadrant | DetID | PixID | Counts | Sigma | Mean | Median | Sigma |
| A | 0 | 29 | 2755 | 9.17 | 869 | 821 | 211.0 |
| A | 7 | 110 | 2583 | 8.35 | 869 | 821 | 211.0 |
| A | 9 | 19 | 2471 | 7.82 | 869 | 821 | 211.0 |
| B | 2 | 9 | 2477 | 10.1 | 837 | 803 | 165.8 |
| B | 5 | 128 | 2143 | 8.08 | 837 | 803 | 165.8 |
| B | 3 | 17 | 2111 | 7.89 | 837 | 803 | 165.8 |
| C | 12 | 241 | 2161 | 6.51 | 839 | 791 | 210.5 |
| C | 3 | 187 | 2156 | 6.48 | 839 | 791 | 210.5 |
| C | 3 | 126 | 2117 | 6.3 | 839 | 791 | 210.5 |
| D | 15 | 46 | 2242 | 6.9 | 819 | 748 | 216.7 |
| D | 3 | 14 | 2015 | 5.85 | 819 | 748 | 216.7 |
| D | 6 | 67 | 2013 | 5.84 | 819 | 748 | 216.7 |
Histogram calculated using DETX and DETY for each event in the final _common_clean file
| Quadrant A |  |
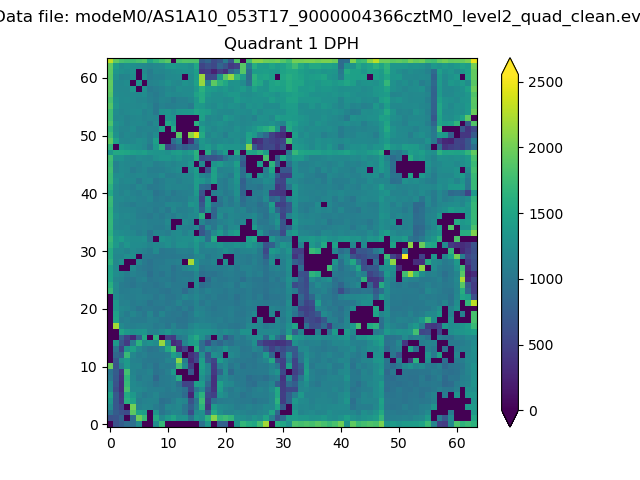 |
Quadrant B |
|---|---|---|---|
| Quadrant D | 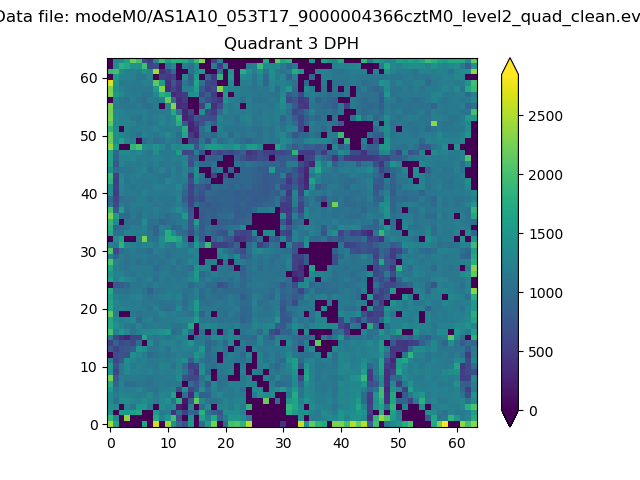 |
 |
Quadrant C |
| Plot type | Count rate plots | Images |
|---|---|---|
| Comparison with Poisson distribution Blue bars denote a histogram of data divided into 1 sec bins. Red curve is a Poisson curve with rate = median count rate of data. |
 |
 |
| Quadrant-wise count rates Data is divided into 100 sec bins |
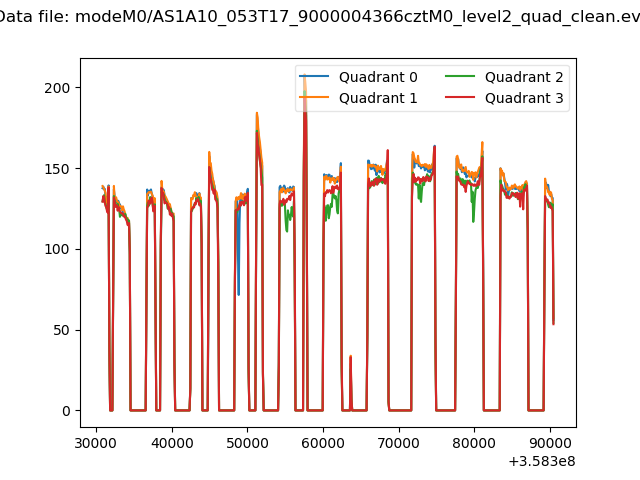 |
|
| Module-wise count rates for Quadrant A Data is divided into 100 sec bins |
 |
 |
| Module-wise count rates for Quadrant B Data is divided into 100 sec bins |
 |
 |
| Module-wise count rates for Quadrant C Data is divided into 100 sec bins |
 |
 |
| Module-wise count rates for Quadrant D Data is divided into 100 sec bins |
 |
 |
| Parameter | Plot |
|---|---|
| CZT HV Monitor | 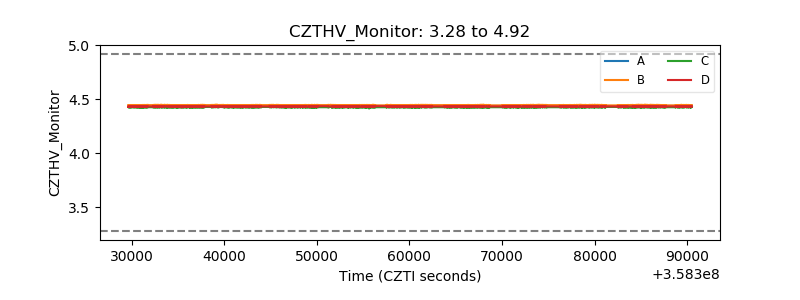 |
| D_VDD |  |
| Temperature 1 | 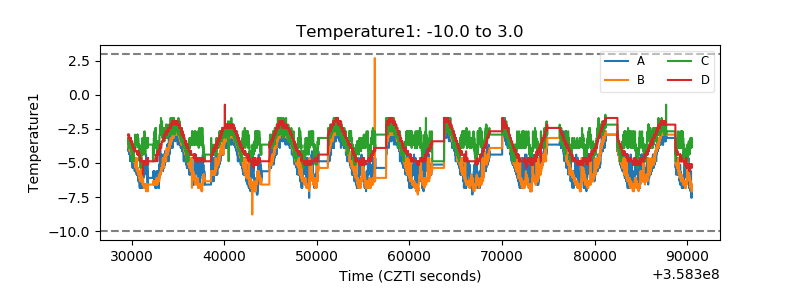 |
| Veto HV Monitor |  |
| Veto LLD |  |
| Alpha Counter | 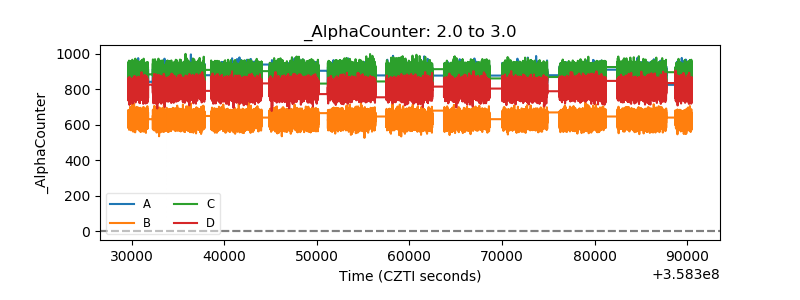 |
| _CPM_Rate |  |
| CZT Counter |  |
| +2.5 Volts monitor | 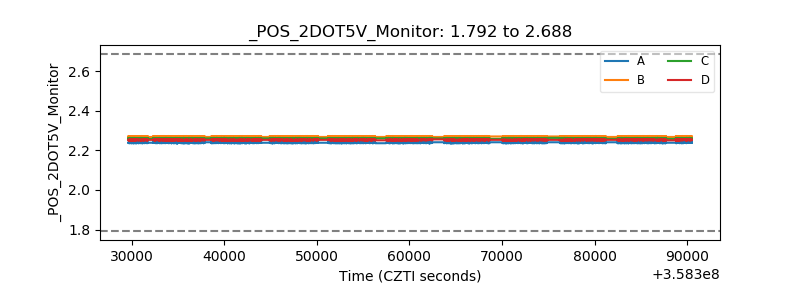 |
| +5 Volts monitor |  |
| _ROLL_ROT |  |
| _Roll_DEC |  |
| _Roll_RA |  |
| Veto Counter | 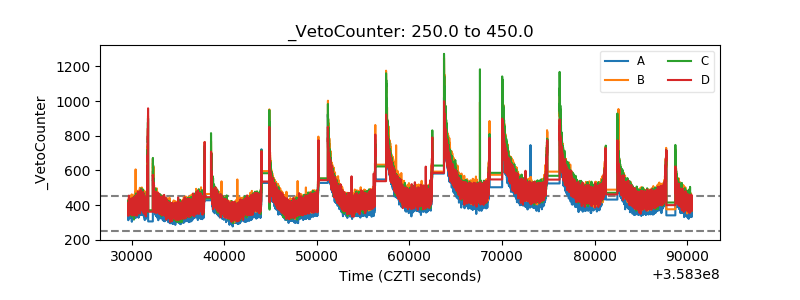 |