| Param | Original file | Final file |
|---|---|---|
| Filename | modeM0/AS1A10_053T17_9000004366_30362cztM0_level2.evt | modeM0/AS1A10_053T17_9000004366_30362cztM0_level2_quad_clean.evt |
| Size (bytes) | 728,153,280 | 123,010,560 |
| Size | 694.4 MB | 117.3 MB |
| Events in quadrant A | 4,609,648 | 776,018 |
| Events in quadrant B | 7,132,086 | 780,834 |
| Events in quadrant C | 4,965,988 | 759,444 |
| Events in quadrant D | 4,709,333 | 758,033 |
| Mode M0 | |||
|---|---|---|---|
| Quadrant | BADHDUFLAG | Total packets | Discarded packets |
| A | 0 | 19424 | 2 |
| B | 0 | 28218 | 4 |
| C | 0 | 20257 | 2 |
| D | 0 | 19852 | 2 |
| Mode M9 | |||
|---|---|---|---|
| Quadrant | BADHDUFLAG | Total packets | Discarded packets |
| A | 0 | 12 | 0 |
| B | 0 | 12 | 0 |
| C | 0 | 12 | 0 |
| D | 0 | 12 | 0 |
| Mode SS | |||
|---|---|---|---|
| Quadrant | BADHDUFLAG | Total packets | Discarded packets |
| A | 0 | 192 | 0 |
| B | 0 | 192 | 0 |
| C | 0 | 192 | 0 |
| D | 0 | 192 | 0 |
| Quadrant | Total seconds | Saturated seconds | Saturation percentage |
|---|---|---|---|
| A | 9387 | 115 | 1.225099% |
| B | 9386 | 174 | 1.853825% |
| C | 9386 | 243 | 2.588962% |
| D | 9386 | 104 | 1.108033% |
Noise dominated data is calculated using 1-second bins in cleaned event files. If a bin has >2000 counts, and if more than 50% of those come from <1% of pixels, then it is considered to be noise-dominated and hence unusable.
| Quadrant | # 1 sec bins | Bins with >0 counts | Bins with >2000 counts | High rate bins dominated by noise | Noise dominated (total time) | Noise dominated (detector-on time) | Marked lightcurve |
|---|---|---|---|---|---|---|---|
| A | 10582 | 9387 | 0 | 0 | 0.00% | 0.00% | 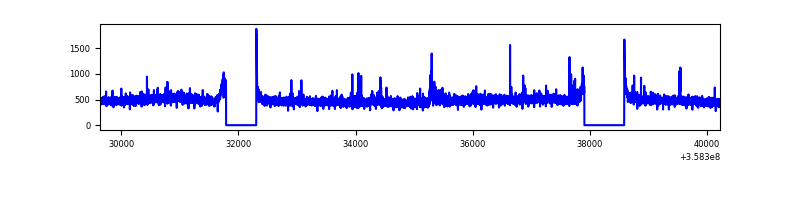 |
| B | 10581 | 9386 | 1 | 1 | 0.01% | 0.01% | 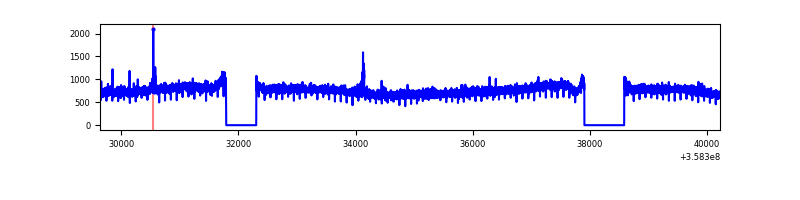 |
| C | 10581 | 9386 | 73 | 73 | 0.69% | 0.78% | 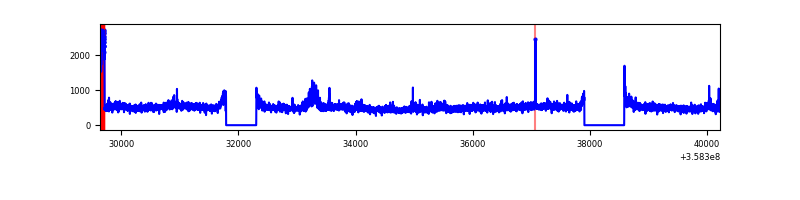 |
| D | 10581 | 9386 | 10 | 10 | 0.09% | 0.11% | 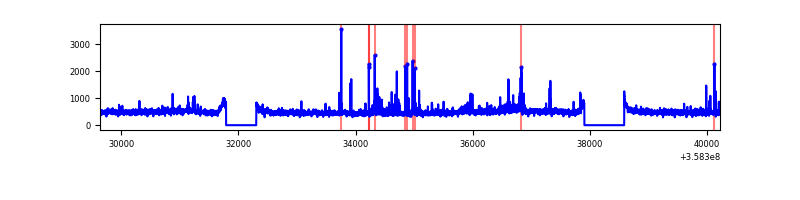 |
Top three noisy pixels from each quadrant. If the there are fewer than three noisy pixels in the level2.evt file, extra rows are filled as -1
| Pixel properties | Quadrant properties | ||||||
|---|---|---|---|---|---|---|---|
| Quadrant | DetID | PixID | Counts | Sigma | Mean | Median | Sigma |
| A | 14 | 239 | 89897 | 378.83 | 1156 | 1130 | 234.3 |
| A | 12 | 96 | 25488 | 103.95 | 1156 | 1130 | 234.3 |
| A | 8 | 192 | 24587 | 100.11 | 1156 | 1130 | 234.3 |
| B | 6 | 159 | 2616130 | 11793.83 | 1139 | 1106 | 221.7 |
| B | 12 | 111 | 28444 | 123.3 | 1139 | 1106 | 221.7 |
| B | 0 | 190 | 27221 | 117.78 | 1139 | 1106 | 221.7 |
| C | 3 | 233 | 455654 | 1751.13 | 1105 | 1111 | 259.6 |
| C | 14 | 238 | 175626 | 672.32 | 1105 | 1111 | 259.6 |
| C | 2 | 114 | 22005 | 80.49 | 1105 | 1111 | 259.6 |
| D | 8 | 195 | 197559 | 720.73 | 1126 | 1103 | 272.6 |
| D | 2 | 250 | 138649 | 504.61 | 1126 | 1103 | 272.6 |
| D | 13 | 104 | 73161 | 264.36 | 1126 | 1103 | 272.6 |
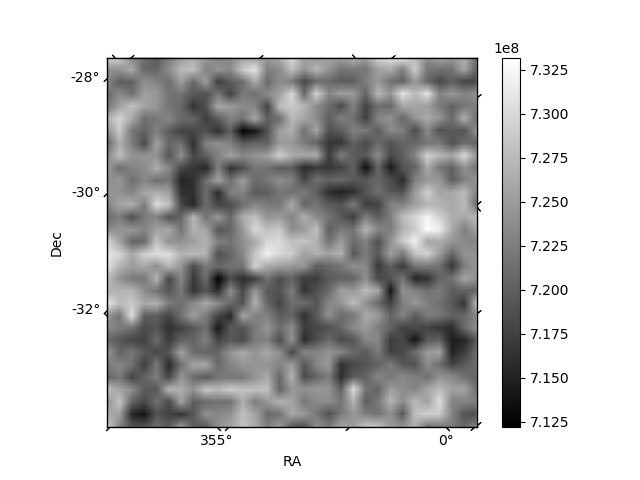
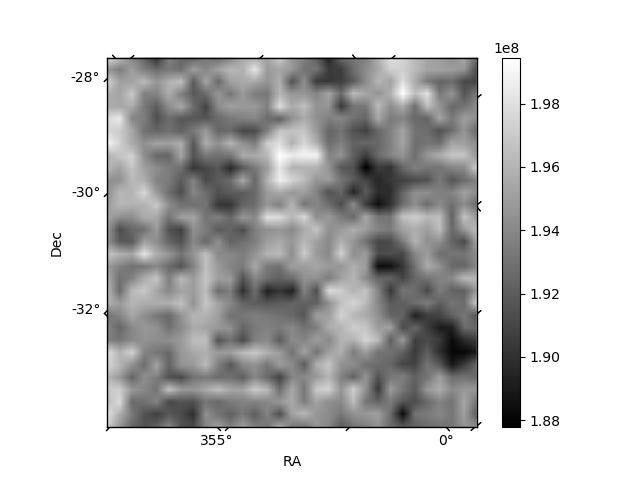
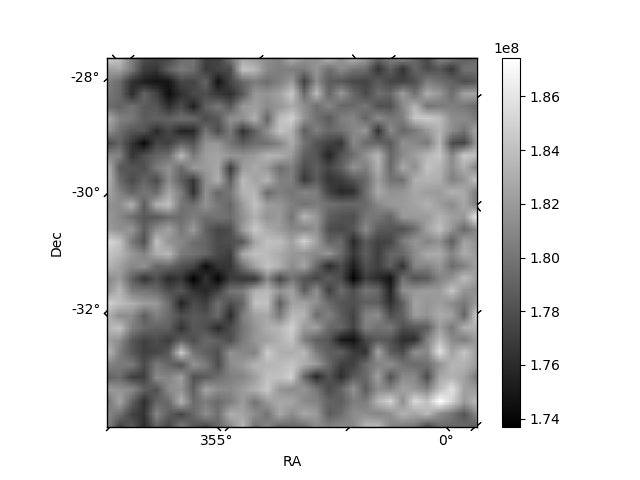
Histogram calculated using DETX and DETY for each event in the final _common_clean file
| Quadrant A | 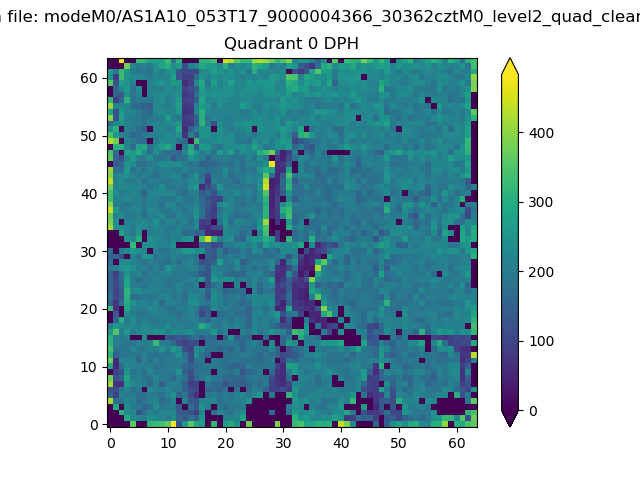 |
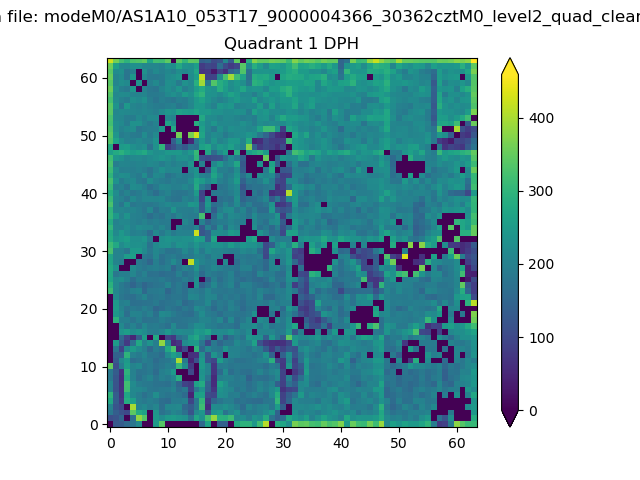 |
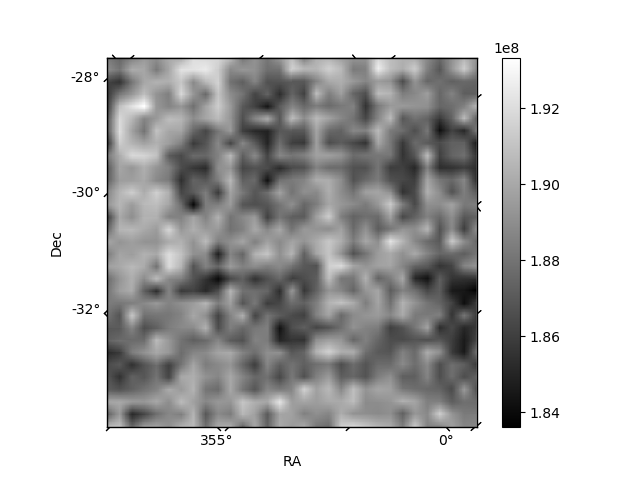
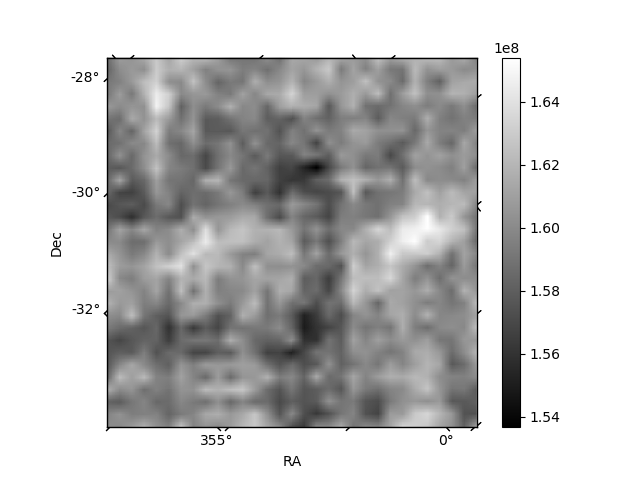
Quadrant B |
|---|---|---|---|
| Quadrant D |  |
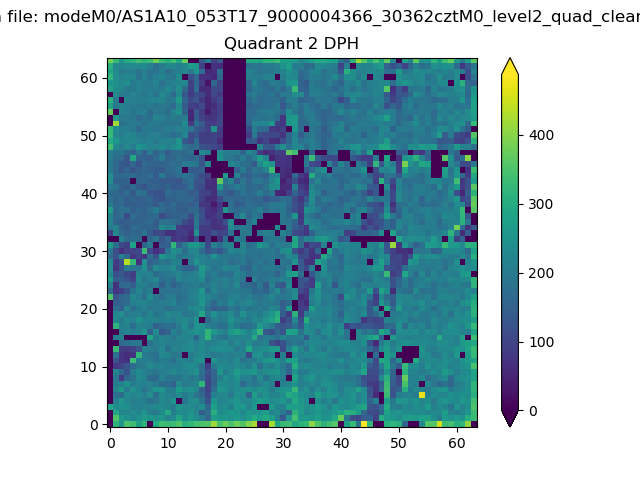 |
Quadrant C |
| Plot type | Count rate plots | Images |
|---|---|---|
| Comparison with Poisson distribution Blue bars denote a histogram of data divided into 1 sec bins. Red curve is a Poisson curve with rate = median count rate of data. |
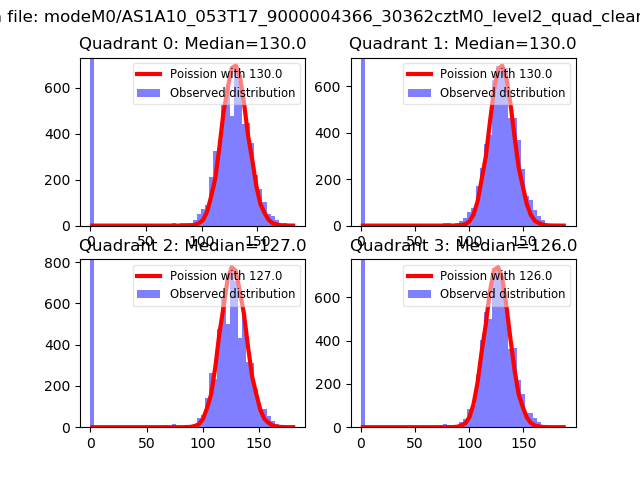 |
 |
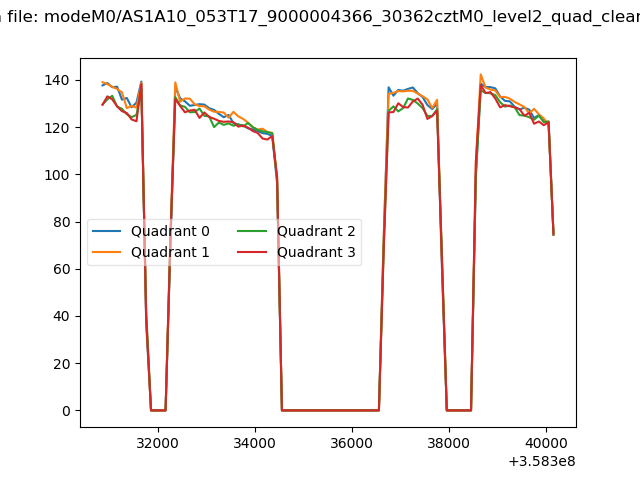
| Quadrant-wise count rates Data is divided into 100 sec bins |
 |
|
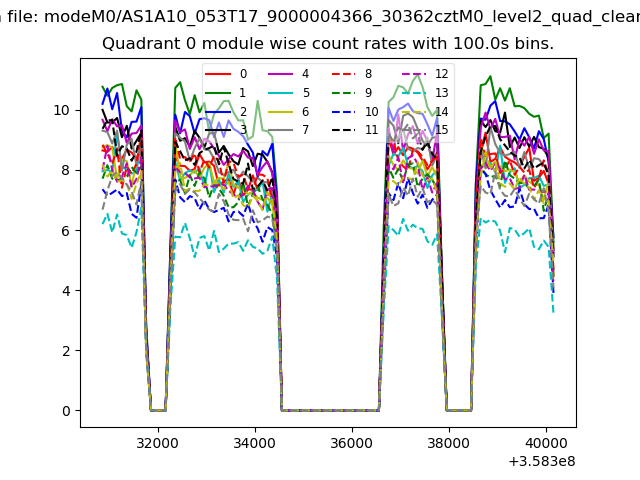
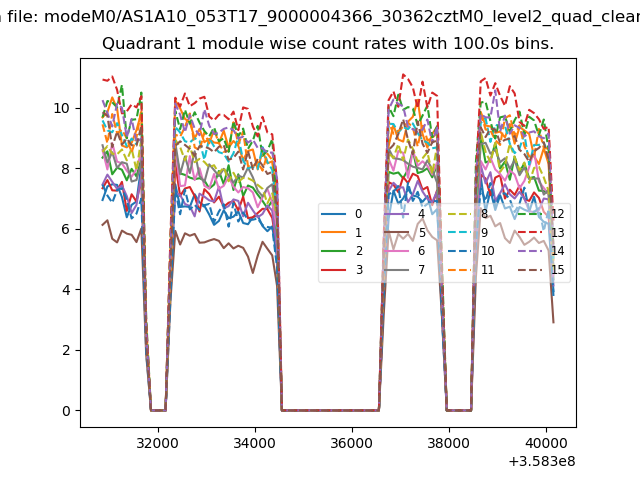
| Module-wise count rates for Quadrant A Data is divided into 100 sec bins |
 |
 |
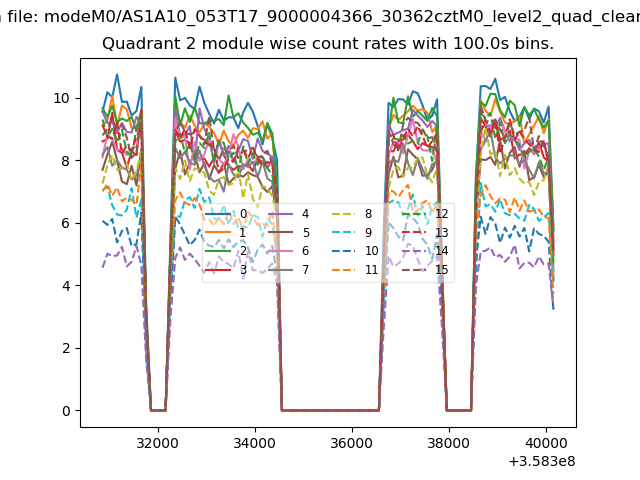
| Module-wise count rates for Quadrant B Data is divided into 100 sec bins |
 |
 |
| Module-wise count rates for Quadrant C Data is divided into 100 sec bins |
 |
 |
| Module-wise count rates for Quadrant D Data is divided into 100 sec bins |
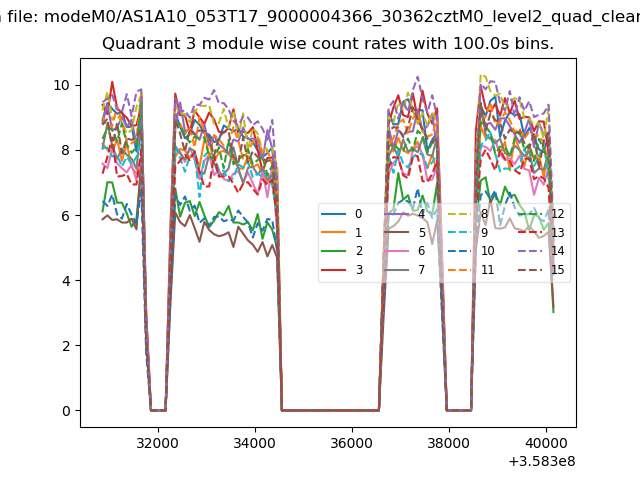 |
 |
| Parameter | Plot |
|---|---|
| CZT HV Monitor | 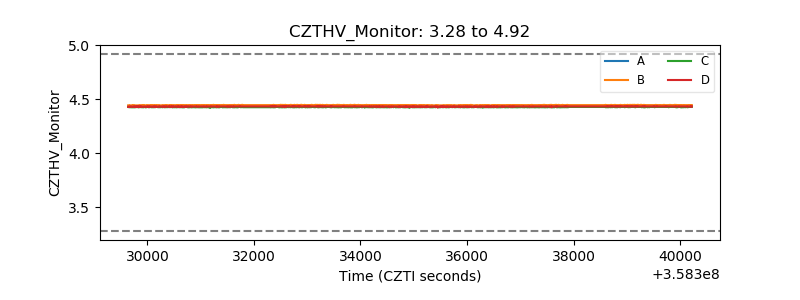 |
| D_VDD | 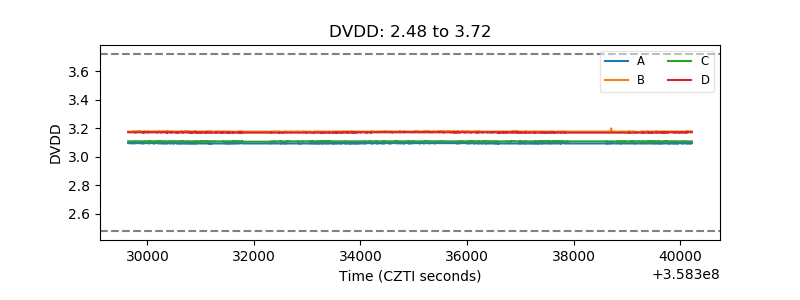 |
| Temperature 1 | 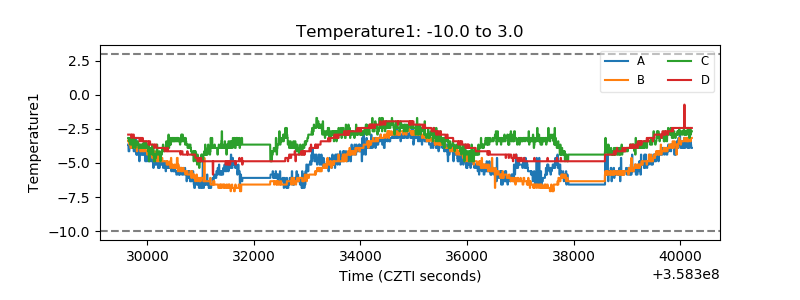 |
| Veto HV Monitor | 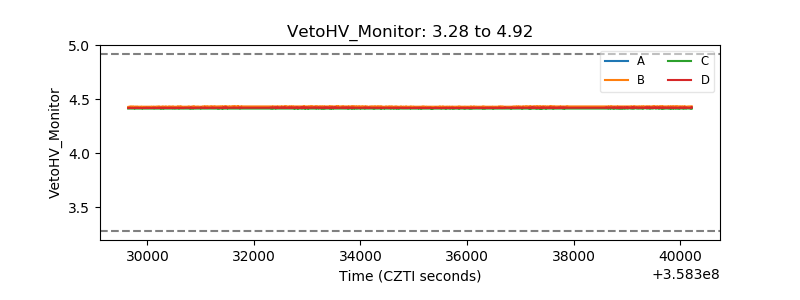 |
| Veto LLD | 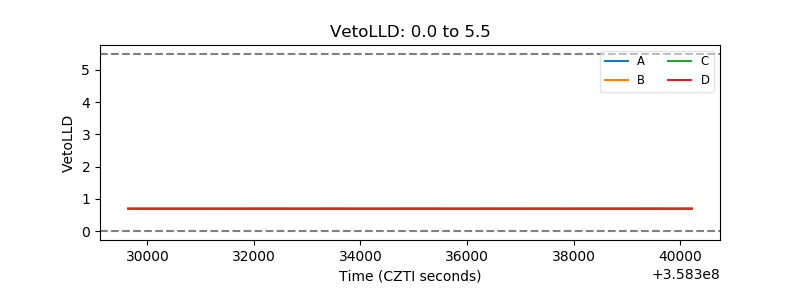 |
| Alpha Counter | 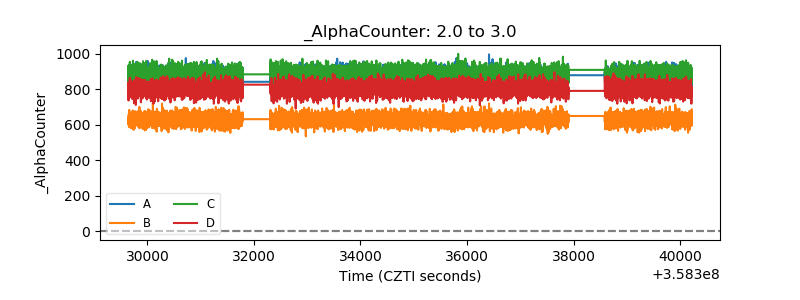 |
| _CPM_Rate | 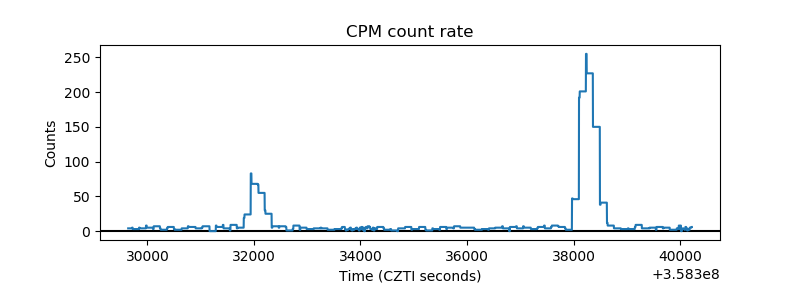 |
| CZT Counter |  |
| +2.5 Volts monitor | 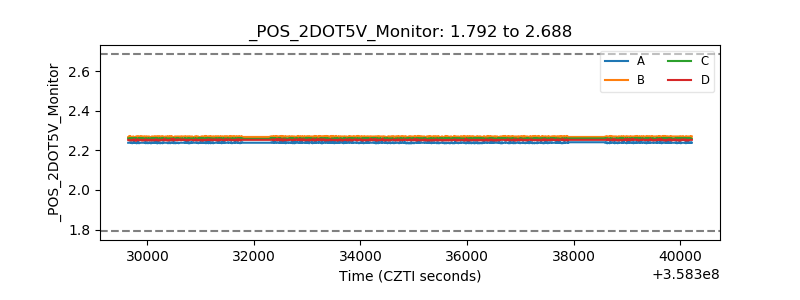 |
| +5 Volts monitor | 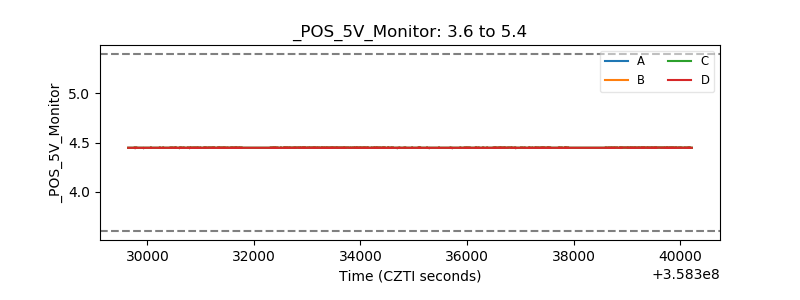 |
| _ROLL_ROT |  |
| _Roll_DEC |  |
| _Roll_RA | 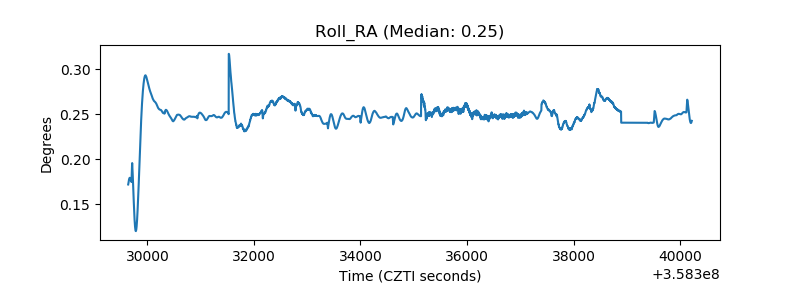 |
| Veto Counter | 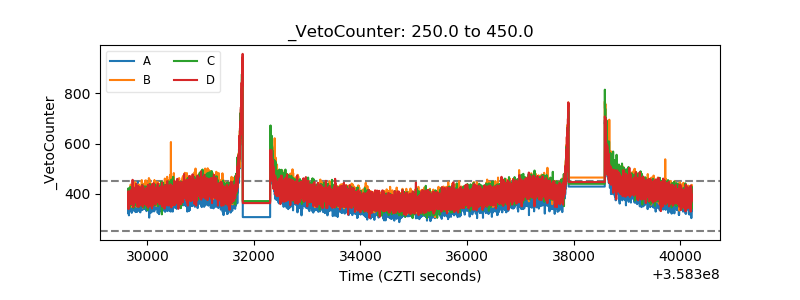 |