| Param | Original file | Final file |
|---|---|---|
| Filename | modeM0/AS1A10_053T17_9000004366_30364cztM0_level2.evt | modeM0/AS1A10_053T17_9000004366_30364cztM0_level2_quad_clean.evt |
| Size (bytes) | 516,611,520 | 76,181,760 |
| Size | 492.7 MB | 72.7 MB |
| Events in quadrant A | 4,091,957 | 469,993 |
| Events in quadrant B | 4,568,243 | 484,820 |
| Events in quadrant C | 3,356,085 | 464,594 |
| Events in quadrant D | 3,216,987 | 462,607 |
| Mode M0 | |||
|---|---|---|---|
| Quadrant | BADHDUFLAG | Total packets | Discarded packets |
| A | 0 | 15967 | 1 |
| B | 0 | 18318 | 1 |
| C | 0 | 13736 | 1 |
| D | 0 | 13292 | 1 |
| Mode M9 | |||
|---|---|---|---|
| Quadrant | BADHDUFLAG | Total packets | Discarded packets |
| A | 0 | 10 | 0 |
| B | 0 | 10 | 0 |
| C | 0 | 10 | 0 |
| D | 0 | 10 | 0 |
| Mode SS | |||
|---|---|---|---|
| Quadrant | BADHDUFLAG | Total packets | Discarded packets |
| A | 0 | 124 | 0 |
| B | 0 | 124 | 0 |
| C | 0 | 124 | 0 |
| D | 0 | 124 | 0 |
| Quadrant | Total seconds | Saturated seconds | Saturation percentage |
|---|---|---|---|
| A | 6080 | 340 | 5.592105% |
| B | 6081 | 74 | 1.216905% |
| C | 6081 | 157 | 2.581812% |
| D | 6081 | 85 | 1.397796% |
Noise dominated data is calculated using 1-second bins in cleaned event files. If a bin has >2000 counts, and if more than 50% of those come from <1% of pixels, then it is considered to be noise-dominated and hence unusable.
| Quadrant | # 1 sec bins | Bins with >0 counts | Bins with >2000 counts | High rate bins dominated by noise | Noise dominated (total time) | Noise dominated (detector-on time) | Marked lightcurve |
|---|---|---|---|---|---|---|---|
| A | 7100 | 6080 | 258 | 258 | 3.63% | 4.24% | 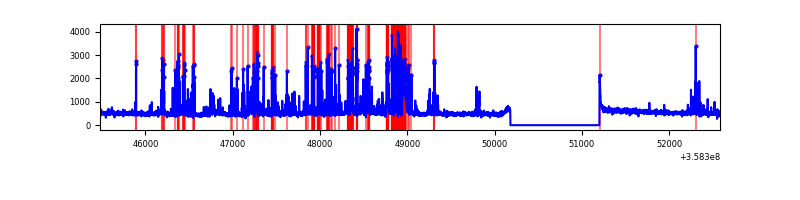 |
| B | 7101 | 6081 | 0 | 0 | 0.00% | 0.00% | 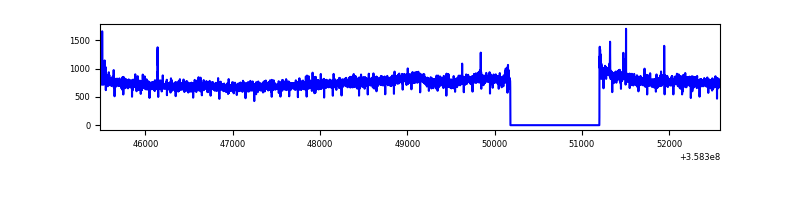 |
| C | 7101 | 6081 | 82 | 82 | 1.15% | 1.35% | 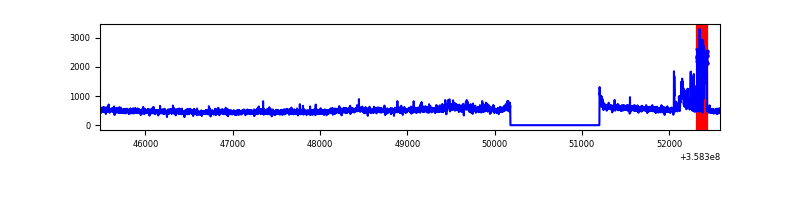 |
| D | 7101 | 6081 | 44 | 44 | 0.62% | 0.72% | 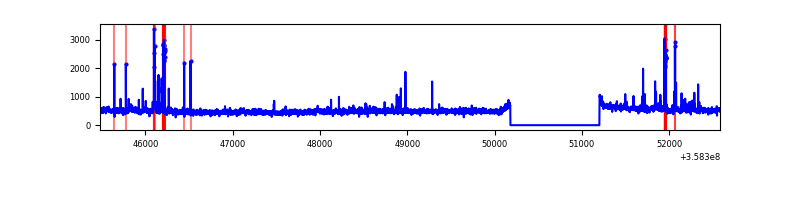 |
Top three noisy pixels from each quadrant. If the there are fewer than three noisy pixels in the level2.evt file, extra rows are filled as -1
| Pixel properties | Quadrant properties | ||||||
|---|---|---|---|---|---|---|---|
| Quadrant | DetID | PixID | Counts | Sigma | Mean | Median | Sigma |
| A | 0 | 13 | 893703 | 5934.88 | 749 | 733 | 150.5 |
| A | 12 | 96 | 291553 | 1932.85 | 749 | 733 | 150.5 |
| A | 8 | 192 | 12597 | 78.85 | 749 | 733 | 150.5 |
| B | 6 | 159 | 1596715 | 11133.25 | 751 | 735 | 143.4 |
| B | 0 | 190 | 20086 | 134.99 | 751 | 735 | 143.4 |
| B | 12 | 111 | 18090 | 121.07 | 751 | 735 | 143.4 |
| C | 3 | 233 | 415779 | 2465.67 | 720 | 723 | 168.3 |
| C | 14 | 238 | 119394 | 704.97 | 720 | 723 | 168.3 |
| C | 2 | 114 | 13814 | 77.77 | 720 | 723 | 168.3 |
| D | 8 | 195 | 179041 | 983.93 | 734 | 718 | 181.2 |
| D | 13 | 249 | 75109 | 410.47 | 734 | 718 | 181.2 |
| D | 2 | 250 | 55180 | 300.5 | 734 | 718 | 181.2 |
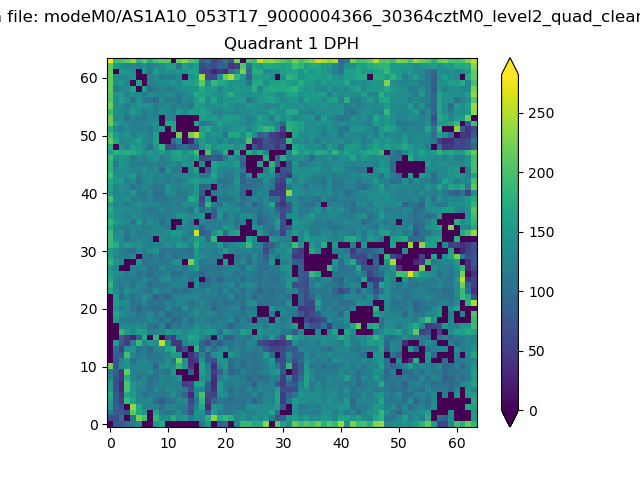
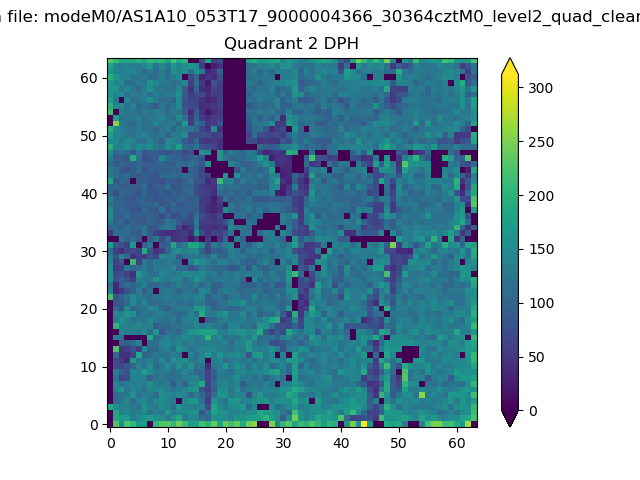
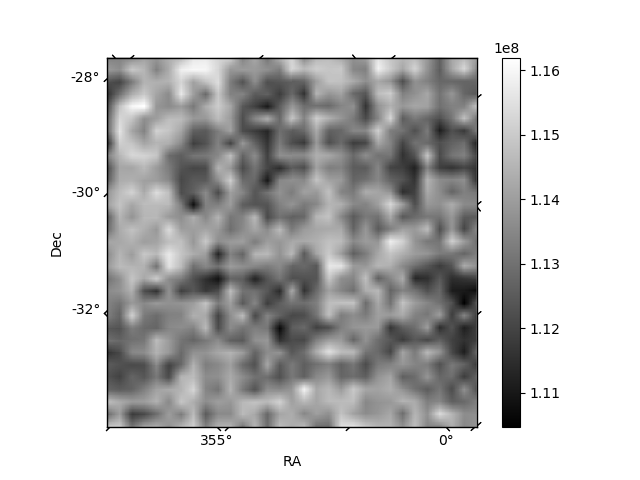
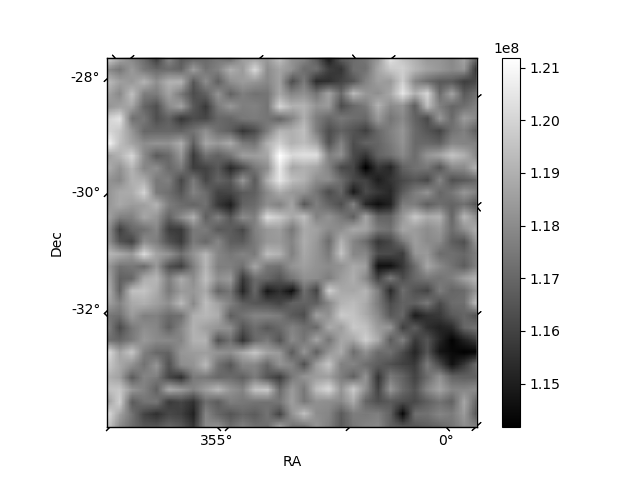
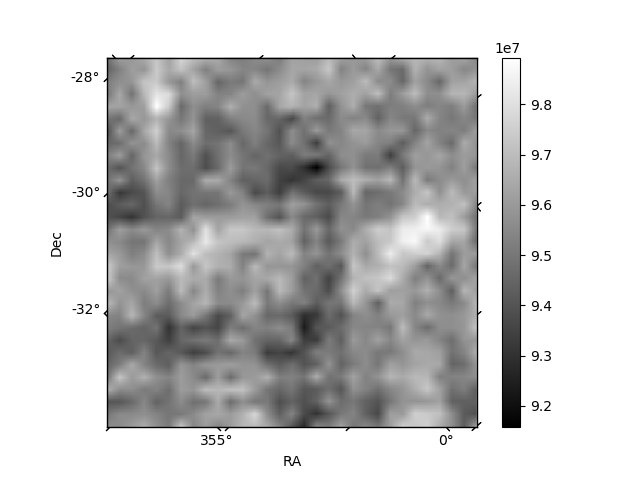
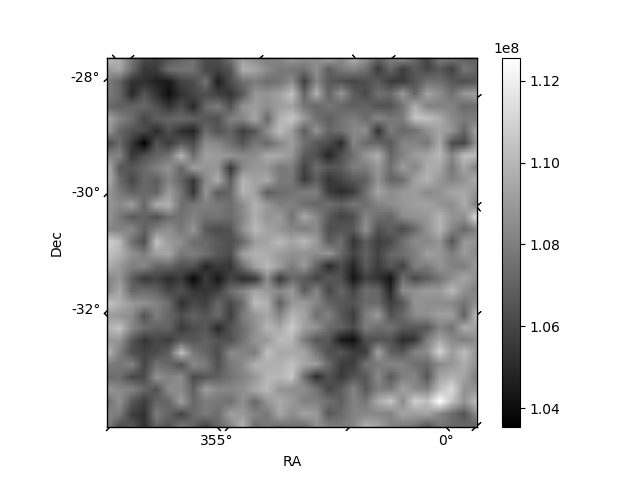
Histogram calculated using DETX and DETY for each event in the final _common_clean file
| Quadrant A |  |
 |
Quadrant B |
|---|---|---|---|
| Quadrant D | 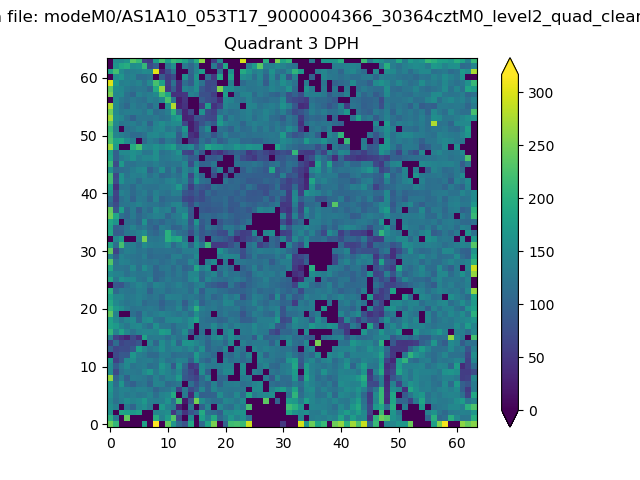 |
 |
Quadrant C |
| Plot type | Count rate plots | Images |
|---|---|---|
| Comparison with Poisson distribution Blue bars denote a histogram of data divided into 1 sec bins. Red curve is a Poisson curve with rate = median count rate of data. |
 |
 |
| Quadrant-wise count rates Data is divided into 100 sec bins |
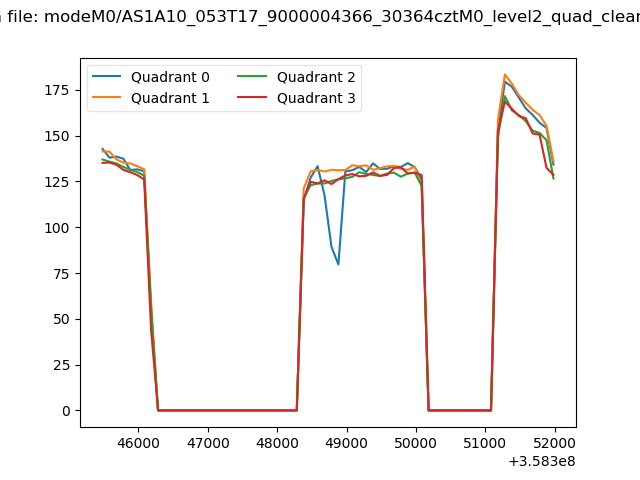 |
|
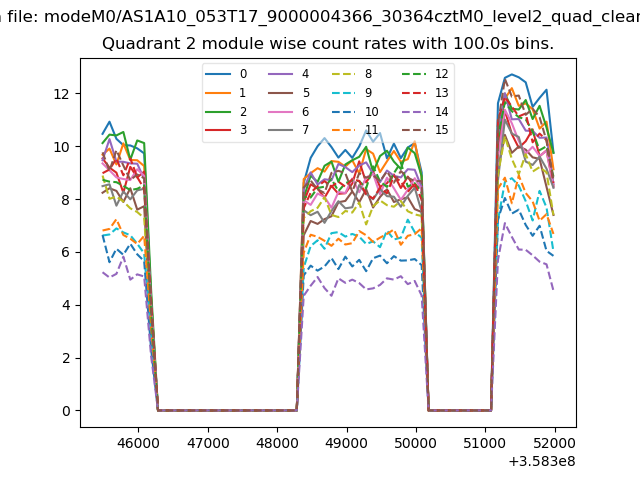
| Module-wise count rates for Quadrant A Data is divided into 100 sec bins |
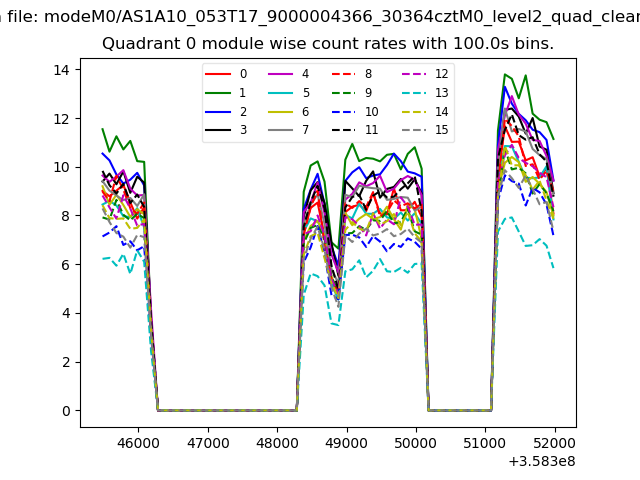 |
 |
| Module-wise count rates for Quadrant B Data is divided into 100 sec bins |
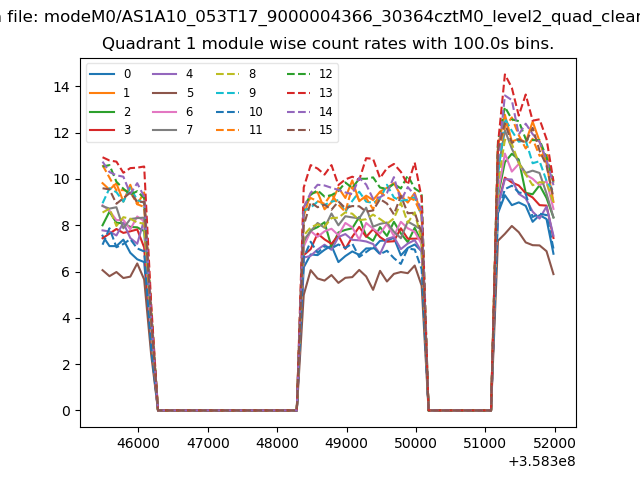 |
 |
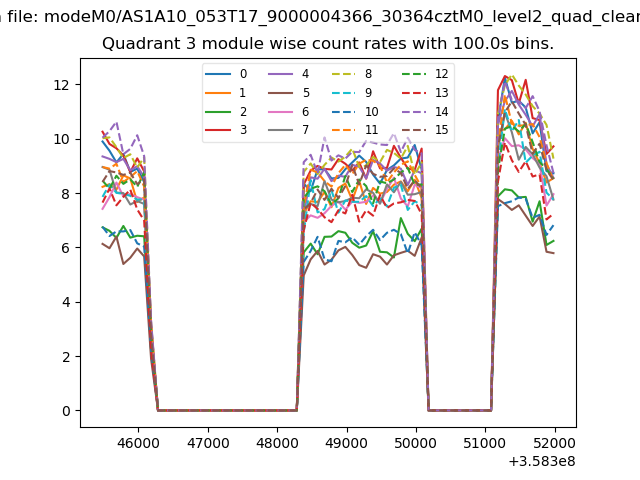
| Module-wise count rates for Quadrant C Data is divided into 100 sec bins |
 |
 |
| Module-wise count rates for Quadrant D Data is divided into 100 sec bins |
 |
 |
| Parameter | Plot |
|---|---|
| CZT HV Monitor | 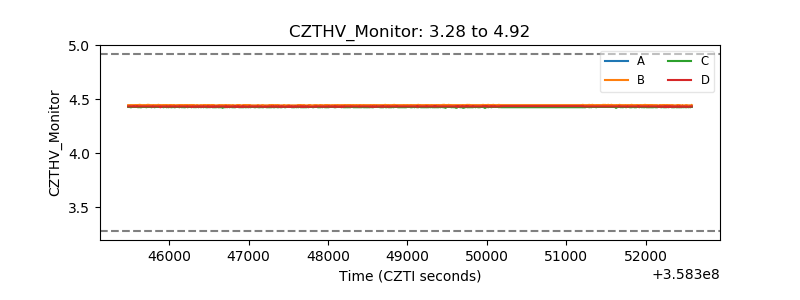 |
| D_VDD | 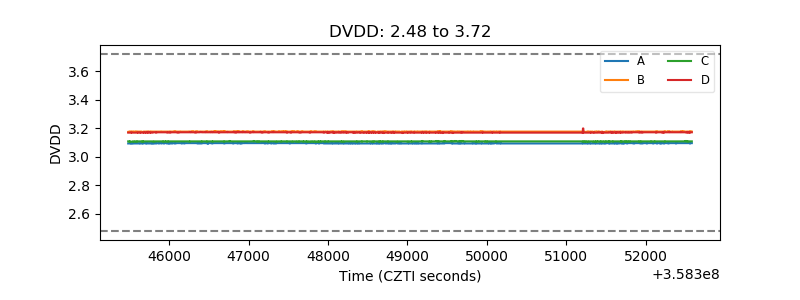 |
| Temperature 1 | 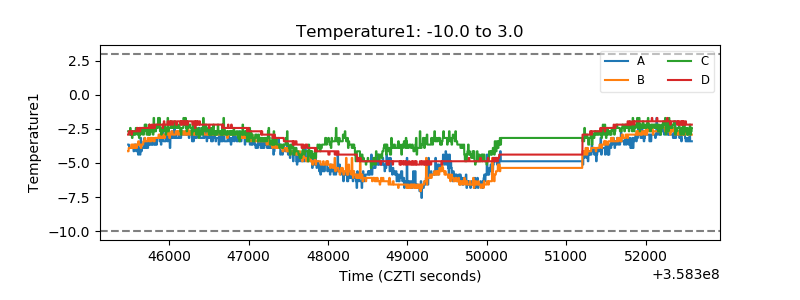 |
| Veto HV Monitor | 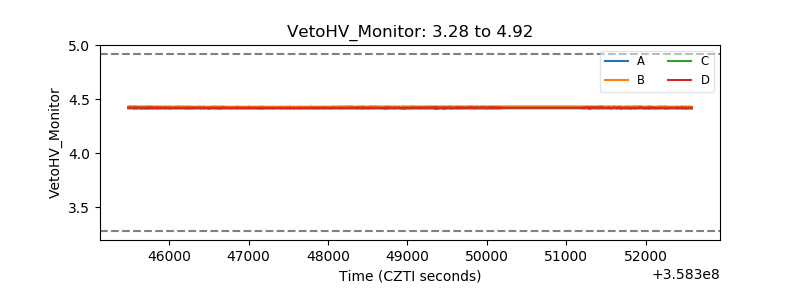 |
| Veto LLD | 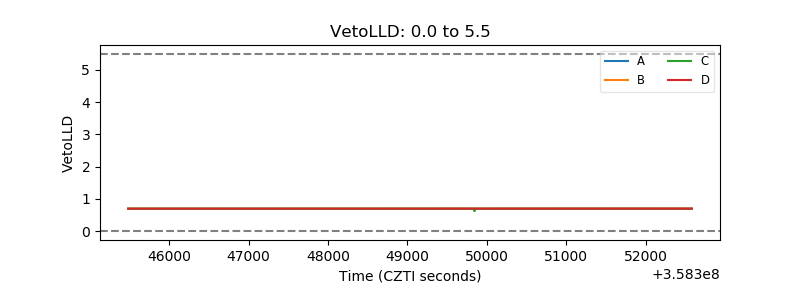 |
| Alpha Counter | 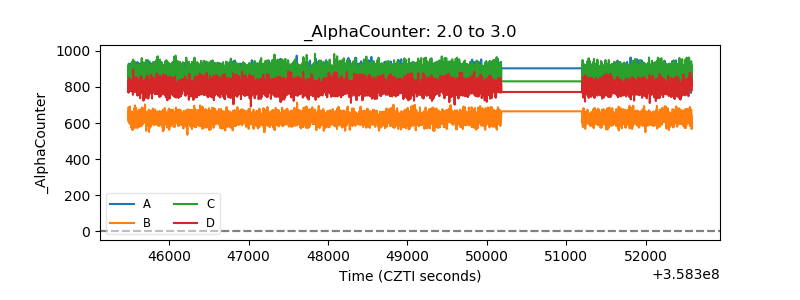 |
| _CPM_Rate | 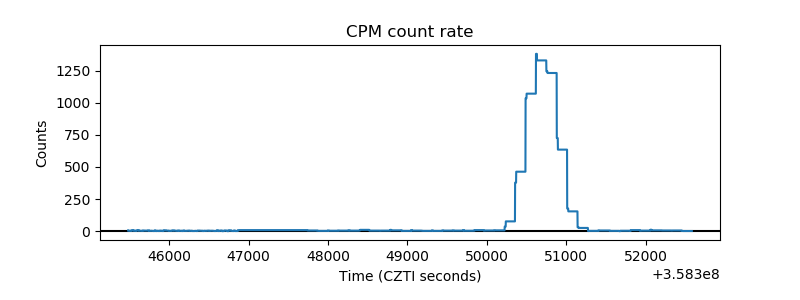 |
| CZT Counter | 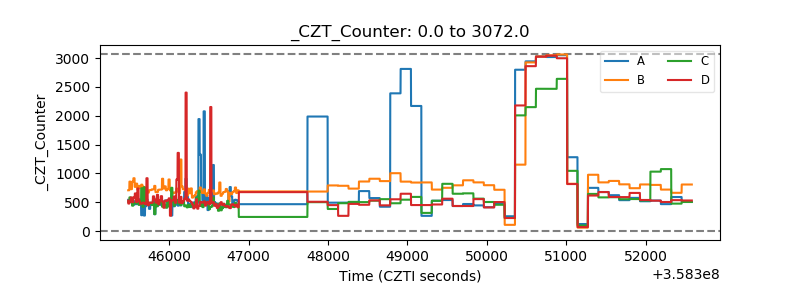 |
| +2.5 Volts monitor |  |
| +5 Volts monitor |  |
| _ROLL_ROT | 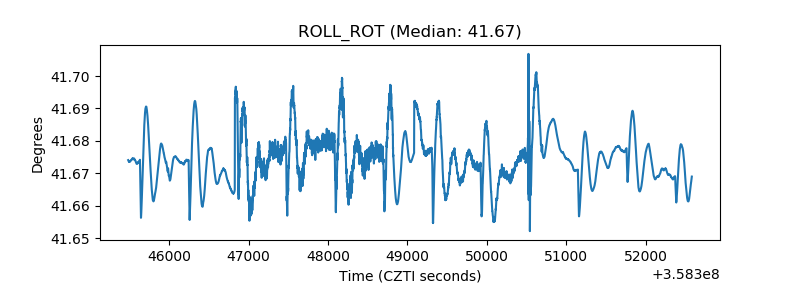 |
| _Roll_DEC | 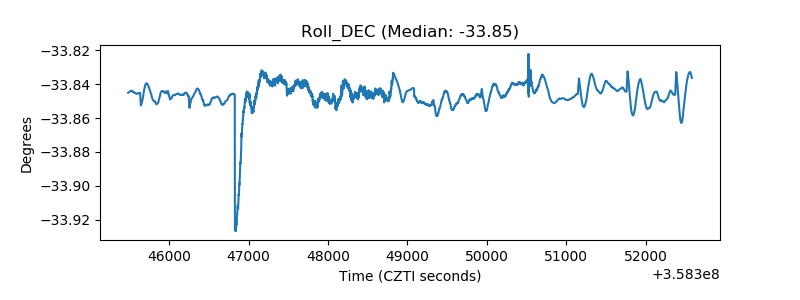 |
| _Roll_RA | 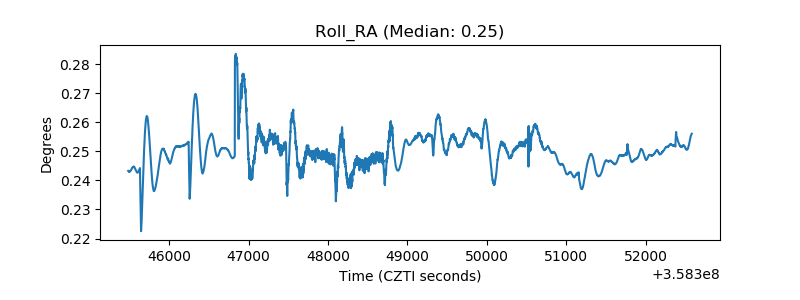 |
| Veto Counter | 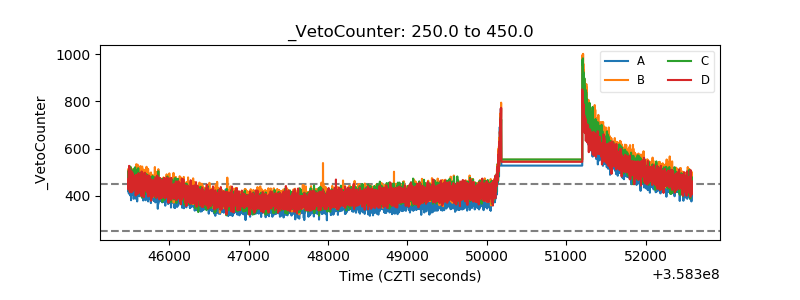 |